
Solution | Store Segmentation#
Overview#
Business case#
The evolving customer landscape requires an increased, hyper-focus on the consumer. Retailers and their partners are expected to deliver the right products, in the right quantities, in the right stores and at the right prices. These expectations require retailers to develop sales and merchandising strategies that deliver on the shopper need at the local level.
This plug-and-play Solution enables you to group stores with similar characteristics using demographic and sales data to optimize operations. This data-driven approach aids in store planning, product allocation, promotion strategies, and assortment execution.
Installation#
From the Design homepage of a Dataiku instance connected to the internet, click + Dataiku Solutions.
Search for and select Store Segmentation.
If needed, change the folder into which the Solution will be installed, and click Install.
Follow the modal to either install the technical prerequisites below or request an admin to do it for you.
Note
Alternatively, download the Solution’s .zip project file, and import it to your Dataiku instance as a new project.
Technical requirements#
To use this Solution, you must meet the following requirements:
Have access to a Dataiku 12.6+ instance.
To benefit natively from the Solution, you should store your data (see Data requirements) in one of the following connections:
Snowflake
Filesystem managed connection (the Solution comes with demo data using this connection type)
You don’t need a code environment to use this Solution.
Data requirements#
The Dataiku Flow was initially built using publicly available data. However, we intend for you to use this project with your own data, which you can upload using the Project Setup. Below are the input datasets used to build the Solution:
To better prepare these datasets, you can also help yourself with the Data Model article in the wiki.
Mandatory Datasets:
- stores
Column
Type
Description
store_id
[string]
Unique identifier for a store
latitude
[double]
Store location latitude coordinate
longitude
[double]
Store location longitude coordinate
- transactions
Column
Type
Description
transaction_date
[date]
Date of the transaction
store_id
[string]
Unique identifier for a store
product_id
[string]
Unique identifier for a product
product_purchase_price
[double]
Price of the product at time of purchase
product_quantity
[double]
Quantity of the product bought
transaction_id
[string]
Unique identifier for a transaction
- census_data: mandatory only for the demographic segmentation.
Column
Type
Description
census_polygon
[string]
Census area for which all the demographic information is gathered
population_count
[integer]
Number of inhabitants per census area
age_A_B
[integer]
Number of inhabitants per census area who are between A and B years old
income
[integer]
Average income per census area
occupation_X
[integer]
Number of inhabitants per census area having job occupation X
household_composition_couple
[integer]
Number of inhabitants per census area living as a couple
household_composition_family
[integer]
Number of inhabitants per census area living in a family with at least one child
household_composition_other
[integer]
Number of inhabitants for other types of household per census area
gender_female
[integer]
Number of female inhabitants per census area
gender_male
[integer]
Number of male inhabitants per census area
gender_other
[integer]
Number of inhabitants who identified as another gender, per census area
native
[integer]
Number of inhabitants per census area who have the countries’ citizenship
non-native
[integer]
number of inhabitants per census area who don’t have the countries’ citizenship
work_from_home
[integer]
Number of inhabitants working from home per census area
work_outside
[integer]
Number of inhabitants working outside of home
- products: mandatory only for the sales per category segmentation.
Column
Type
Description
product_id
[string]
Unique identifier for a product
target_category
[string]
Level of the category(ies) to analyze; contains all the possible category values
sub_category_1
[string]
First sub-category level under the target category
sub_category_X
[string]
Any other sub-categories under sub_category_1
Workflow overview#
You can follow along with the sample project in the Dataiku gallery.
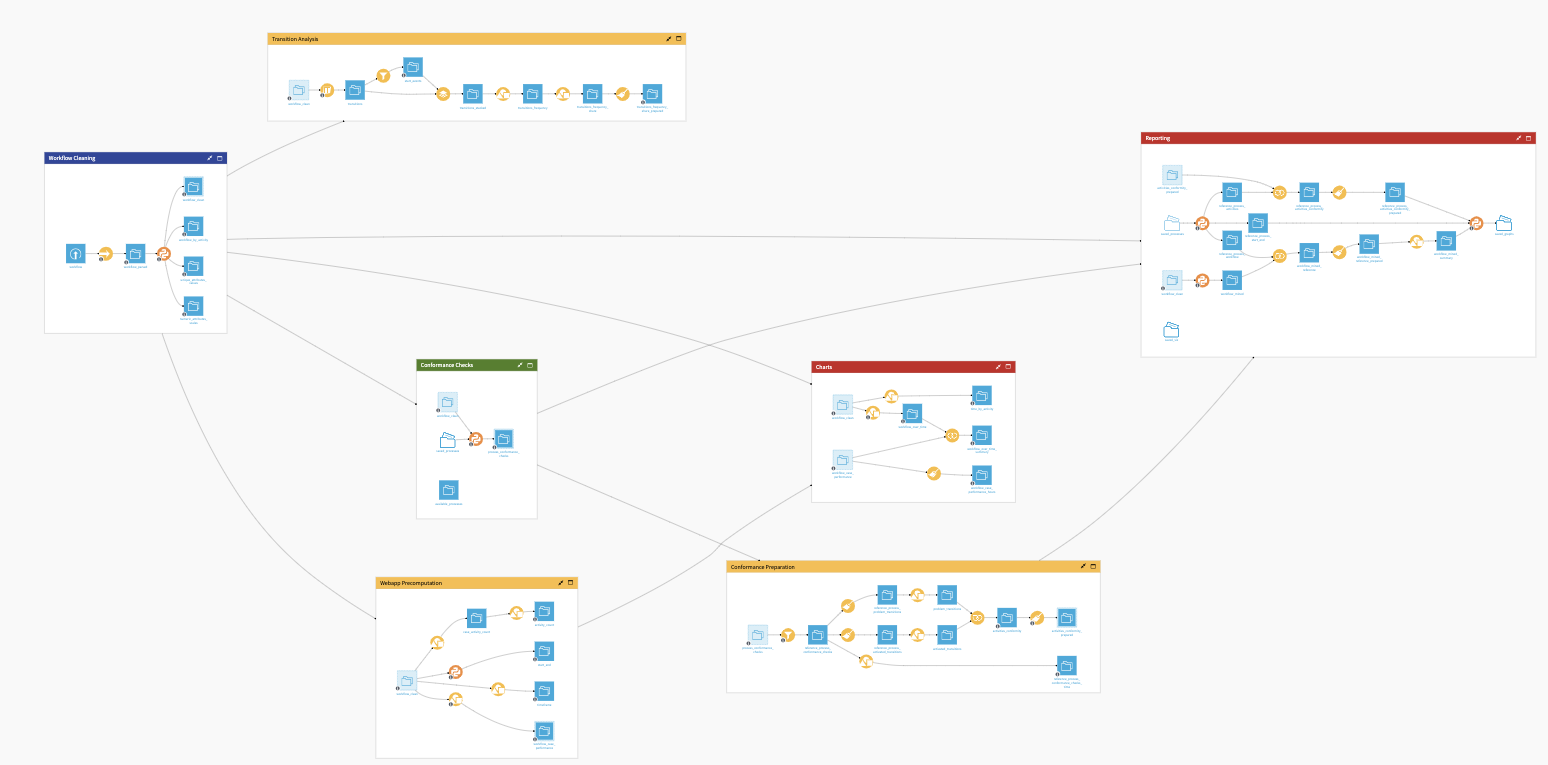
The project has the following high-level steps:
Connect your data as an input, and select your analysis parameters via the Project setup.
Run the Flow to prepare the data, create the features, and train the models.
Explore the results in the demographic and/or sales per category dashboards.
Walkthrough#
Note
In addition to reading this document, it’s recommended to read the wiki of the project before beginning to get a deeper technical understanding of how this Solution was created and more detailed explanations of Solution-specific vocabulary.
Preparation questions#
Setting up the Solution requires some knowledge of data science. You may want to ask a data scientist or another technical colleague for assistance.
To begin, you will need to answer some questions before setting up the project with your own data and parameters. The questions are:
In which country are your stores located?
For which time period do you want to analyze store sales performance?
Do you want to analyze your stores based on the population living around them? Or do you want to analyze your stores based on your category’s sales performance? Or both?
Analyze stores based on the population around them#
The Solution examines the population living in your store trade areas, which are calculated within the Solution. How far do your trade areas extend from your stores?
Do you want to segment your stores based on absolute sub-population counts?
Or do you want to segment your stores based on relative sub-population counts?
Do you want a specific number of clusters? Or do you prefer to use the default numbers (it will be either 3, 4, or 5 clusters depending on the model’s performance)?
Analyze stores based on a category’s sales performance#
Do you want to segment your stores based on total category revenue or category revenue share within a store?
Or do you want to segment your stores based on within each store?
Do you want a specific number of clusters, or do you prefer to use the default numbers (it will be either 3, 4, or 5 clusters depending on the model’s performance)?
With answers to these questions, the data scientist should be able to set up the Solution.
Project setup#
Here is an overview of the Project Setup and how to use it.
Connection settings#
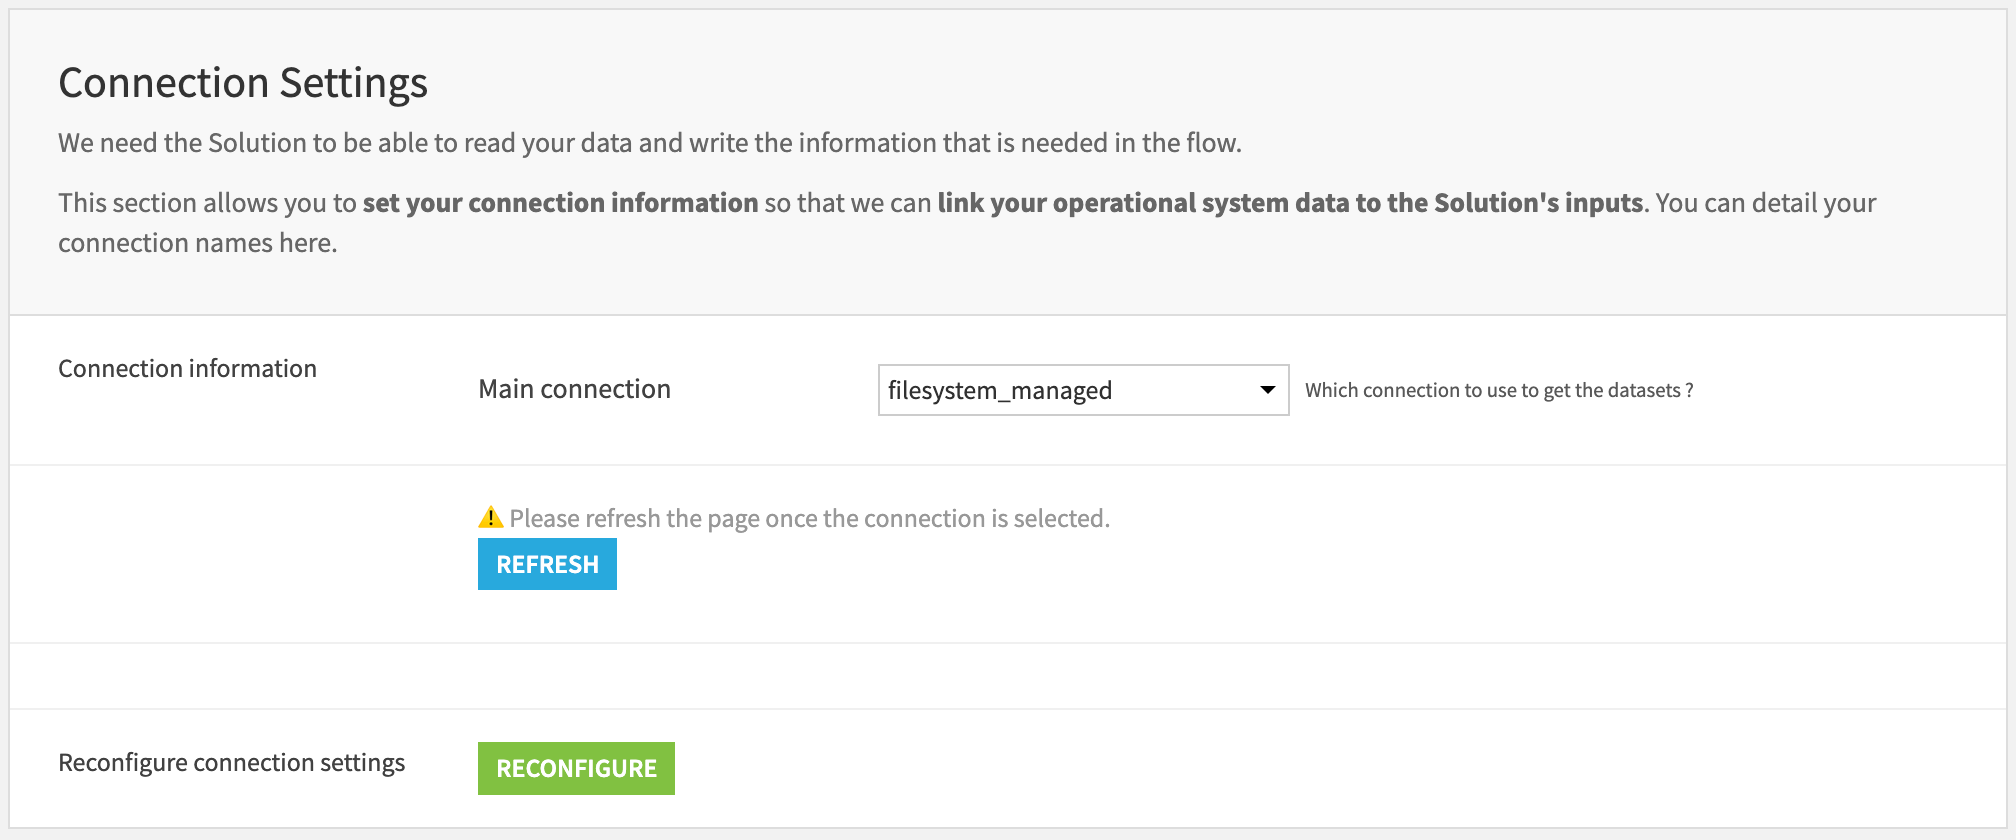
The project is initially shipped with all datasets using the filesystem connection. The user can either leave it this way by not modifying the connection settings section or switch to their preferred connection. First, select the connection from the list of available connections. Then, press the REFRESH button to display the filesystem connection settings.
Important
If the main connection is either Redshift, Synapse, or BigQuery, you will need to select a filesystem connection because processes might need to be written in a filesystem connection.
If the main connection is either S3, Azure, or Google Cloud Storage, you will need to choose an advanced file format.
Then, press RECONFIGURE to switch the dataset connections on the Flow.
Store segmentation strategies#
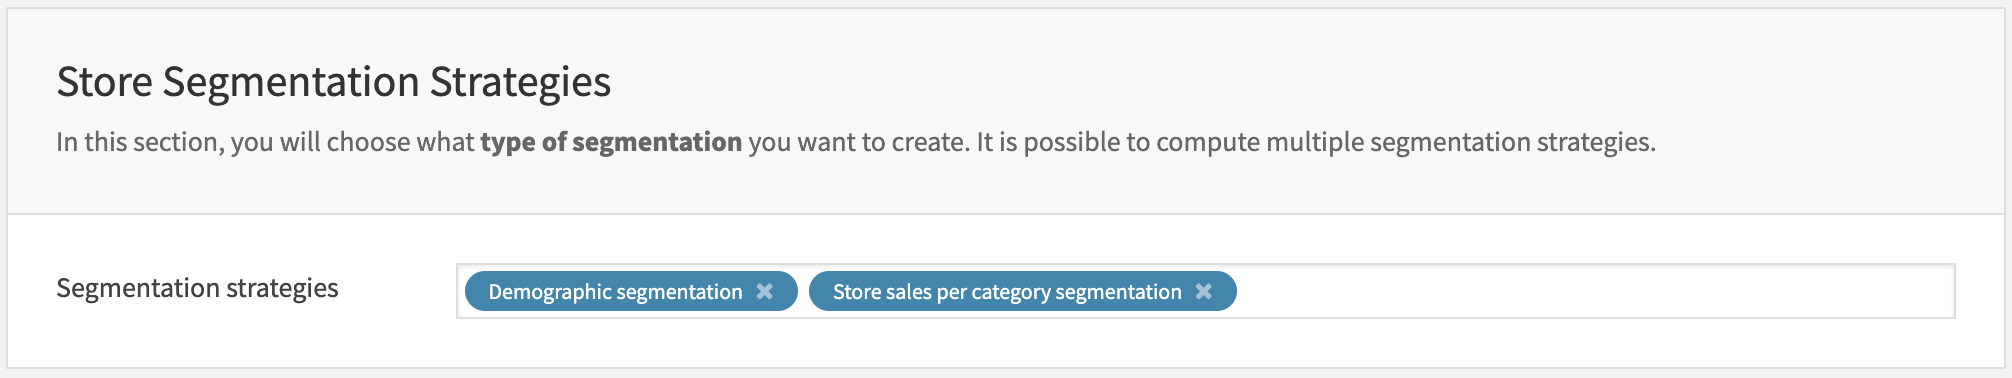
This section lets you choose one or multiple store segmentation strategies.
Data loading and store preprocessing#
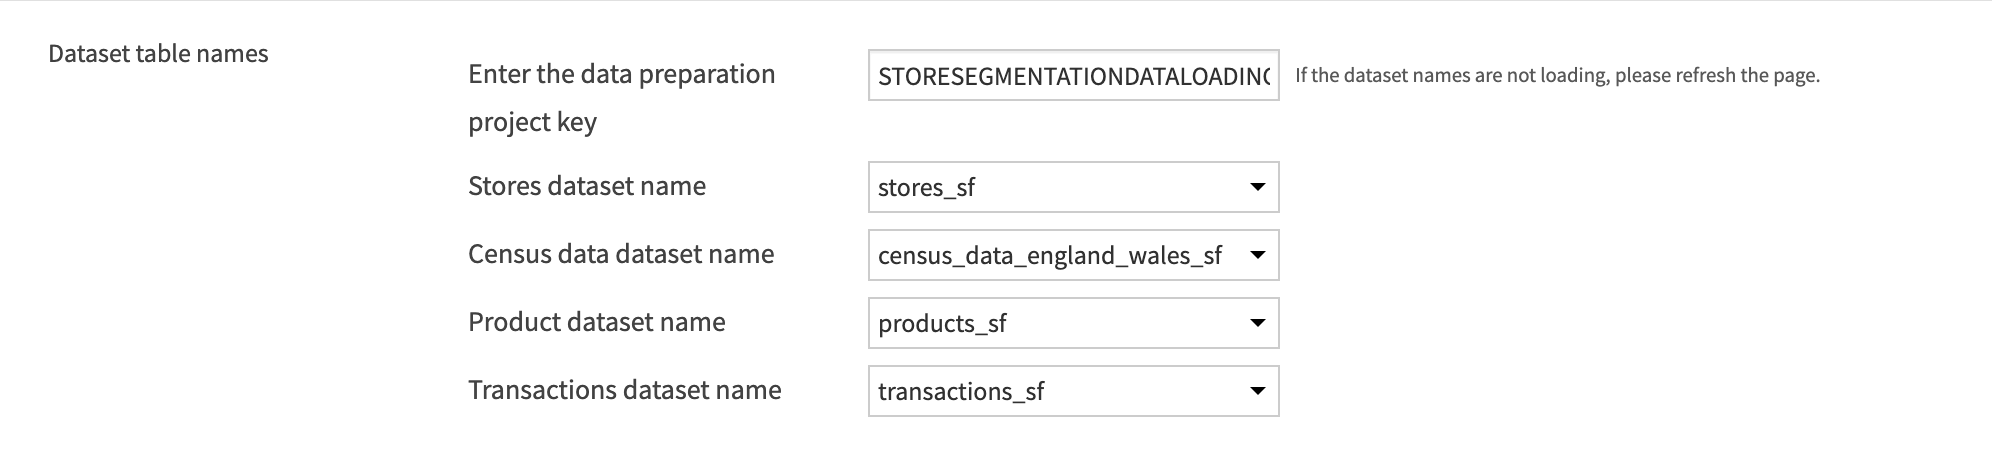
In this section, you can load the datasets required for the segmentation strategies selected above. You need to store the datasets in a data preparation project, on the same connection as the one selected above. You need to enter the project key of the data preparation project, which you can find in its URL:
Once you have entered the project key in the text box and selected the datasets, you can click on the Run Now button.
Once the inputs successfully run, you can refresh the page by clicking Refresh to update the data displayed on the Project Setup page.
Transaction preprocessing#
The Store Segmentation Solution focuses on a certain time period since it uses transactional data.
The first Run button will display the first and last transaction dates available in the loaded dataset.
To display the first and last transaction dates, click on the Refresh button.
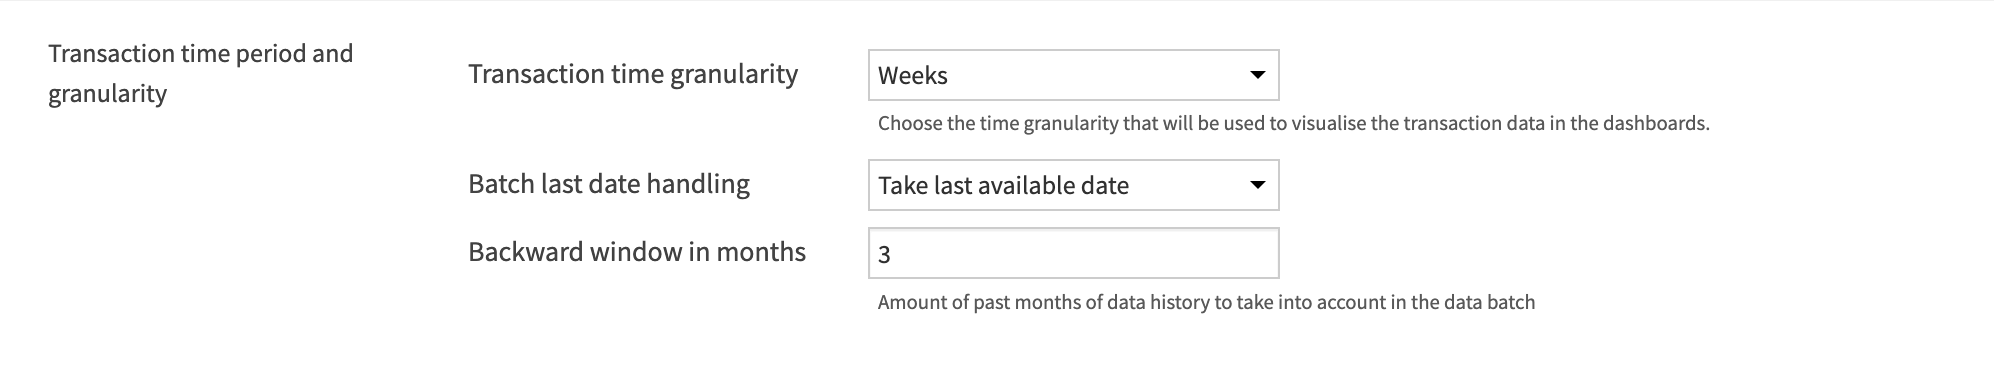
Then, you can define the time granularity that will be used to visualize the transaction data in the dashboards. You can choose between days, weeks, months, or quarters.
Finally, defining the time frame is done by selecting its last date, either by taking the last one available in your data or by explicitly choosing it. Then, you can select a backward window in months.
You can click on the Run Now button to preprocess the transactional data.
Demographic segmentation#
Store preprocessing#
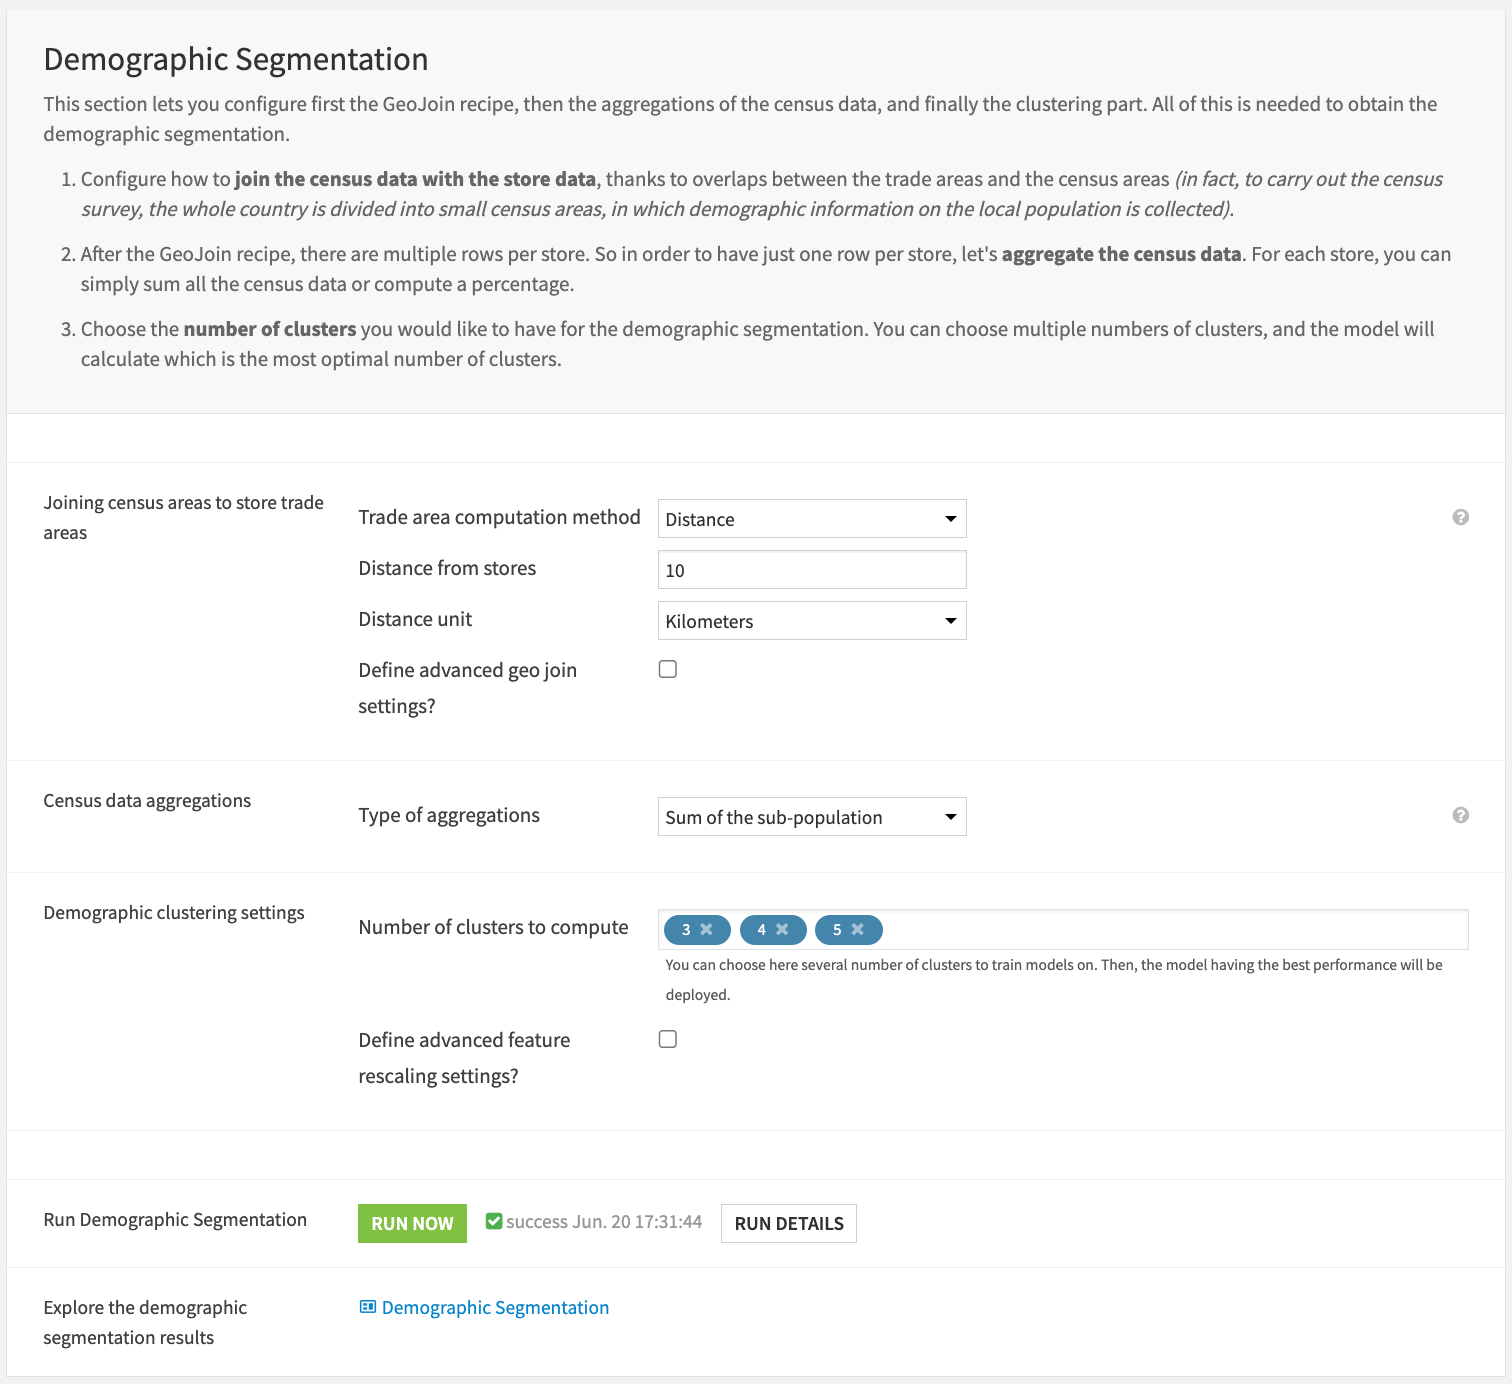
If you have selected the demographic segmentation, you can first set up the Geo join recipe for joining the census and store data.
To join the census and store data, you can create a trade area around each store. You can create this trade area based on either distance (a circular area around the store) or time travel with a certain transportation mode.
First, select the trade area computation method: either distance or time travel.
If it’s distance, define the distance from the store (it must be an integer) and the distance unit: either Kilometers or Miles.
If it’s time travel, define the time from the stores in minutes and the transportation mode: either car, bicycle, or pedestrian.
Demographic feature engineering#
After defining the trade area, you can optionally define how the census data and store data will be joined. The default setting is “Join census areas if they’re contained in the trade area.”
Regarding the census data feature engineering, you can decide whether to sum the sub-population counts or calculate a percentage of the sub-population over the total population in the trade area.
Demographic clustering and results#
Finally, you can choose the number of clusters you would like to test or have, or leave the default numbers. If you choose several numbers of clusters to train models on, then the model having the best performance will be deployed.
You can also choose to define advanced feature rescaling settings: either min-max rescaling or standard rescaling. The default rescaling method is min-max.
If the demographic clustering model has already been trained, you can choose to either retrain it or not.
At this point, you can click on Run Now to execute the whole demographic branch and then view the results on the demographic dashboards.
Sales per category segmentation#
Sales per category feature engineering#
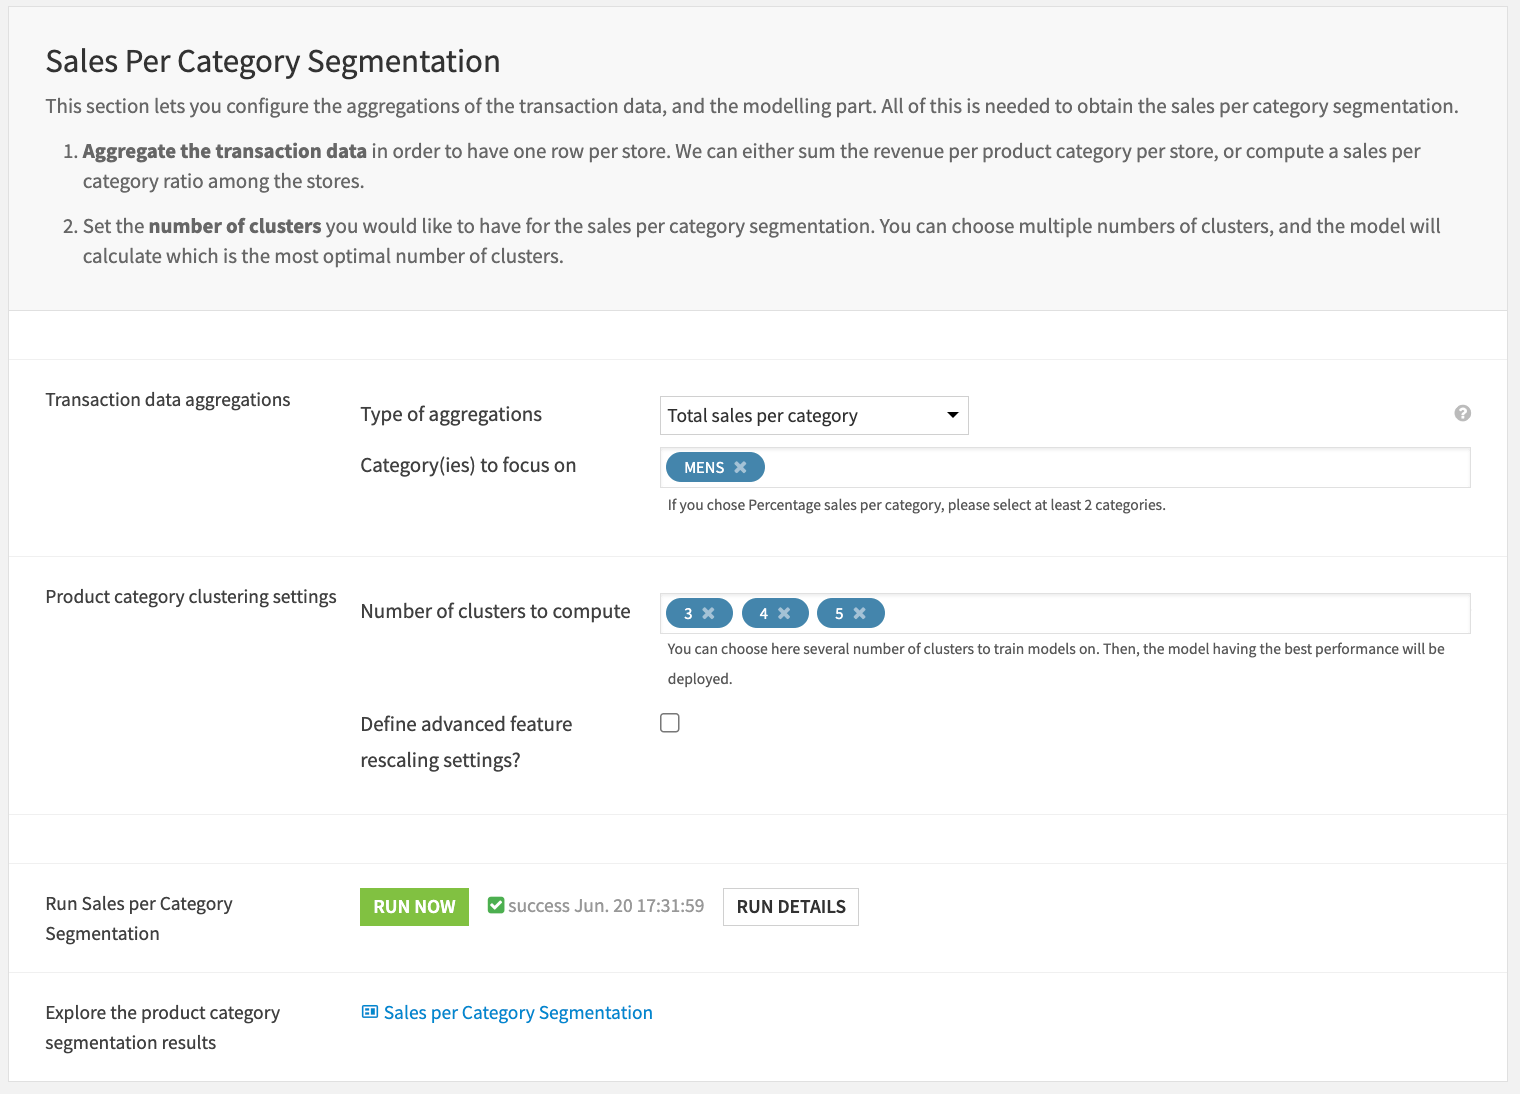
If you have selected the sales per category segmentation strategy, you need to define some feature engineering settings, as well as clustering settings.
As you aggregate the transactional data for each store, you either sum the total sales per category or calculate the category share in each store.
You can also choose which category(ies) you want to analyze. The categories suggested are from the target_category column in the products dataset.
Sales per category clustering and results#
Finally, you can choose the number of clusters you would like to test or have, or leave the default numbers. If you choose several numbers of clusters to train models on, then the model having the best performance will be deployed.
You can also choose to define advanced feature rescaling settings: either min-max rescaling or standard rescaling. The default rescaling method is min-max.
If the sales per category clustering model has already been trained, you can choose to either retrain it or not.
At this point, you can click on Run Now to execute the whole sales per category branch and then view the results on the sales per category dashboards.
Dashboards#
Once everything runs successfully, you can view the dashboards. Each dashboard has two pages: one for the segmentation results and another for the clustering model analysis.
The first page is typically for a business user, while the second page is for a technical user, such as a data scientist, to monitor model performance.
Demographic dashboard#
The main idea of the demographic dashboard is to provide insights into the population living around the stores, as well as monitoring the performance of the clustering model.
Tip
The Segmentation Results page is for a business user, while the Clustering Model Analysis page is for a technical user.
Segmentation results#
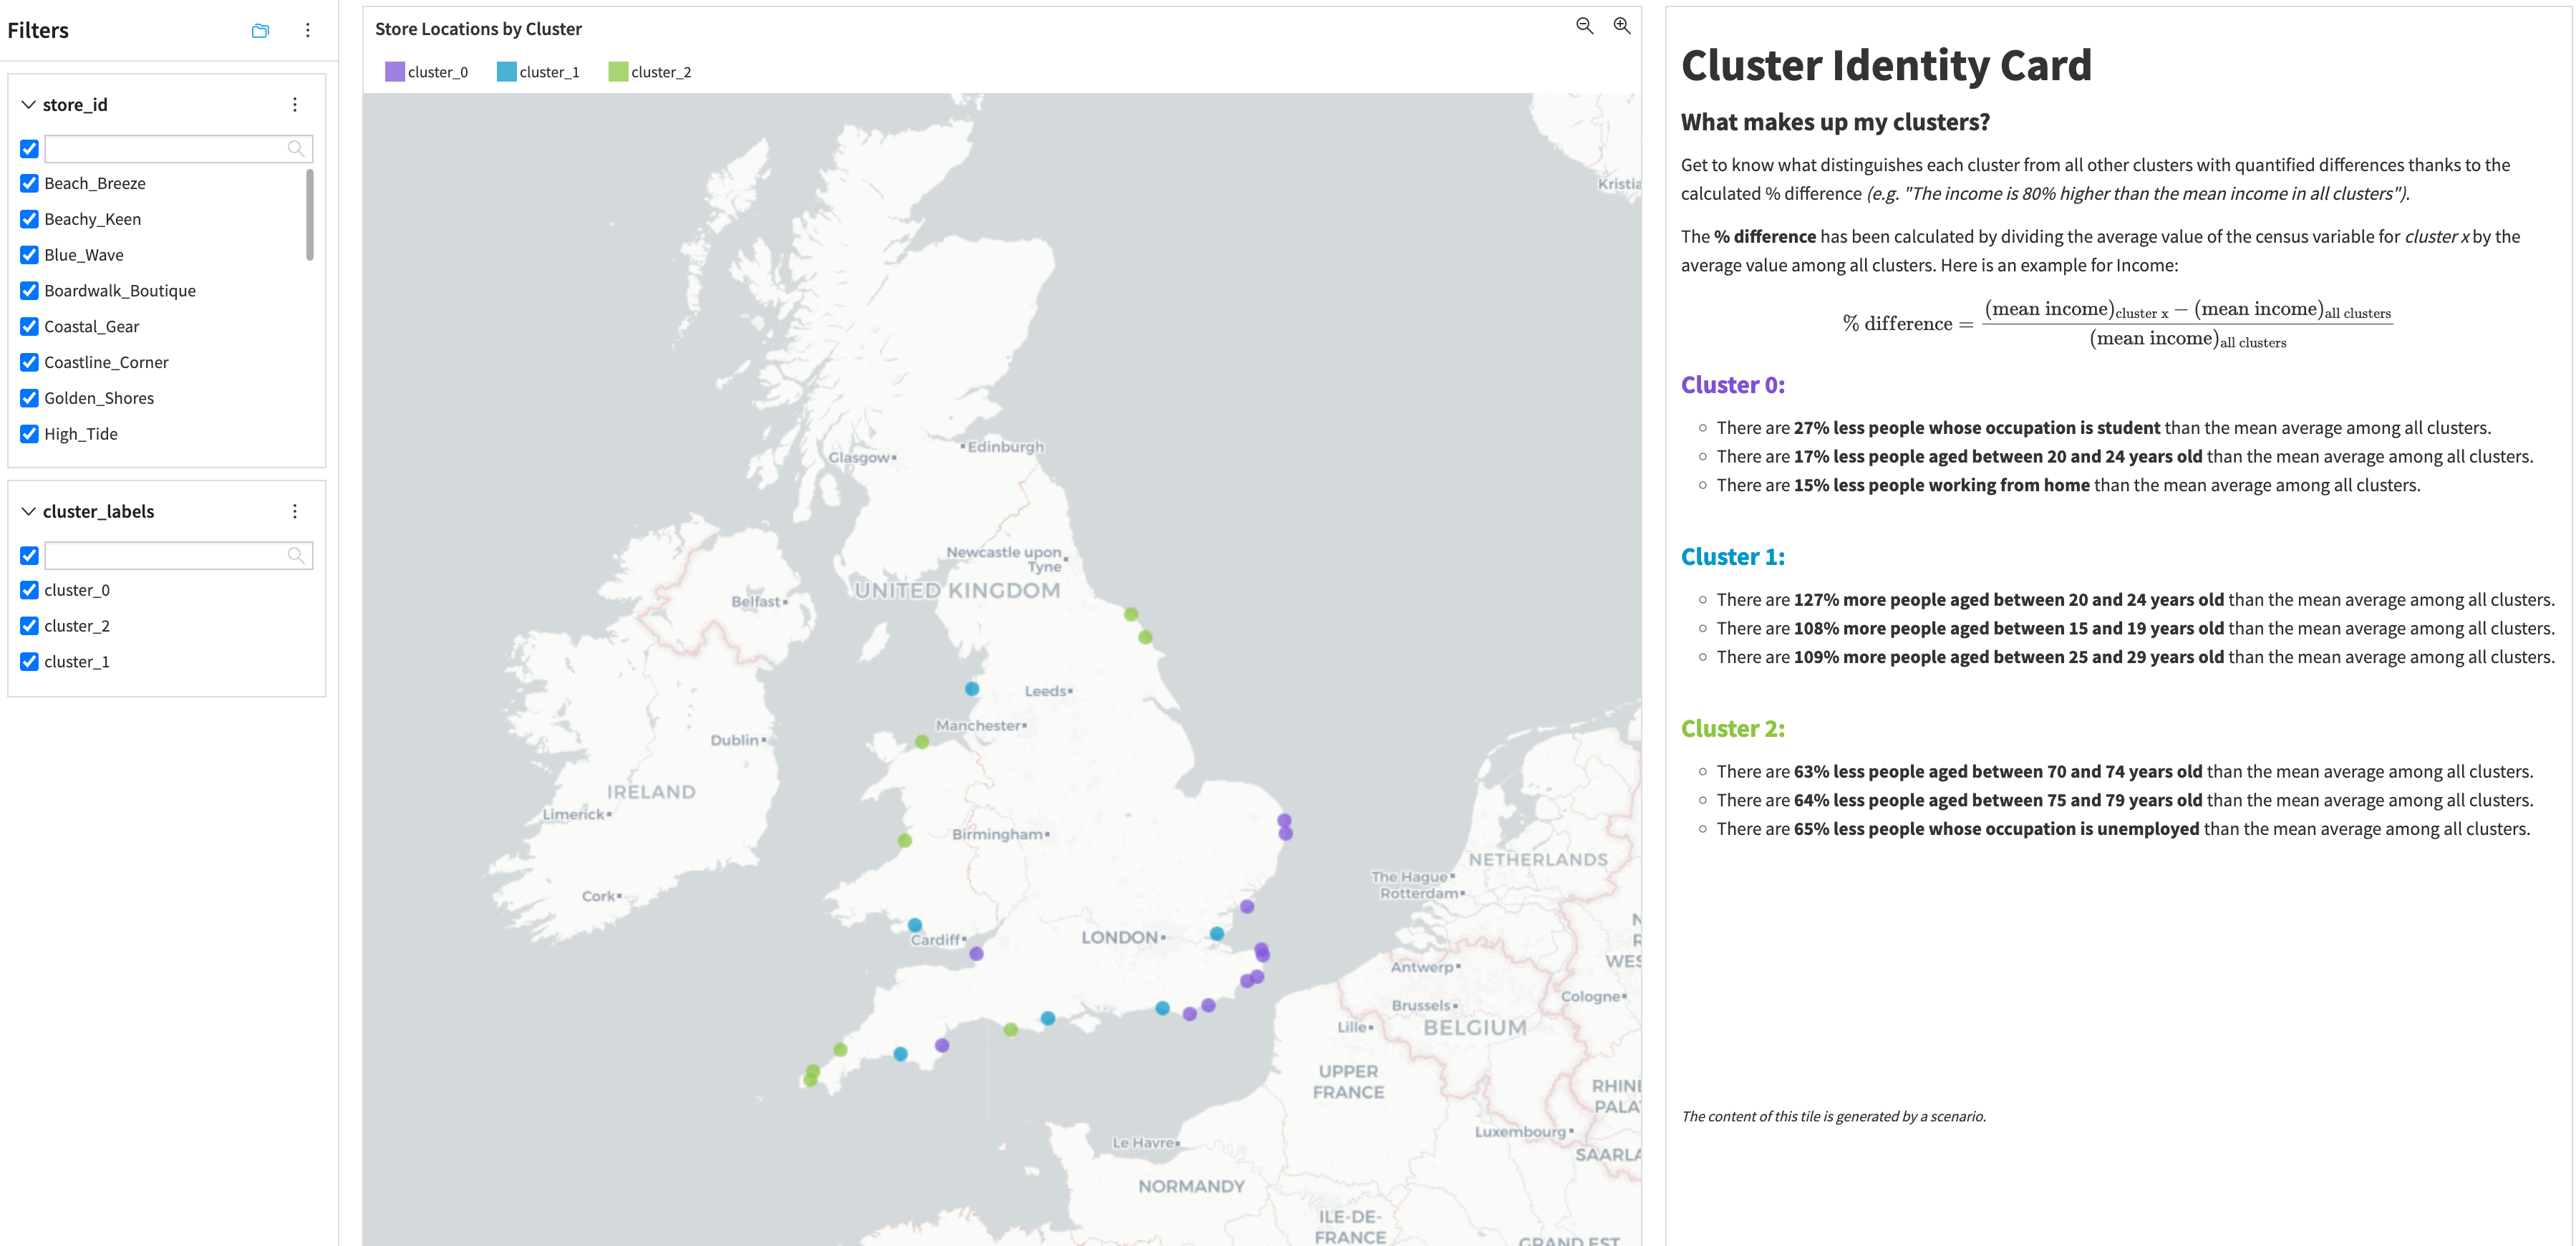
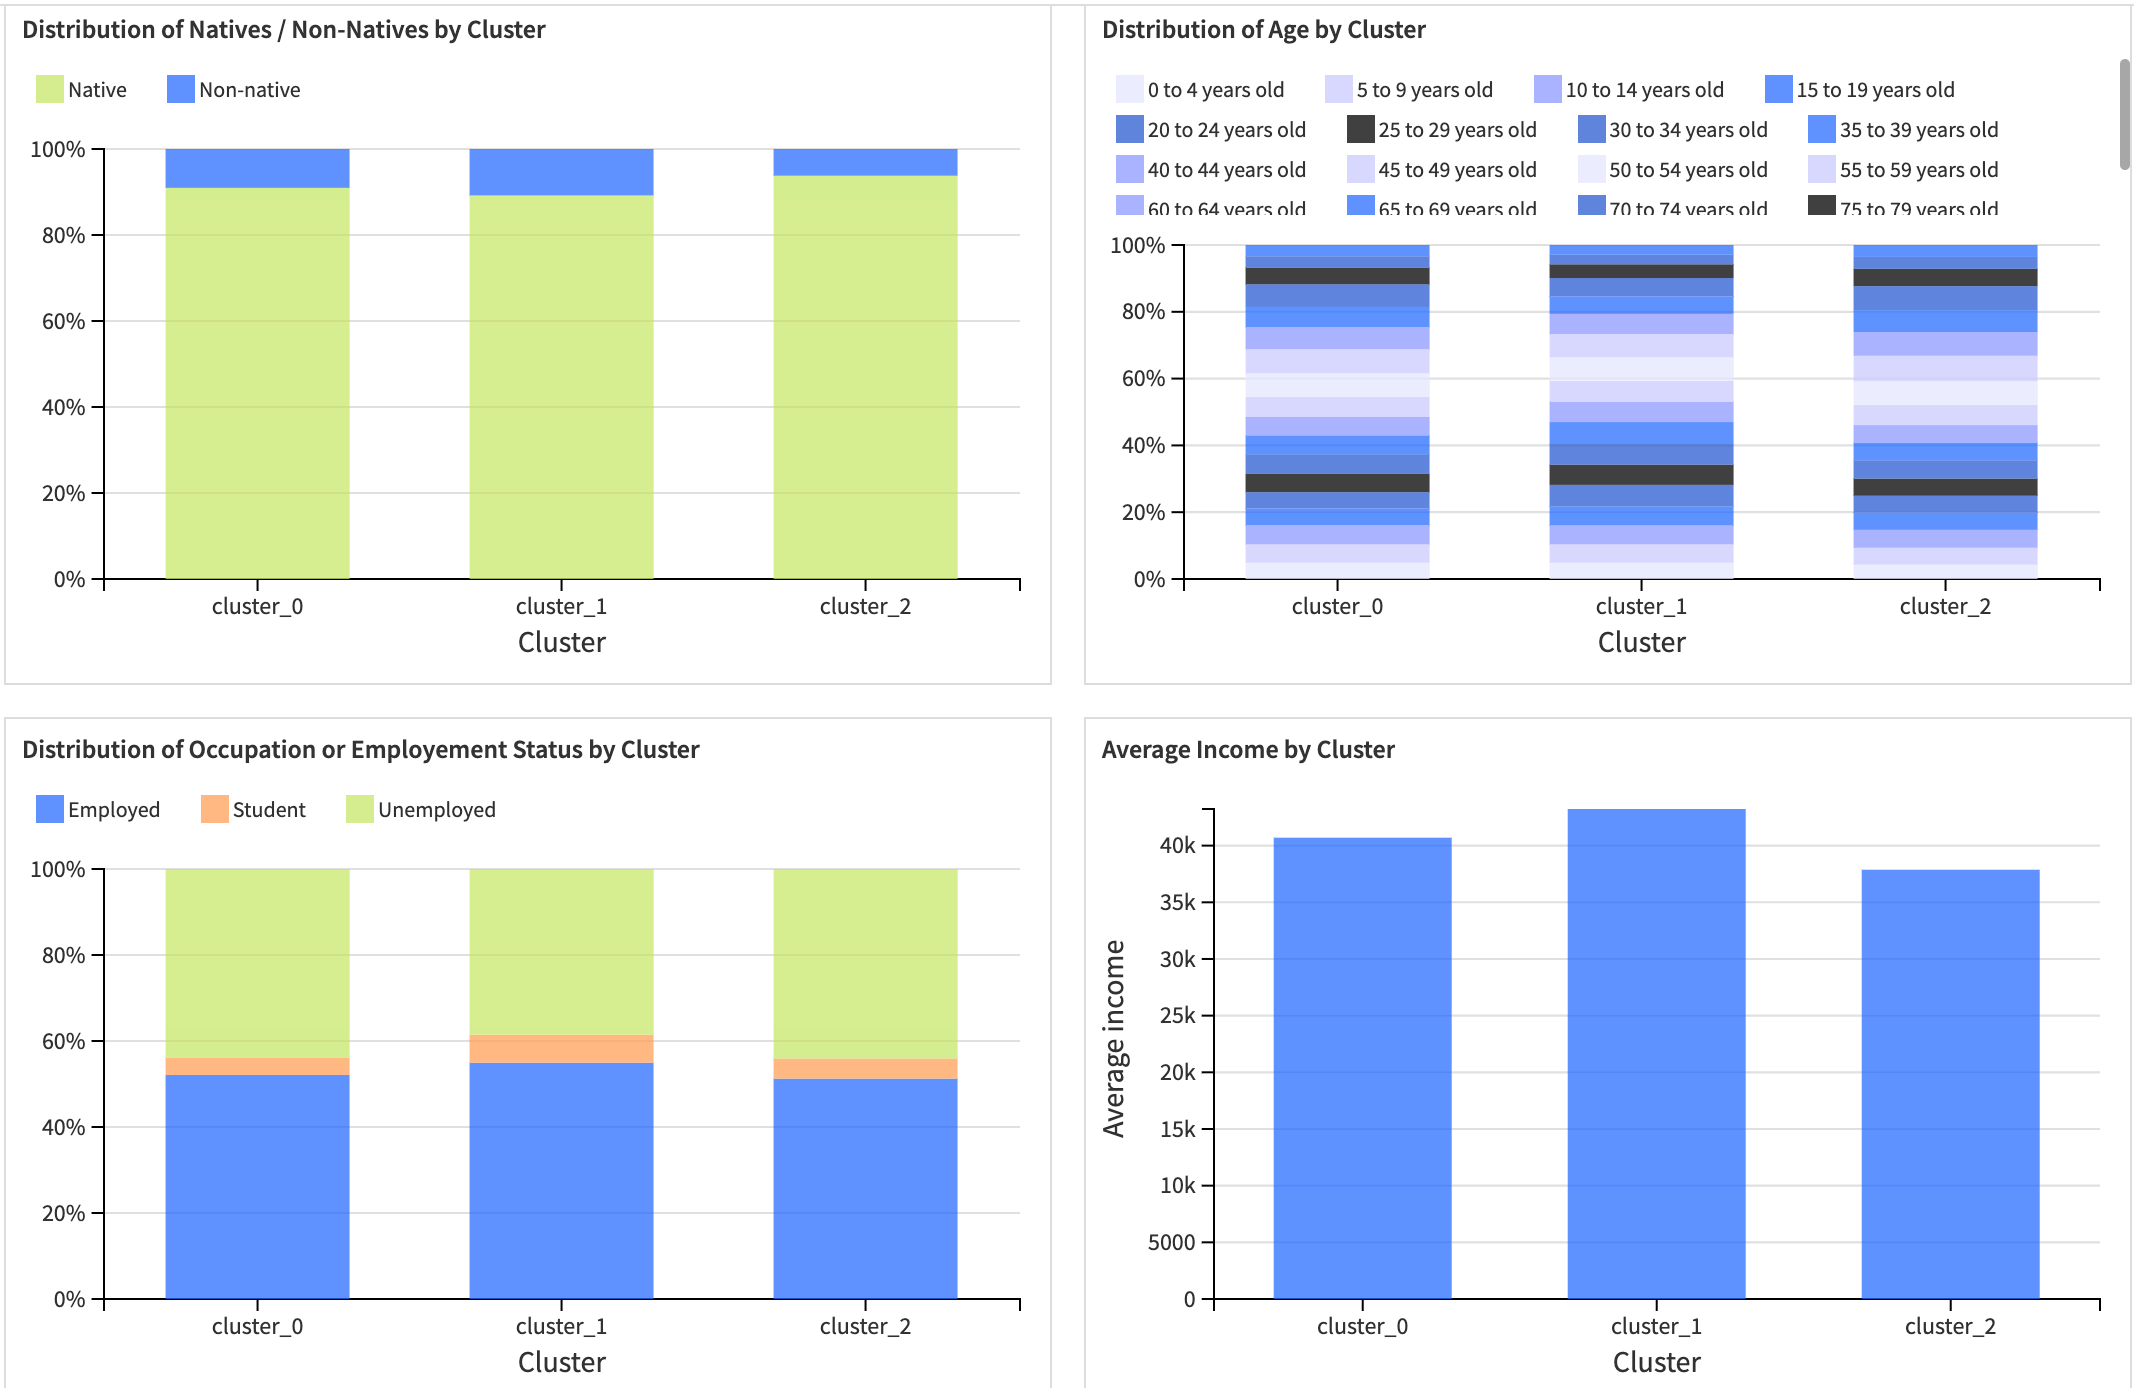
This dashboard will help you better understand the demographic patterns specific to each cluster.
By analyzing these clusters, you can help yourself with a map and this Cluster Identity Card, which describes the characteristics of each cluster. Furthermore, you can explore more insights about the population’s characteristics in each cluster (gender, nationality, age groups, occupation, income, workplace, and household composition).
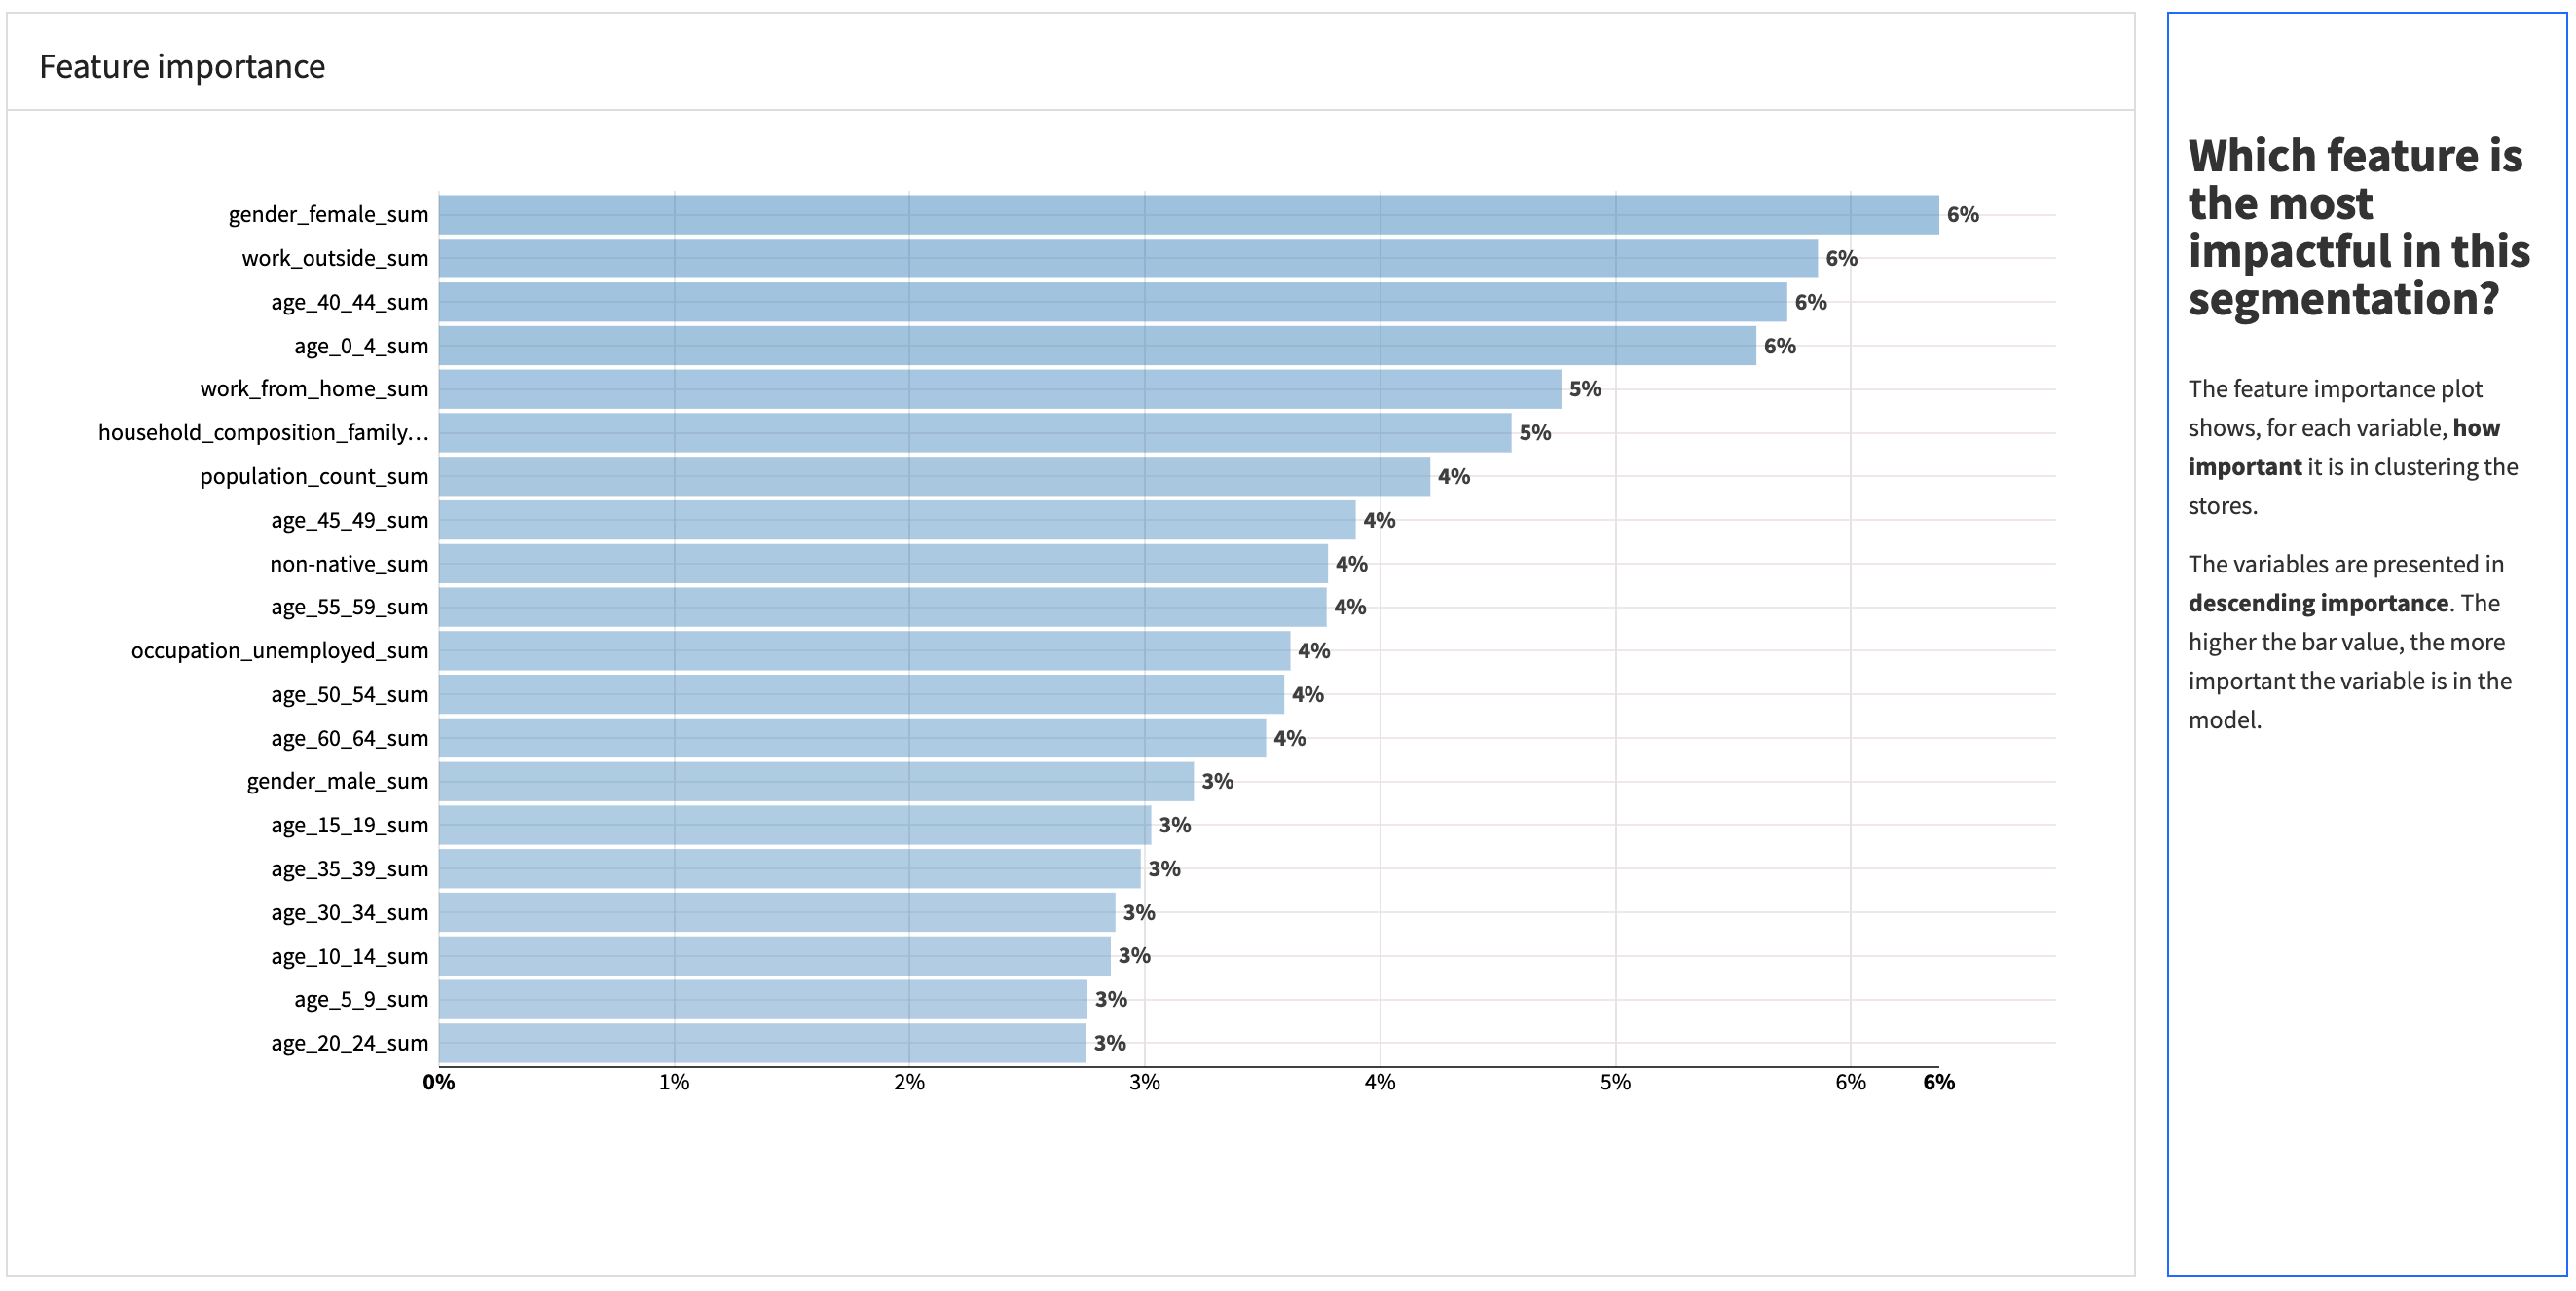
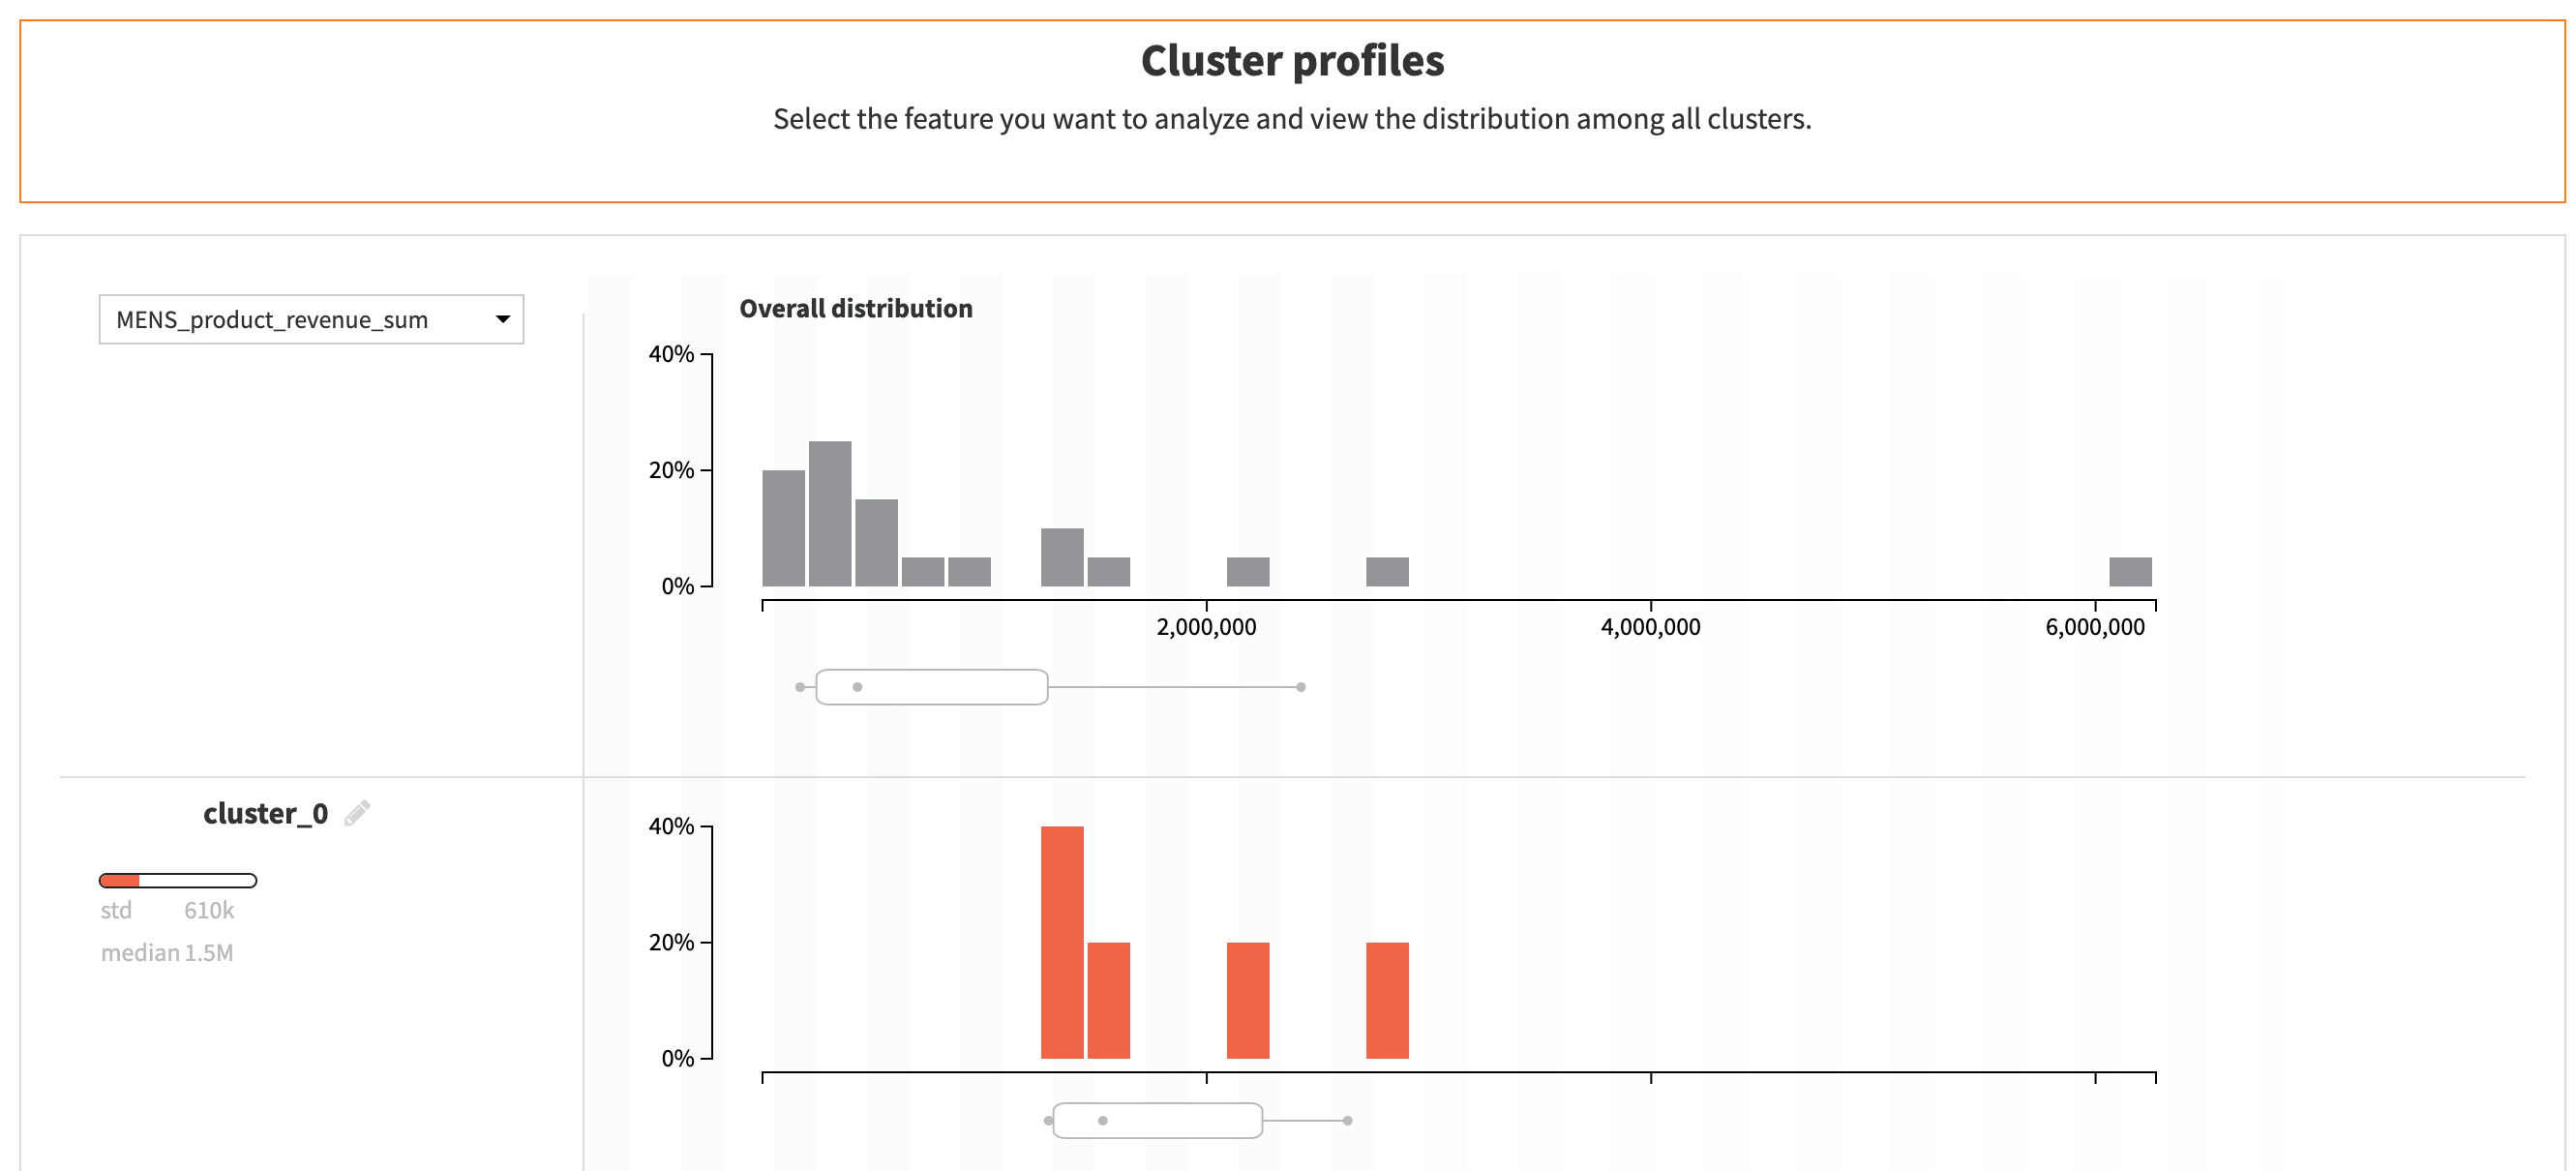
Clustering model analysis#
This page is for a technical user, such as a data scientist, to monitor model performance. It provides insights into the model’s performance, such as the silhouette score, the feature importance, and the cluster profiles.
Sales per category dashboard#
The main idea of the sales per category dashboard is to provide insights into the product category(ies) sales performance by cluster, as well as monitoring the performance of the clustering model.
Thus, the “Segmentation Results” page is for a business user, while the “Clustering Model Analysis” page is for a technical user.
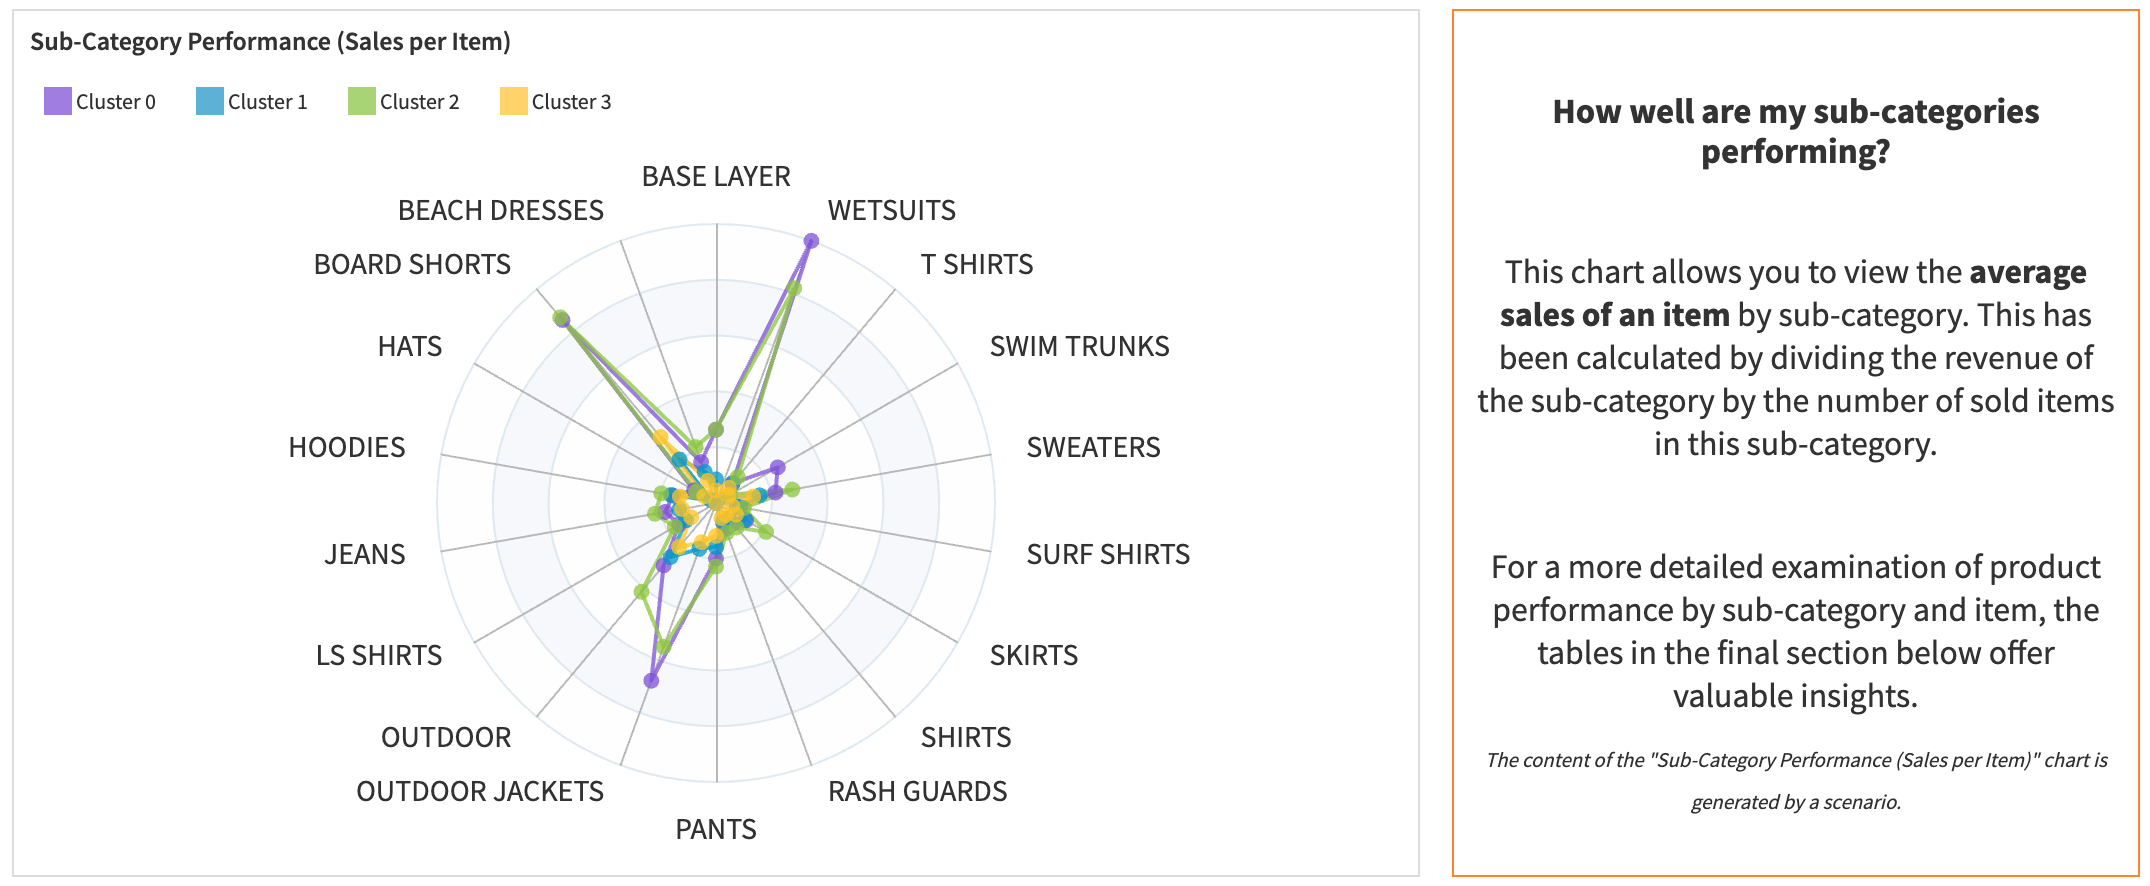
Segmentation results#
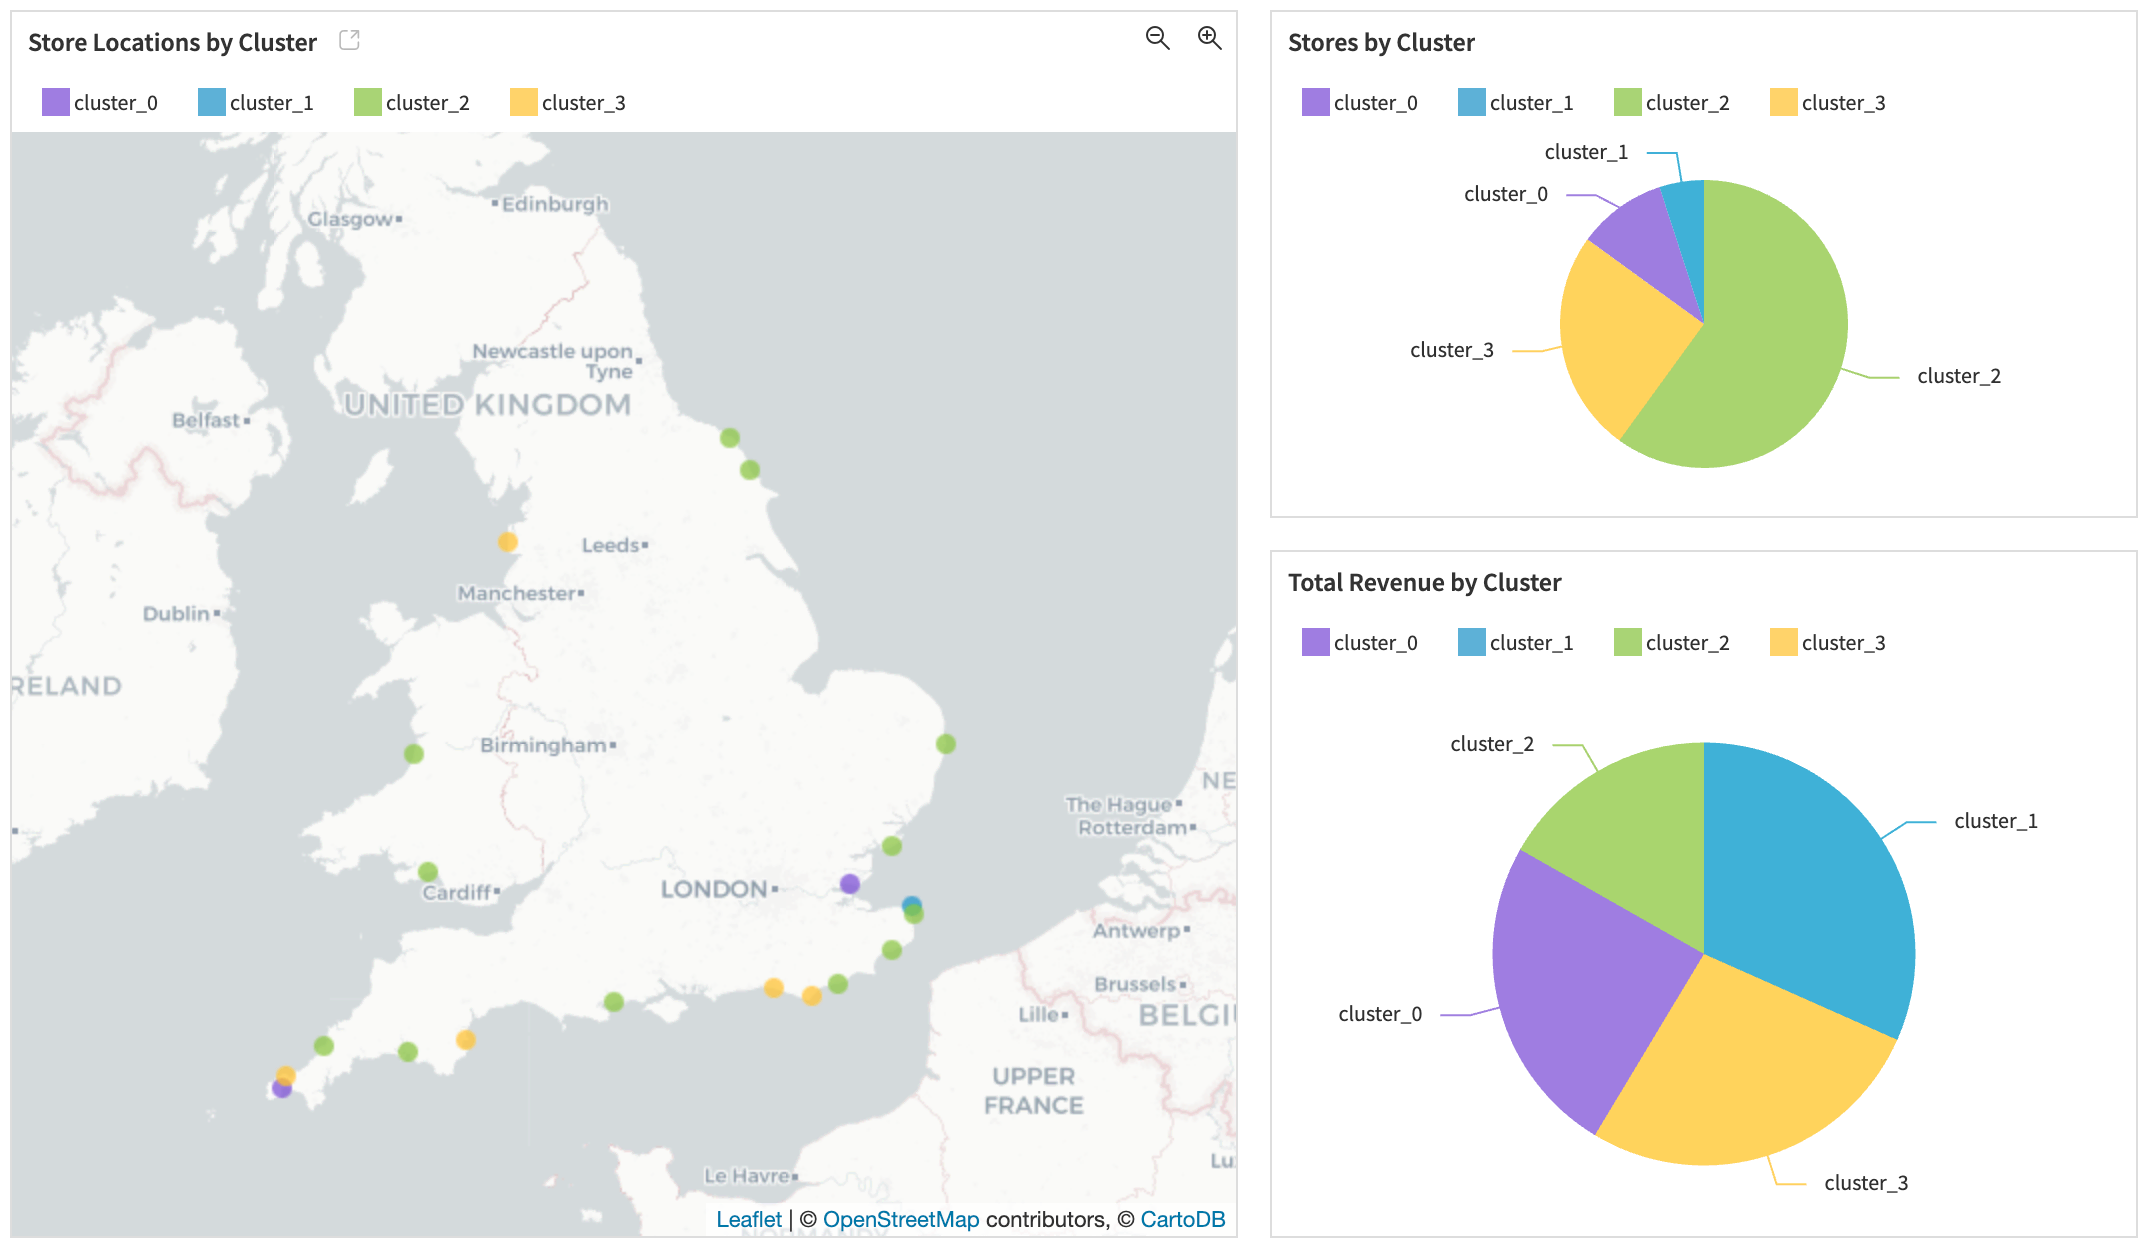
The Sales per Category dashboard will help you understand not only your stores’ performance in each category, but also the performance at the sub-category and product levels.
You will be able to explore the clusters on a map, analyze the evolution and distribution of revenue per cluster, view a radar chart on sub-category performance, and find a table ranking the sub-category and product performances.
Clustering model analysis#
This page is built the same way as the demographic one. It’s made for a technical user, such as a data scientist, to monitor model performance. It provides insights into the model’s performance, such as the silhouette score, the feature importance, and the cluster profiles.
Reproducing these processes with minimal effort for your data#
This project equips category managers, marketing teams, retail real estate managers to have a plug-and-play Solution built with Dataiku to optimize product assortments and merchandising strategies, to adjust marketing campaigns and promotions, and to analyze store performance for relocation, openings, and closures.
This documentation has provided several suggestions on how to derive value from this Solution. Ultimately however, the “best” approach will depend on your specific needs and data. If you’re interested in adapting this project to the specific goals and needs of your organization, Dataiku offers roll-out and customization services on demand.