
Solution | Customer Lifetime Value Forecasting#
Overview#
Business case#
The consumer landscape continues to evolve in an increasingly competitive marketplace, placing customer loyalty under threat. As a result, it’s imperative brands attract and retain high-value customers through impactful initiatives that maximize their value.
Customer lifetime value (CLV) is fundamental for companies to understand, track, and work to increase customer value over time. Investing in the long-term retention of your most valuable customers can yield incredible results: a 5% increase in customer retention rates can increase profits by between 25% and 95%.
Forecasted CLV boils down to keeping your customers coming back again and again to repurchase over their lifetime with your company. When you combine CLV with various transactional data, demographic insight, and other key metrics like customer acquisition cost, you get an even clearer view of your most important customers. This provide greater insight for further action.
Dataiku’s Customer Lifetime Value Solution is designed to address practical and necessary use cases for business users, enabling you to:
Develop an understanding of your customer base.
Build customer groups.
Forecast customer lifetime value.
Integrate all of the above in your sales and marketing strategies.
Installation#
From the Design homepage of a Dataiku instance connected to the internet, click + Dataiku Solutions.
Search for and select Customer Lifetime Value Forecasting.
If needed, change the folder into which the Solution will be installed, and click Install.
Follow the modal to either install the technical prerequisites below or request an admin to do it for you.
Note
Alternatively, download the Solution’s .zip project file, and import it to your Dataiku instance as a new project.
Technical requirements#
To use this Solution, you must meet the following requirements:
Have access to a Dataiku 13.2+* instance.
The Dataiku permission “May develop plugin” to modify the Project Setup post-installation.
A Python 3.9 code environment named
solution_clv_forecastwith the following required packages:
MarkupSafe<2.2.0
Jinja2>=2.11,<3.1
cloudpickle>=1.3,<1.6
flask>=1.0,<2.3
itsdangerous<2.1.0
lightgbm>=3.2,<3.3
scikit-learn==1.3.2
scikit-optimize>=0.7,<=0.10.1
scipy>=1.5,<1.11
statsmodels>=0.12.2,<0.14
Werkzeug<3.1
xgboost>=1.5.1,<2
tdigest>=0.5,<0.6
econml>=0.13,<0.16
pymc-marketing==0.4.2
plotly==5.23.0
Data requirements#
The Dataiku Flow was initially built using publicly available data. However, we intend for you to use this project with your own data, which you can upload using the Project Setup. Below are the input datasets that the Solution has been built with:
Dataset |
Description |
|---|---|
transactions_history (mandatory) |
Stores transactions with one line per transaction/customer/product |
customer_metadata (optional) |
Contains unique line for each customer_id and columns for each metadata value. The metadata are split into numerical metadata and categorical metadata in the Project Setup to use them in the classification and regression models. |
customer_rfm_segments (optional) |
Segmentation of customers at the month level provided by the Dataiku RFM Segmentation Solution. |
Workflow overview#
You can follow along with the Solution in the Dataiku gallery.
The project has the following high-level steps:
Process the historical transactions data.
Enrich monthly transaction data with RFM segments.
Compute current and future CLV.
Train models to predict future CLV.
Assess model performance.
Visualize and interpret analyses.
Walkthrough#
Note
In addition to reading this document, it’s recommended to read the wiki of the project before beginning to get a deeper technical understanding of how this Solution was created and more detailed explanations of Solution-specific vocabulary.
Identifying customer value in past transactions#
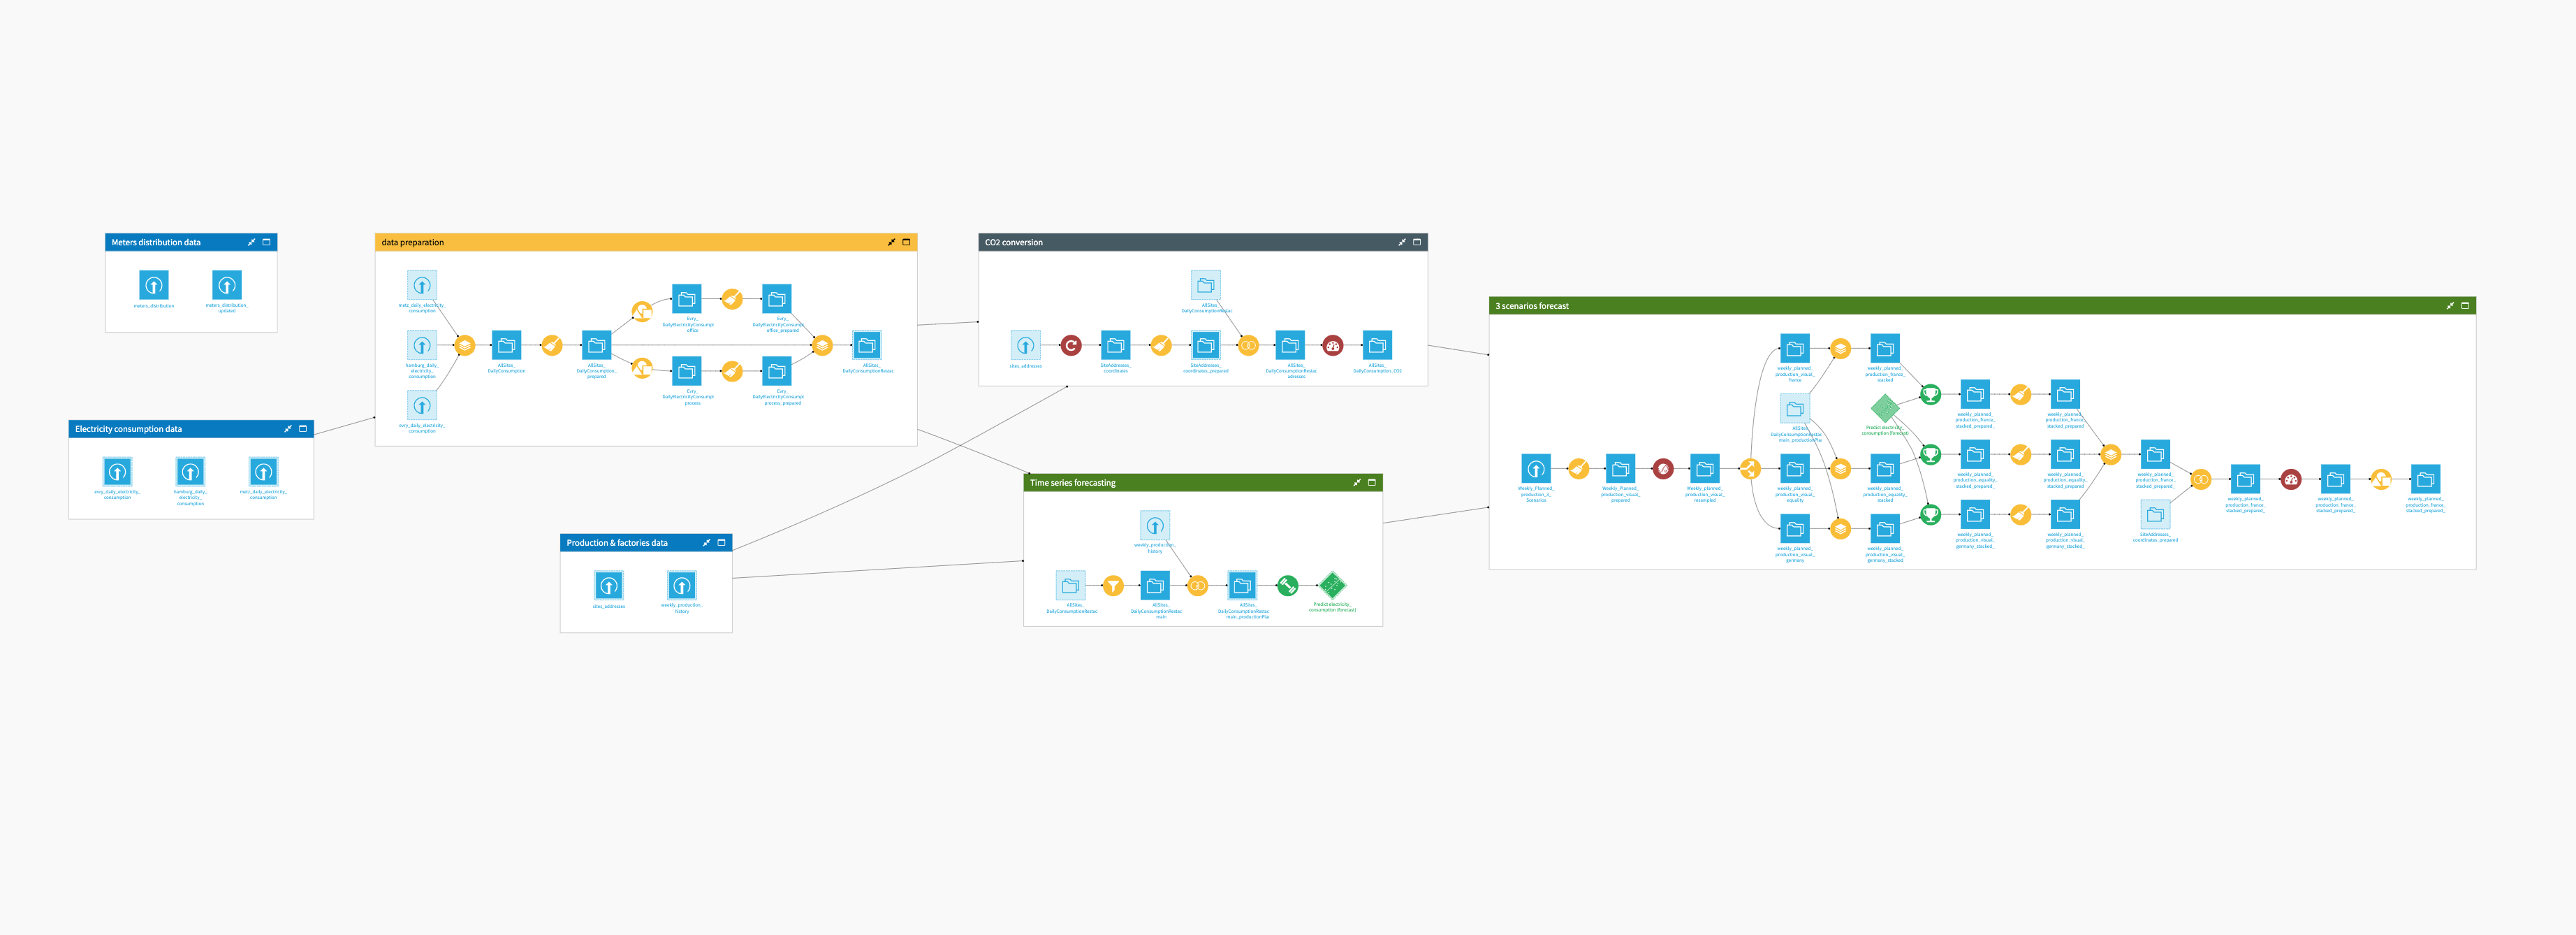
To assess and predict customer lifetime value, you need, at minimum, transactions history. If you choose to optionally include customer RFM segments and metadata, it enables enrichment of the model and results. You can connect all datasets you decide to include via the first section of the Project Setup. The Data input Flow zone will make available all datasets you choose to include.
Once you have connected your data, the Project Setup prompts you to choose a time frame to apply to your historical data to time scope how much history the model will consider for training. The Monthly Data preparation Flow zone aggregates the data at a monthly level. Accordingly, the values input to the second section of the app should be at a month unit level. This way, there is a common scale for customers within the transactions history.
The Window Features Computation Flow zone uses Window recipes to split the data between the lookback window, current window, and forward window of time. If you include RFM segment data, then you can run the Data Enrichment Flow zone to merge monthly data with RFM data per customer.
Enriching your data with RFM segments enables you to identify customers with similar lifetime value and apply specific marketing campaigns per group or study group behavior. Final steps are taken within data preparation to split the data between train/test/validation for the models.
Star customers - predicting customer lifetime value#
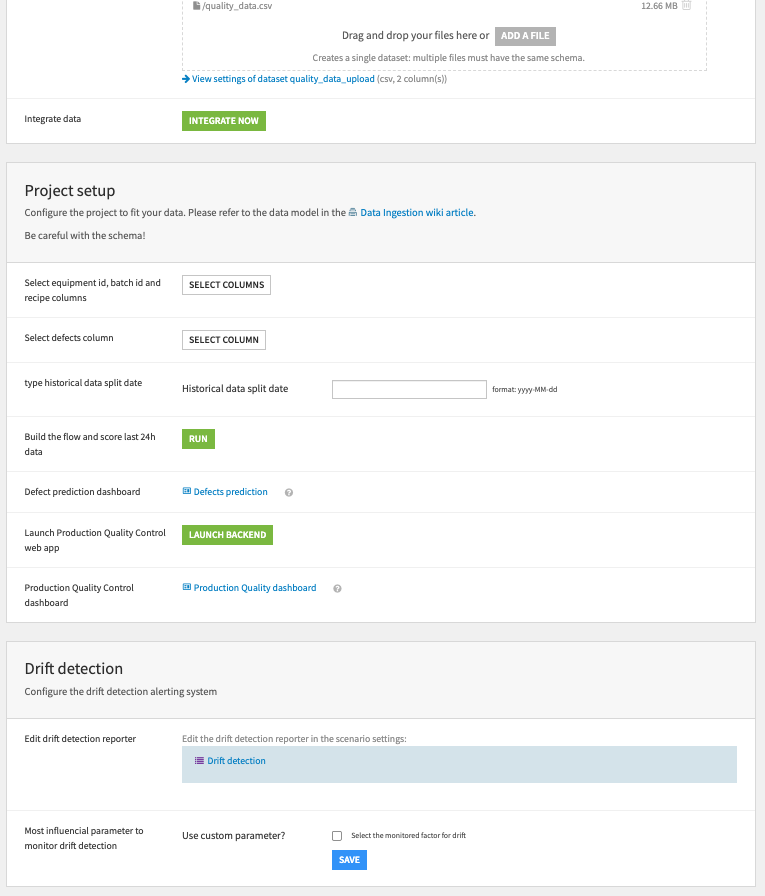
Before training models, you can interact with the Project Setup to specify the optimization strategy to use for training, clustering options, model parameters, train/test configuration, and computation of additional analytics. The values chosen for these parameters will impact model performance. Thus, the Project Setup provides a way to adjust, play with, and validate the performance of CLV forecasting models based on the selected parameters.
Through the Project Setup and provided pre-built dashboards, retail data scientists can test out modeling strategies until achieving an optimal result. Furthermore, as data will impact model performance over time, you can use this Solution to tune parameters over time to respond to changes in real data.
This Solution trains three models to support customer lifetime value forecasting. The first model is a lifetimes statistical model, which uses the customer’s age, recency, frequency, and average monetary value per transaction to build an estimation of the customer’s number of transactions with a given value. The predictions from this model are an important input for the classification and regression models you will train next. Additionally, the outputs of this model serve as a reference for performance evaluation later on.
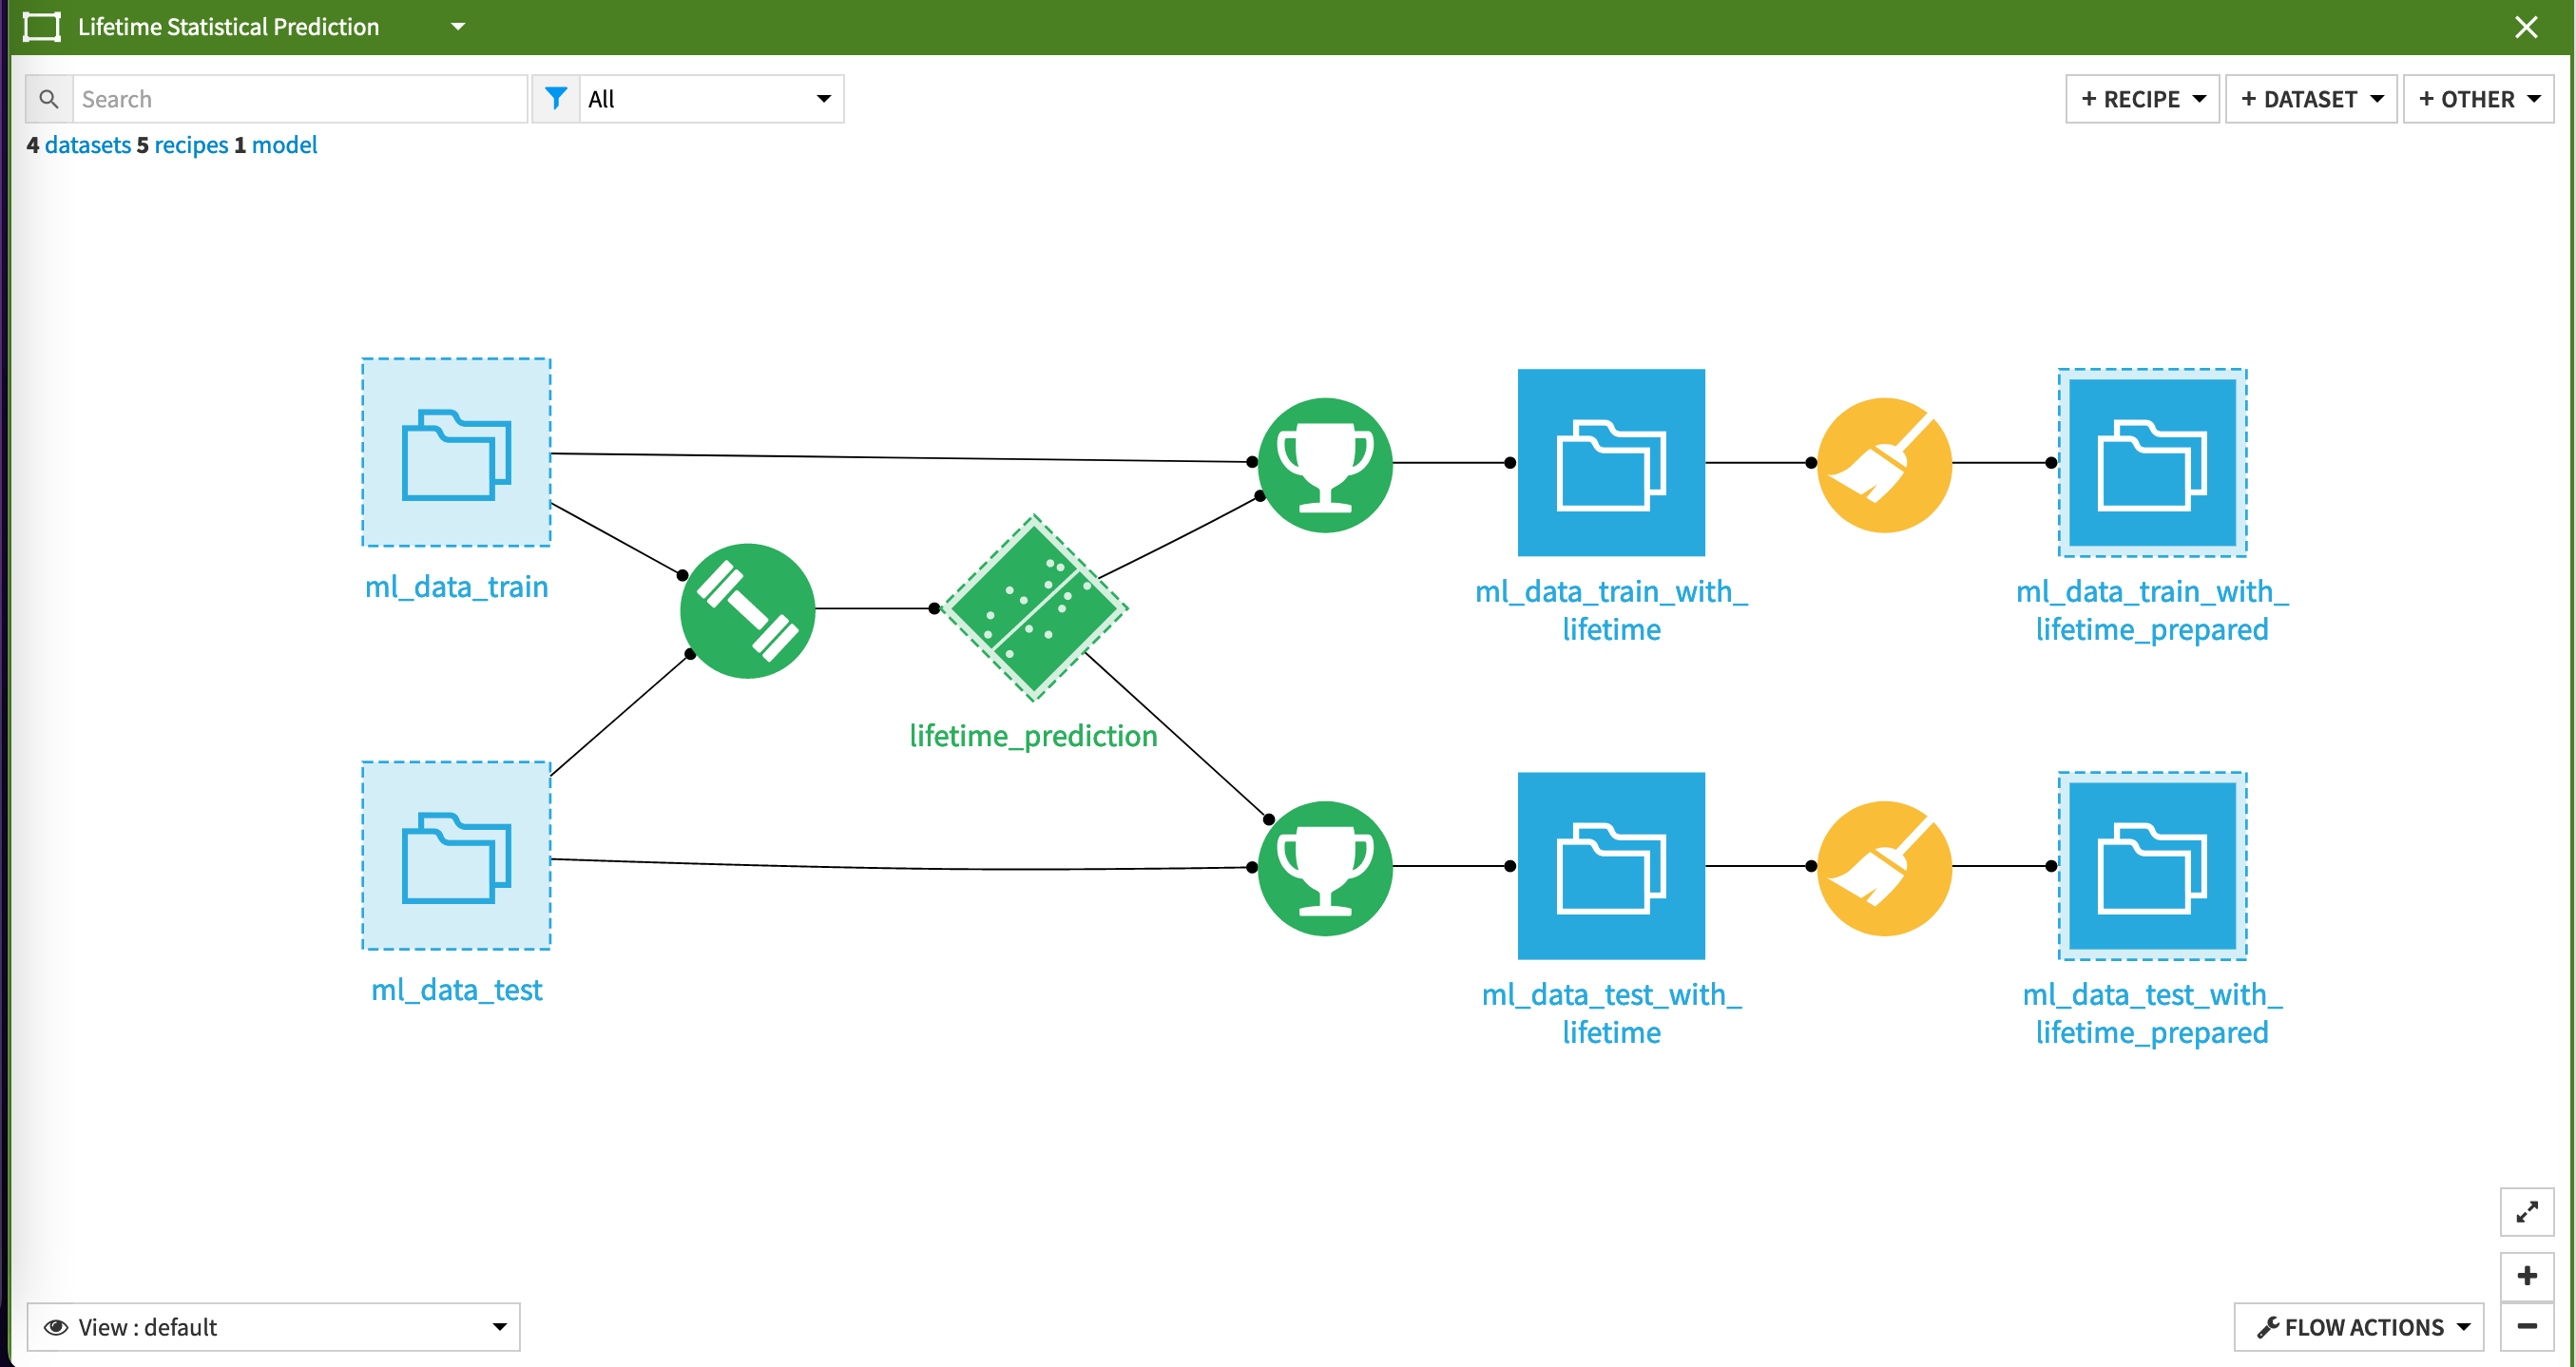
Having trained the lifetimes model, the Flow trains two different visual ML models to predict the future CLV. The best model will depend on your specific needs. The classification model predicts the future CLV cluster of a customer, whereas the regression model predicts the future CLV of a customer. In both cases, the predicted CLV groups are compared, but depending on your data and optimization strategy, the model results will differ. On the data used to build this Solution, we found that the classification algorithm gave better performance.
Despite having already trained three models, you’re not done yet in predicting customer lifetime value! A final step in the modeling applies all three models, as well as CLV group clustering, to the inference data (the last full month of available data). Doing this enables you to get the full scope for the future CLV groups with active customers.
Assessing model performance#
An important step in any predictive analytics project is the assessment of model performance. The Flow applies several recipes to the outputs of the model to transform the data into visualization-ready datasets via the Dashboard Management Flow zone.
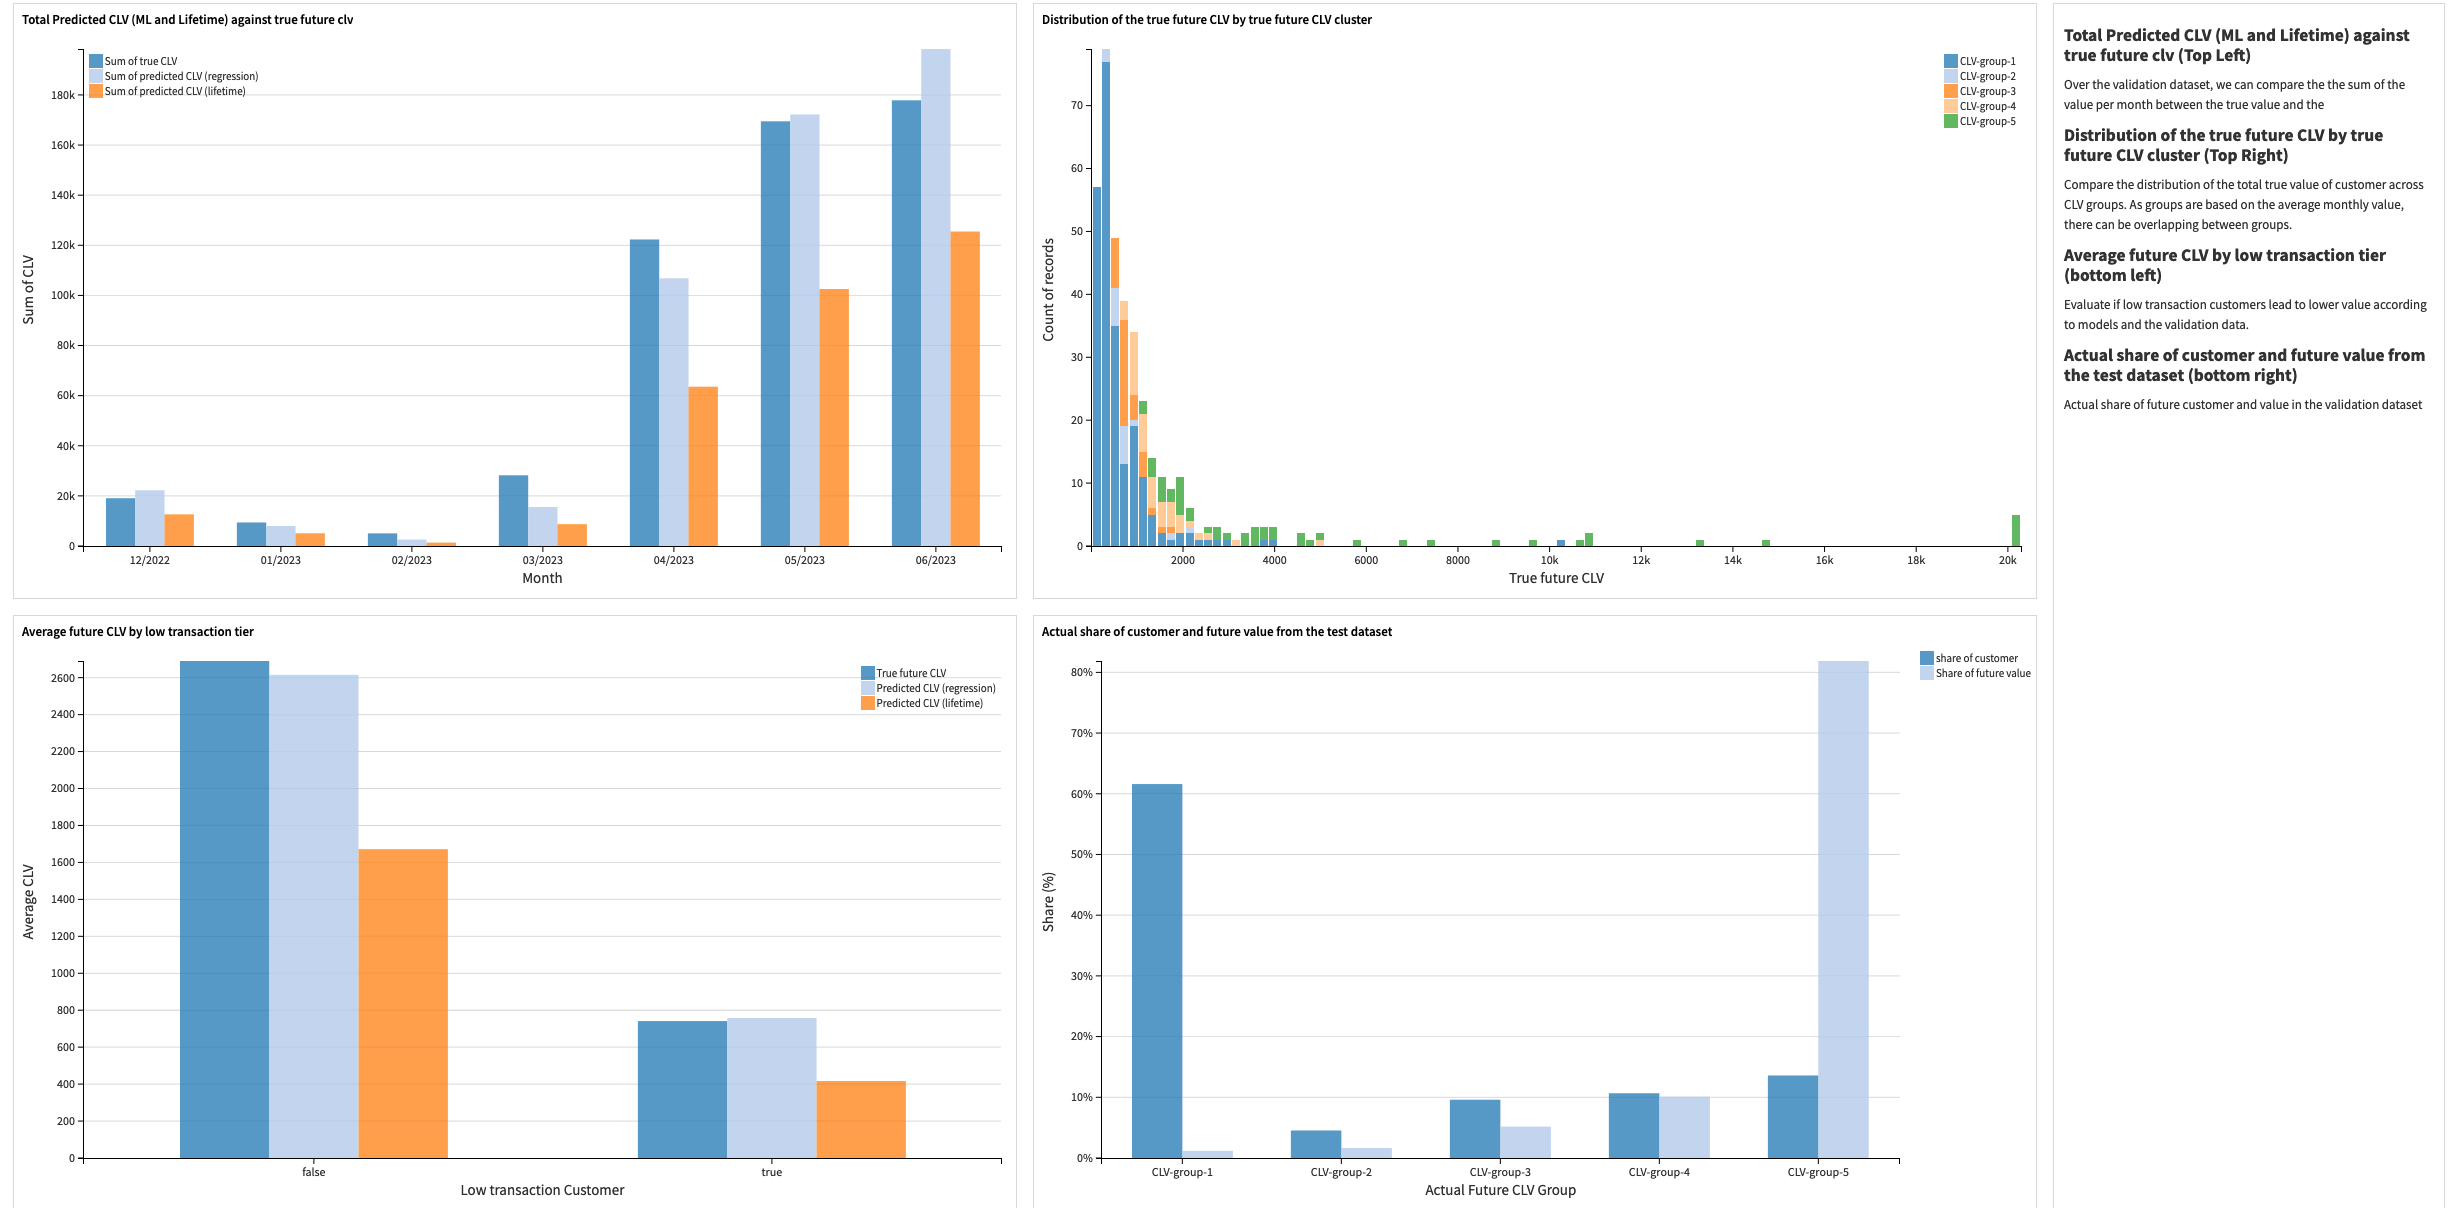
Two dashboards visualize the results of this Flow zone. Data scientists should use the first, Data Science Validation Dashboard, to compare the performances between all models and cross-check for unexpected behavior. Additionally, this dashboard provides the ability to compare actual CLV with the prediction to identify any effects of time or low transaction customers on the model.
Finally, you can compare predicted distributions between models and evaluate the errors in the predictions of the CLV groups using charts on this pre-built dashboard. In addition to this dashboard, it’s recommend to take advantage of Dataiku’s built-in visual ML capabilities, such as subpopulation analysis, partial dependence plots, and more.
Explore predictions and customer behavior#
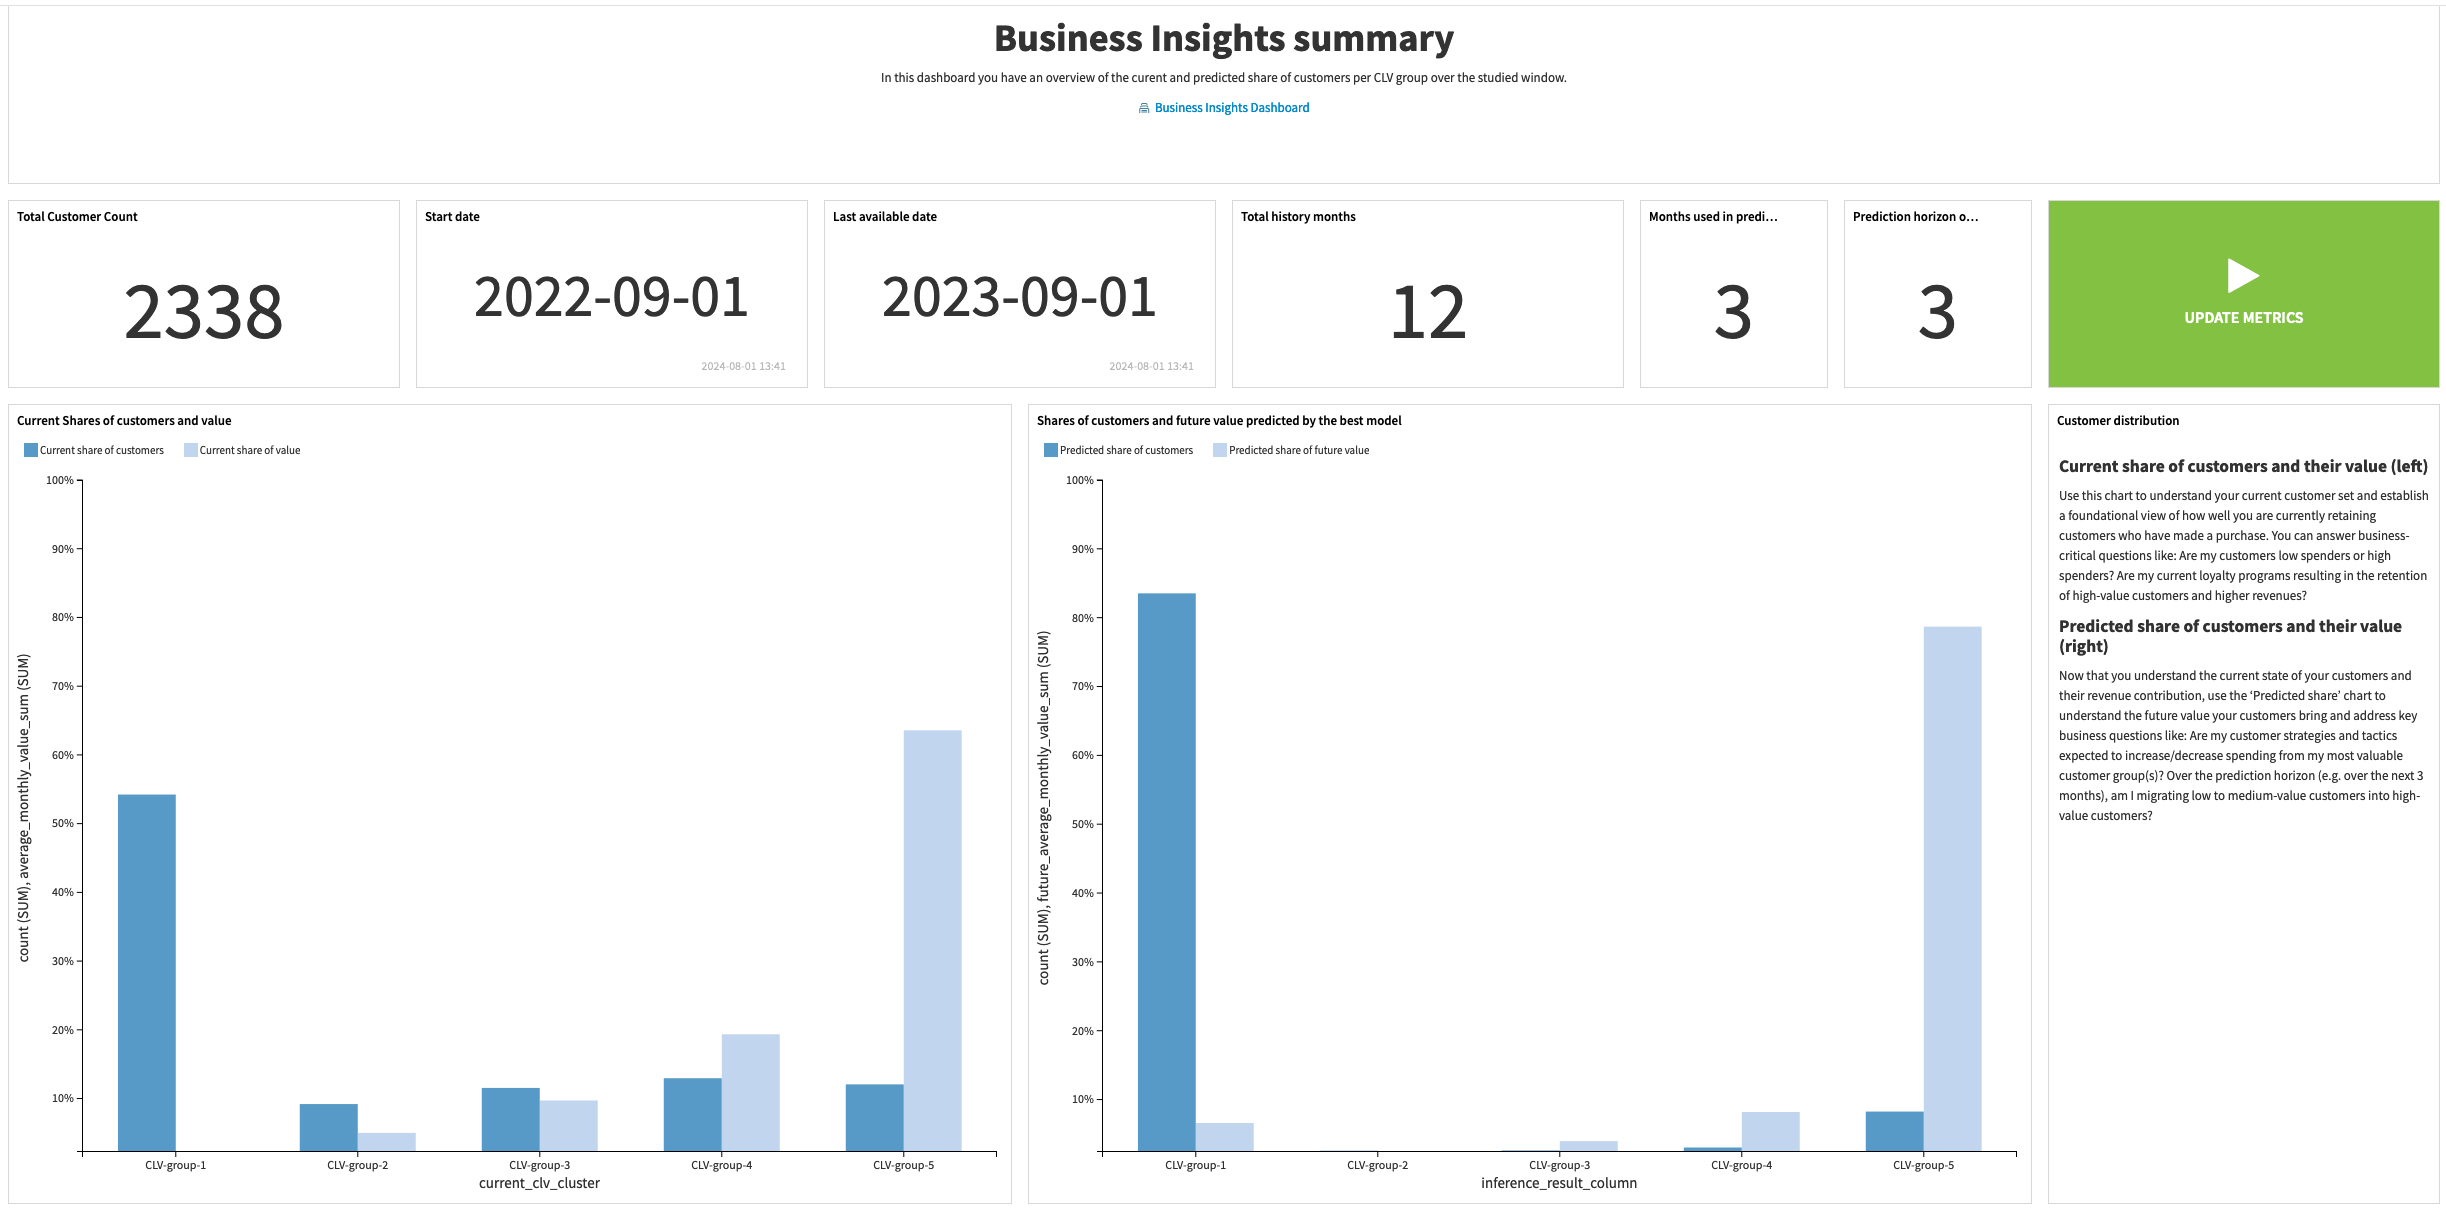
Once you’re satisfied with the accuracy and performance of the models, you can use the Business Insights Dashboard to explore the final outputs of the Solution, make business decisions based on what you see, and share these visualizations with the wider organization for smarter decision making.
This dashboard provides several visualizations to summarize the transactions history and customer base, contextualize the chosen time scope, and provide an average monthly value per customer in each CLV group.
Furthermore, you can use this dashboard to compare the distribution of customers and values across groups and explore the most common transitions between CLV groups (that is, current to predicted group). You can use this to evaluate possible factors impacting changes in customer lifetime value. This can help design more impactful marketing and customer outreach campaigns.
A short note on automation#
It’s possible to automate the Flow of this Solution based on new data, a specific time, etc. via the Project Setup. You can tune all trigger parameters in the Scenarios menu of the project.
Additionally, you can create reporters to send messages to Teams, Slack, email, etc. to keep your full organization informed. You can also run these scenarios ad-hoc as needed. You can find full details on the scenarios and project automation in the wiki.
Reproducing these processes with minimal effort for your data#
This project equips customer success teams to understand how they can use Dataiku to assess the value of their existing customer base and make smarter decisions on customer outreach, marketing campaigns, and much more.
By creating a singular Solution that can benefit and influence the decisions of a variety of teams in a single retail organization, you can design smarter and more holistic strategies to maximize sales, while keeping customer outreach and acquisition costs down.
This documentation has provided several suggestions on how to derive value from this Solution. Ultimately however, the “best” approach will depend on your specific needs and data. If you’re interested in adapting this project to the specific goals and needs of your organization, Dataiku offers roll-out and customization services on demand.