
Solution | Parameters Analyzer#
Overview#
Business case#
For the average manufacturer, the cost of poor quality and downtime equates to more than 20% of total sales. Thus, it’s critical for manufacturing operations teams to identify how best to run their equipment for the desired outcome and equip their operators with the right information at the right time. This means understanding optimal startup settings and ideal equipment operating parameters with optimal product quality as a continuous objective.
Often, these insights are elusive. Machines have a plethora of settings, and in a high-volume production line, several daily changeovers. Optimal machine settings are highly specific to each individual piece of equipment, and also significantly influenced by other external factors such as the quality of input materials. Additionally, paper checklists and disparate Excel worksheets still remain the norm despite investments made in building strong data collection systems.
With the Dataiku Parameters Analyzer Solution, operations teams can adopt a repeatable, scalable, and automated process for understanding critical control parameters and their ranges. Process engineers and quality engineers benefit from an intuitive analysis tool using machine learning and AI to mine data, understand parameter adjustment, and make documented decisions to enhance data-driven work in manufacturing operations. By understanding equipment performance and better defining ideal control and startup settings, teams make a key step toward putting data at work for yield improvement and general quality optimization.
Installation#
This Solution is currently in a private preview phase. If you’re interested in accessing this Solution, please reach out to your Dataiku account manager or use the general Contact Us form.
Technical requirements#
To use this Solution, you must meet the following requirements:
Have access to a Dataiku 13.2+* instance.
Data requirements#
In this Solution, two data models can be used:
Data model |
Process: |
|---|---|
Two separate datasets |
Process parameters and events information datasets. |
One unified dataset |
Process an events-aggregated dataset. It’s necessary to have data aggregated to the events—not time series data. |
To ensure dataset contents (columns and values) don’t cause unexpected behavior, version 2.1.0 has introduced a new data validation step.
Two separate datasets#
This Solution requires two input datasets:
Process Parameters Dataset: Containing instances of parameters on specific events in wide format:
event_id(string): Event’s unique identifierequipment_id(string): (Optional) Equipment’s unique identifierspec_id(string): Parameter set unique identifierprocess_parameter_1toprocess_parameter_n(float): Parameters valuesdate(date): Date of the parameter instantiation
Note
The schema accepts as many parameter sets and process parameters as needed.
Events Information Dataset: Containing event information:
event_id(string): Event’s unique identifierequipment_id(string): (Optional) Equipment’s unique IDstart_date(date): (Optional) Start date of the eventend_date(date): (Optional) End date of the eventoutcome(string / date / Boolean / float): Any process outcome measurement to analyze
Note
The schema accepts as many outcomes as needed.
One unified dataset#
The Solution can also work with a dataset aggregated to the process events, such as product or batch. Here, only one dataset is expected, referred to as the Product Database.
Product Database Dataset
This dataset includes aggregated process information at the event level, along with outcome measurements, such as quality measurements.
The schema is flexible, facilitating a variety of specific use cases.
However, it has the following mandatory requirements:
A product identifier
At least one date related to the manufacturing process
At least one process measure or parameter
The general schema of the database looks like this:
product_identifier(string): Unique identifier of a productidentifier_1toidentifier_n(string): Various identifiers related to the product or processprocess_parameter_1toprocess_parameter_n(varies): Several process parametersprocess_outcome_1toprocess_outcome_n(decimal, integer, Boolean, etc.): Several process outcomesdate_1todate_n(date): Several dates related to the manufacturing process
Here, identifiers are unique values that allow pinpointing a specific entity, such as a product, process, or machine.
Process Parameters: Values that can be adjusted during the manufacturing process and may impact the end quality of the product.
Process Measures: Event-aggregated properties recorded from the product or process, such as weight, length, or temperature.
Dates: Timestamps related to the manufacturing process, such as the start date of the process, end date, or inspection date.
Note
You can add as many columns as necessary for identifiers, process parameters, process measures, and dates. However, dates aren’t analyzed as part of this Solution.
App performance recommendations#
Three main dimensions affect performance:
how well your data is prepared
dataset characteristics
storage/processing choice
Regarding the latter:
Prepare your data correctly. Follow recommendations for cleaning and structuring your dataset.
Downsample your dataset if it exceeds more than a million rows (smaller is faster). Split it into separate datasets if it exceeds 50 columns (slimmer is faster).
Only use supported storage types. Note that SQL storage is significantly more performant for data of all supported sizes (tested with PostgreSQL and AWS RDS). If possible, prepare your data into a finalized SQL dataset to use with the app.
Data & storage#
The app requires at least one parsed date in the standard ISO 8601 format (yyyy-MM-ddTHH:mm:ss.SSSZ), as done by the parse date processor.
The app doesn’t infer data types. Instead, they’re taken from the dataset schema. Ensure the following:
Numerical variables are stored as numerical types.
Categorical variables are stored as strings.
Example of a numerical variable incorrectly stored as a string#
The ![]() logo next to the variable name Temperature shows that it’s recognized as a categorical variable. Additionally:
logo next to the variable name Temperature shows that it’s recognized as a categorical variable. Additionally:
The chart isn’t ordered properly.
A list is displayed to select modalities instead of a slider.
Example of a numerical variable correctly stored as a numerical type#
When the variable Temperature is stored correctly as a numerical type (for example, Double), it’s displayed correctly. Notice the ![]() logo next to the variable name, indicating that it’s recognized as numerical.
logo next to the variable name, indicating that it’s recognized as numerical.
Datasets and performance benchmark analysis#
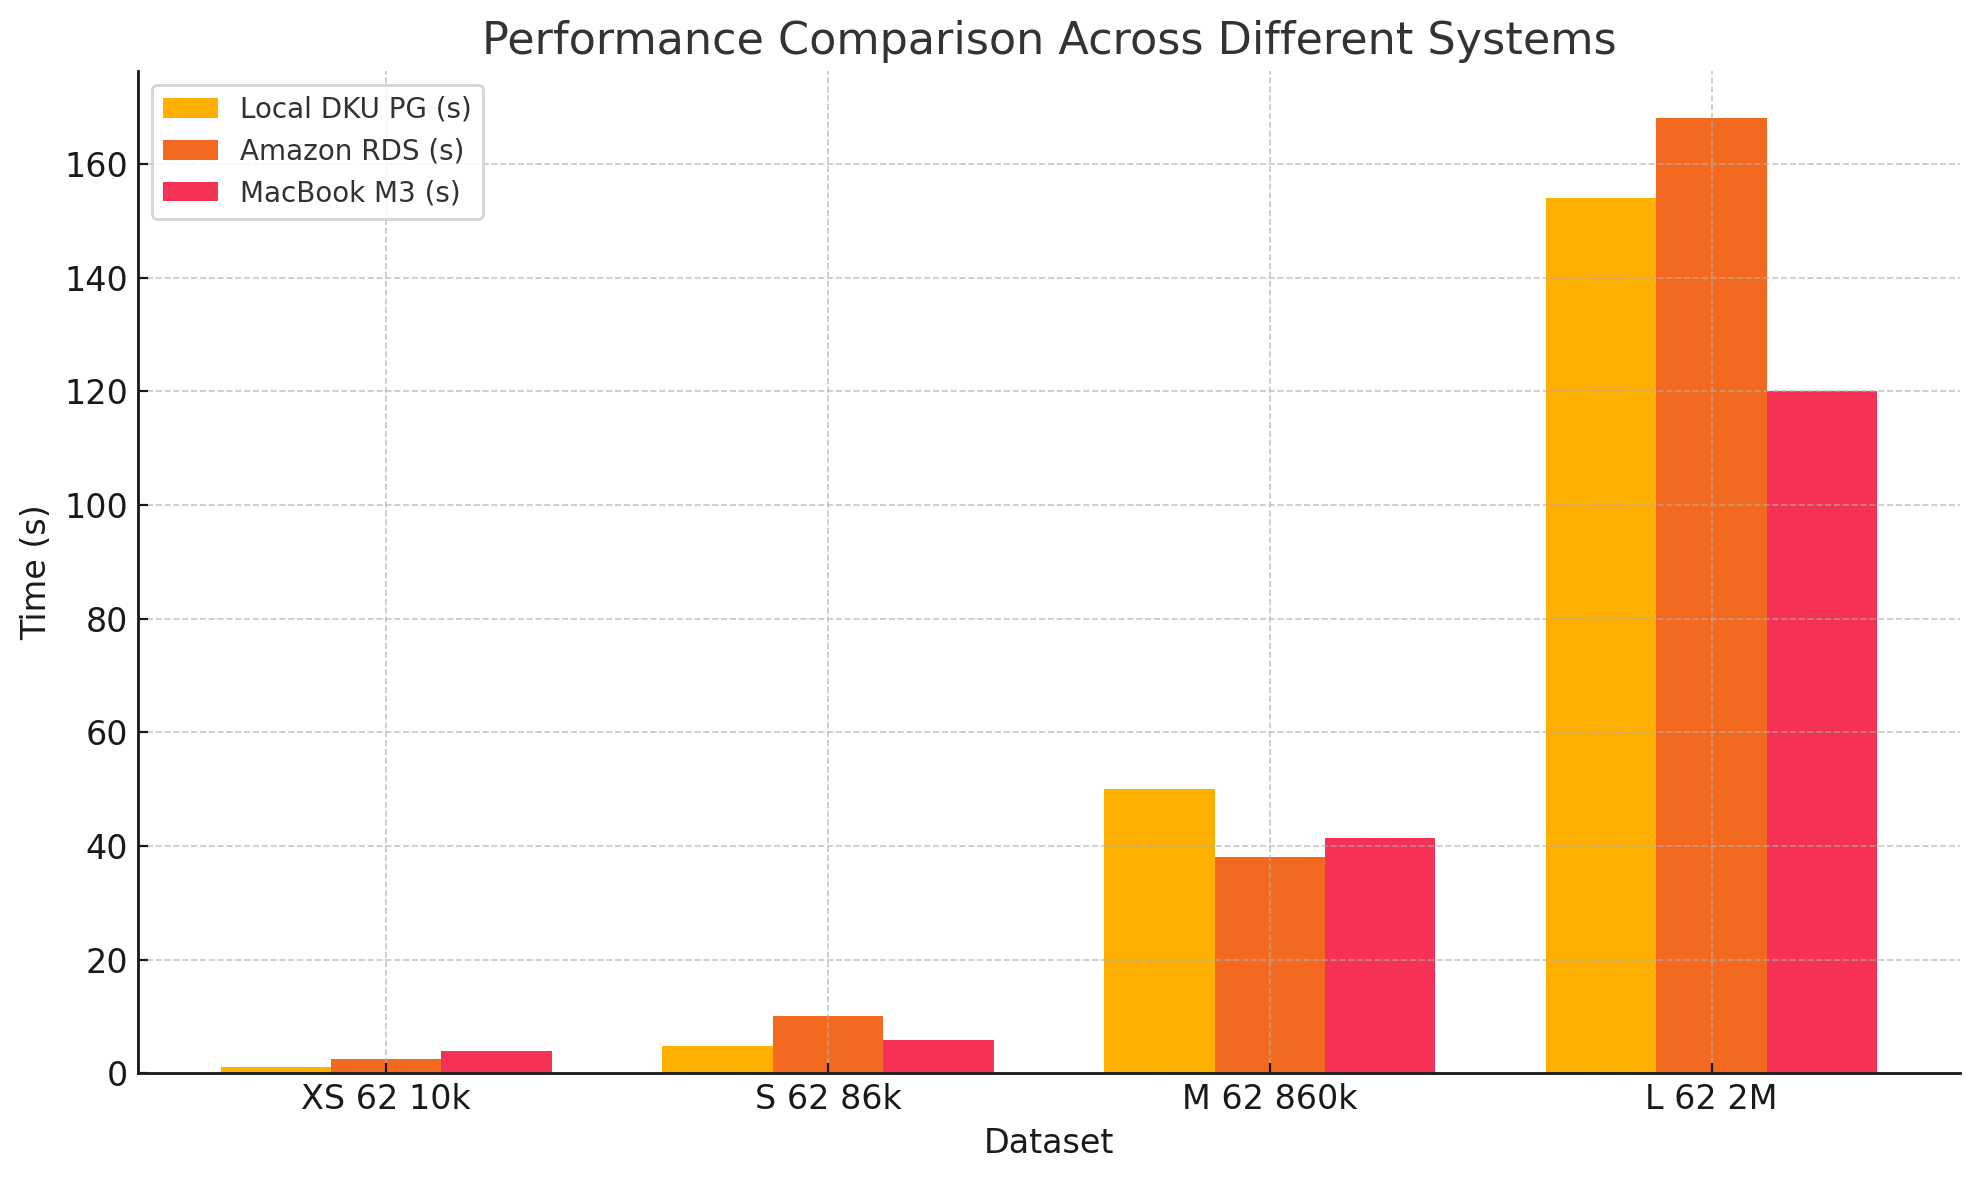
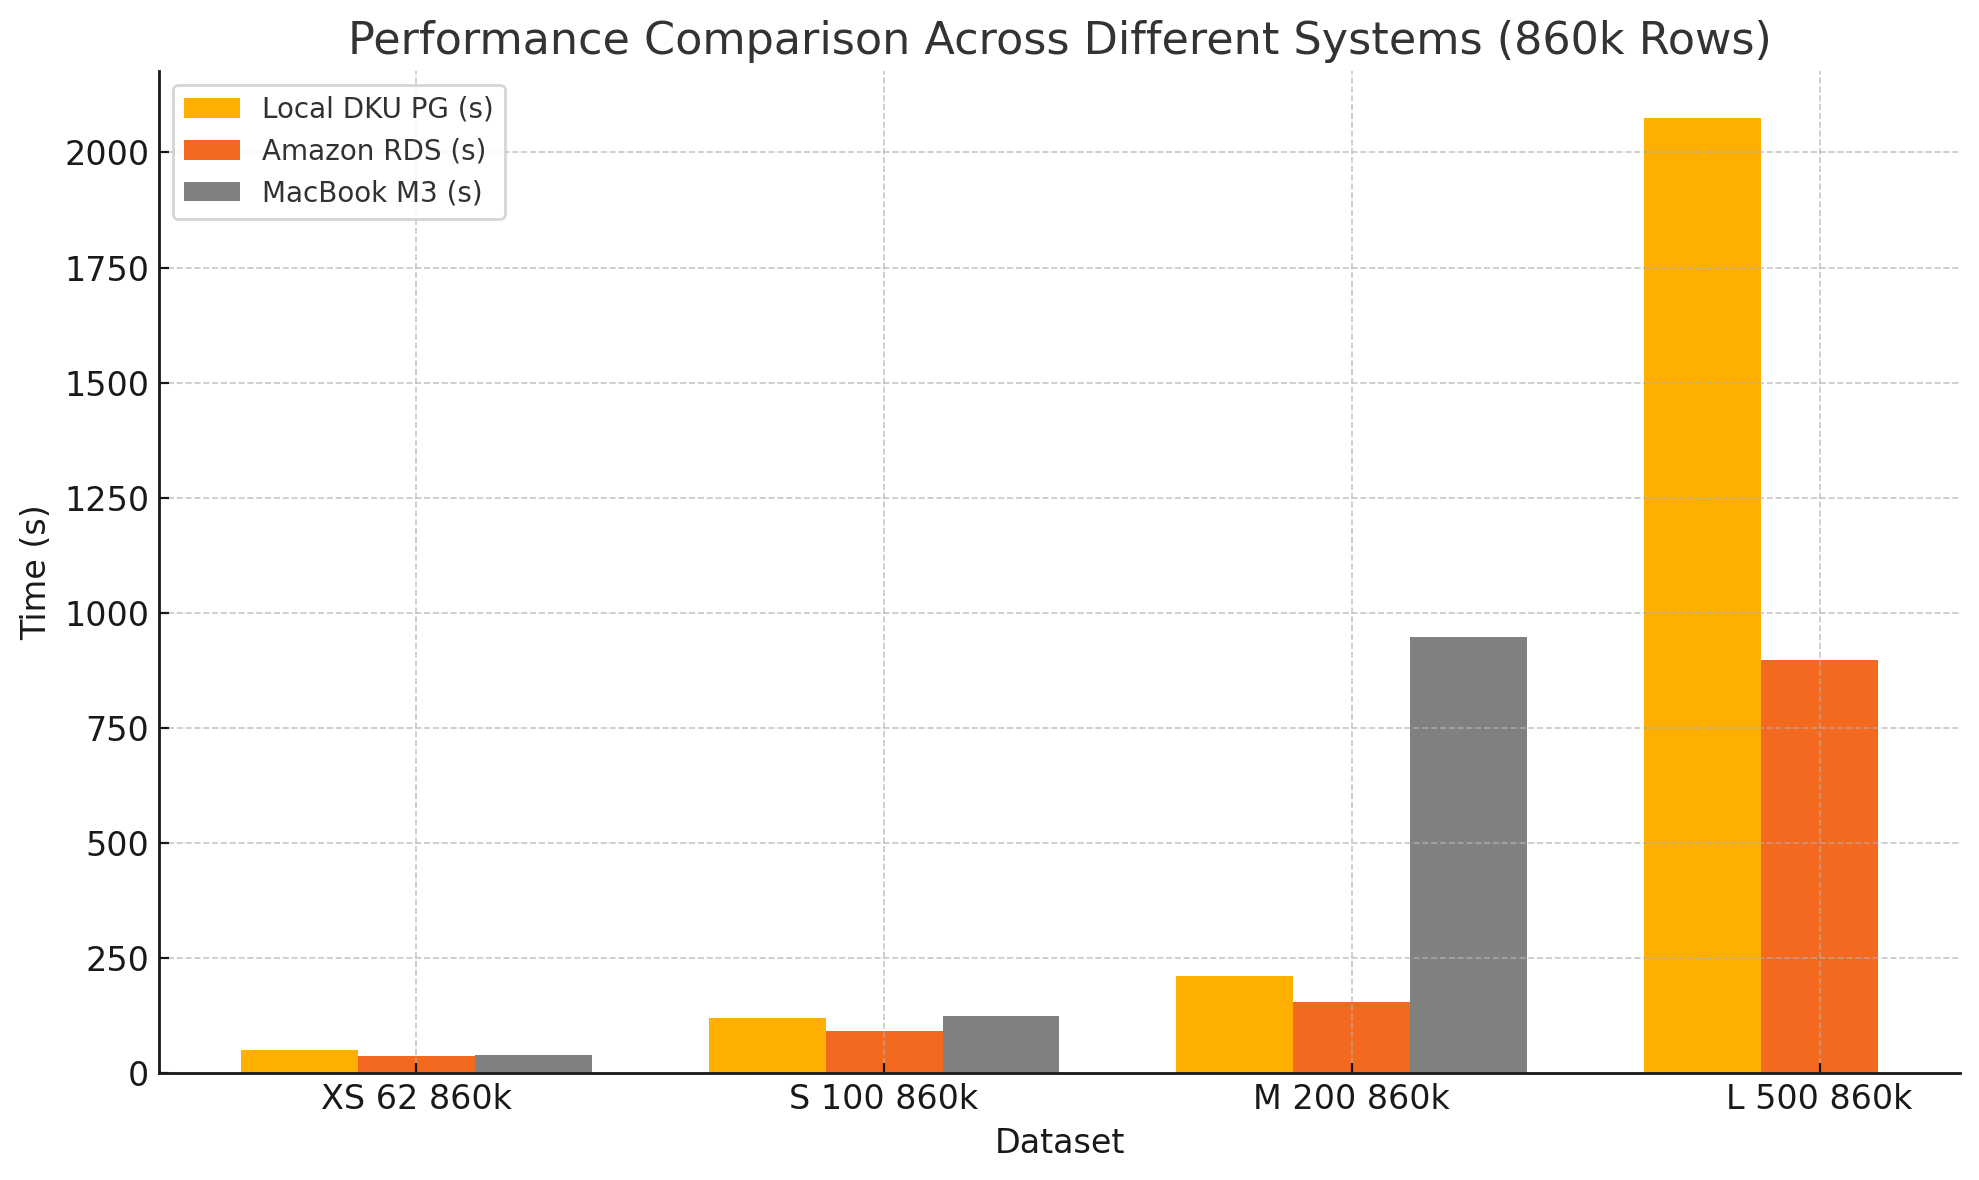
To assess the performance of the Solution, a series of tests were conducted on various data sizes and storage types.
The following tables illustrate performance benchmarks for various datasets across three infrastructures with varying dataset characteristics.
Storage and processing#
Local DKU PG |
An AWS m5.xlarge machine running PostgreSQL. |
Amazon RDS |
Amazon Relational Database Service (RDS) for PostgreSQL. |
MacBook M3 |
An Apple MacBook Pro (M3) computer. |
Dataset characteristics#
Each dataset is named using the format <size>_<columns>_<rows>, where:
Size |
|
Columns |
Number of columns. |
Rows |
Number of rows. |
Note
For example, M_62_860k represents a dataset with 62 columns and 860,000 rows.
Datasets with varied rows (62 columns)#
Dataset |
Columns |
Rows |
Local DKU PG (s) |
Amazon RDS (s) |
MacBook M3 (s) |
|---|---|---|---|---|---|
XS 62 10k |
62 |
10,000 |
1.1 |
2.5 |
3.9 |
S 62 86k |
62 |
86,000 |
4.8 |
10 |
5.8 |
M 62 860k |
62 |
860,000 |
50 |
38 |
41.3 |
L 62 2M |
62 |
2,000,000 |
154 |
168 |
120 |
Datasets with varied columns (860k rows)#
Dataset |
Columns |
Rows |
Local DKU PG (s) |
Amazon RDS (s) |
MacBook M3 (s) |
|---|---|---|---|---|---|
XS 62 860k |
62 |
860,000 |
50 |
38 |
39 |
S 100 860k |
100 |
860,000 |
120 |
91 |
124 |
M 200 860k |
200 |
860,000 |
210 |
155 |
948 |
L 500 860k |
500 |
860,000 |
2074 |
897 |
N/A |
Important
All times are in seconds.
N/A indicates scenarios where the process couldn’t complete successfully, likely due to memory or compute constraints.
Increasing the number of columns significantly impacts performance more than increasing the number of rows.
Numerical data tends to scale better than categorical data.
Workflow overview#
The Flow is straightforward and is composed of only one zone, presented here in the case of working with one unified dataset.
Caution
This Flow is automatically configured by the scenario, so it’s important not to modify it under any circumstances.
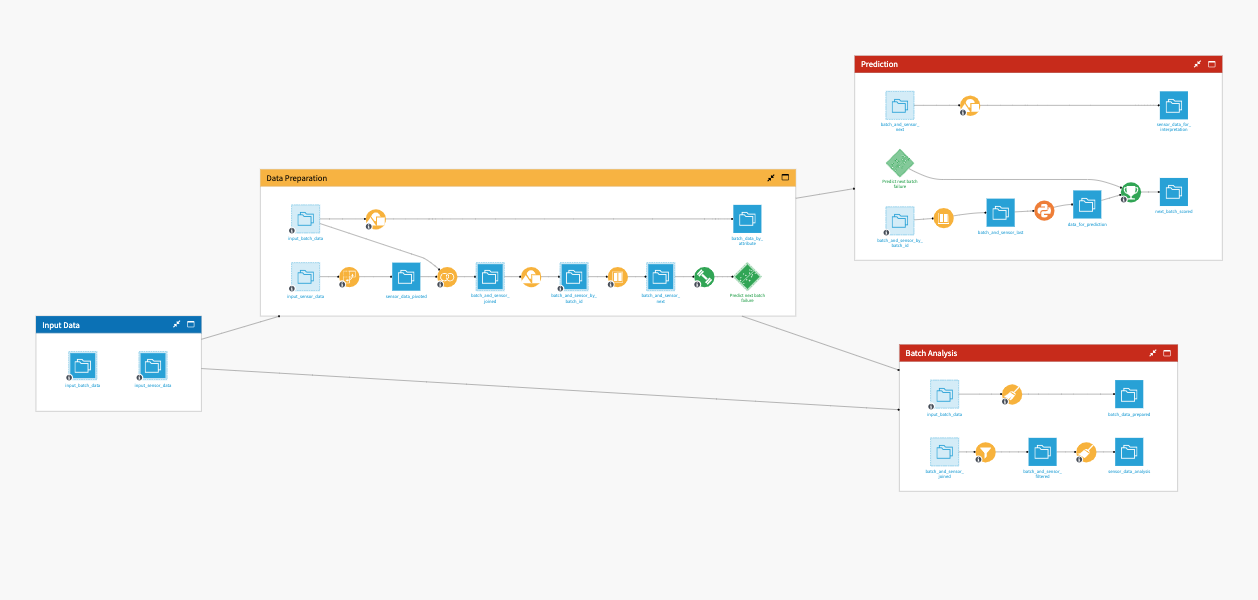
The project has the following high-level steps:
Connect your data as input, and select your analysis parameters via the Dataiku app.
Run your analysis in the web application.
Get the saved rules from the last tab of the web application.
Walkthrough#
To work with this Solution, don’t use the project itself. Instead, use the Dataiku app that comes with it.
To begin, you’ll need your own instance of the Dataiku app associated with this Solution.
From the waffle (
 ) menu of the Design node’s top navigation bar, select Dataiku Apps.
Search for and select the application with the name of this Solution.
Then, click Create App Instance.
This will create a new instance of the parent project. It will help you connect your data and launch the web application. You can create as many instances as you need (for example, if you want to apply this Solution to other datasets).
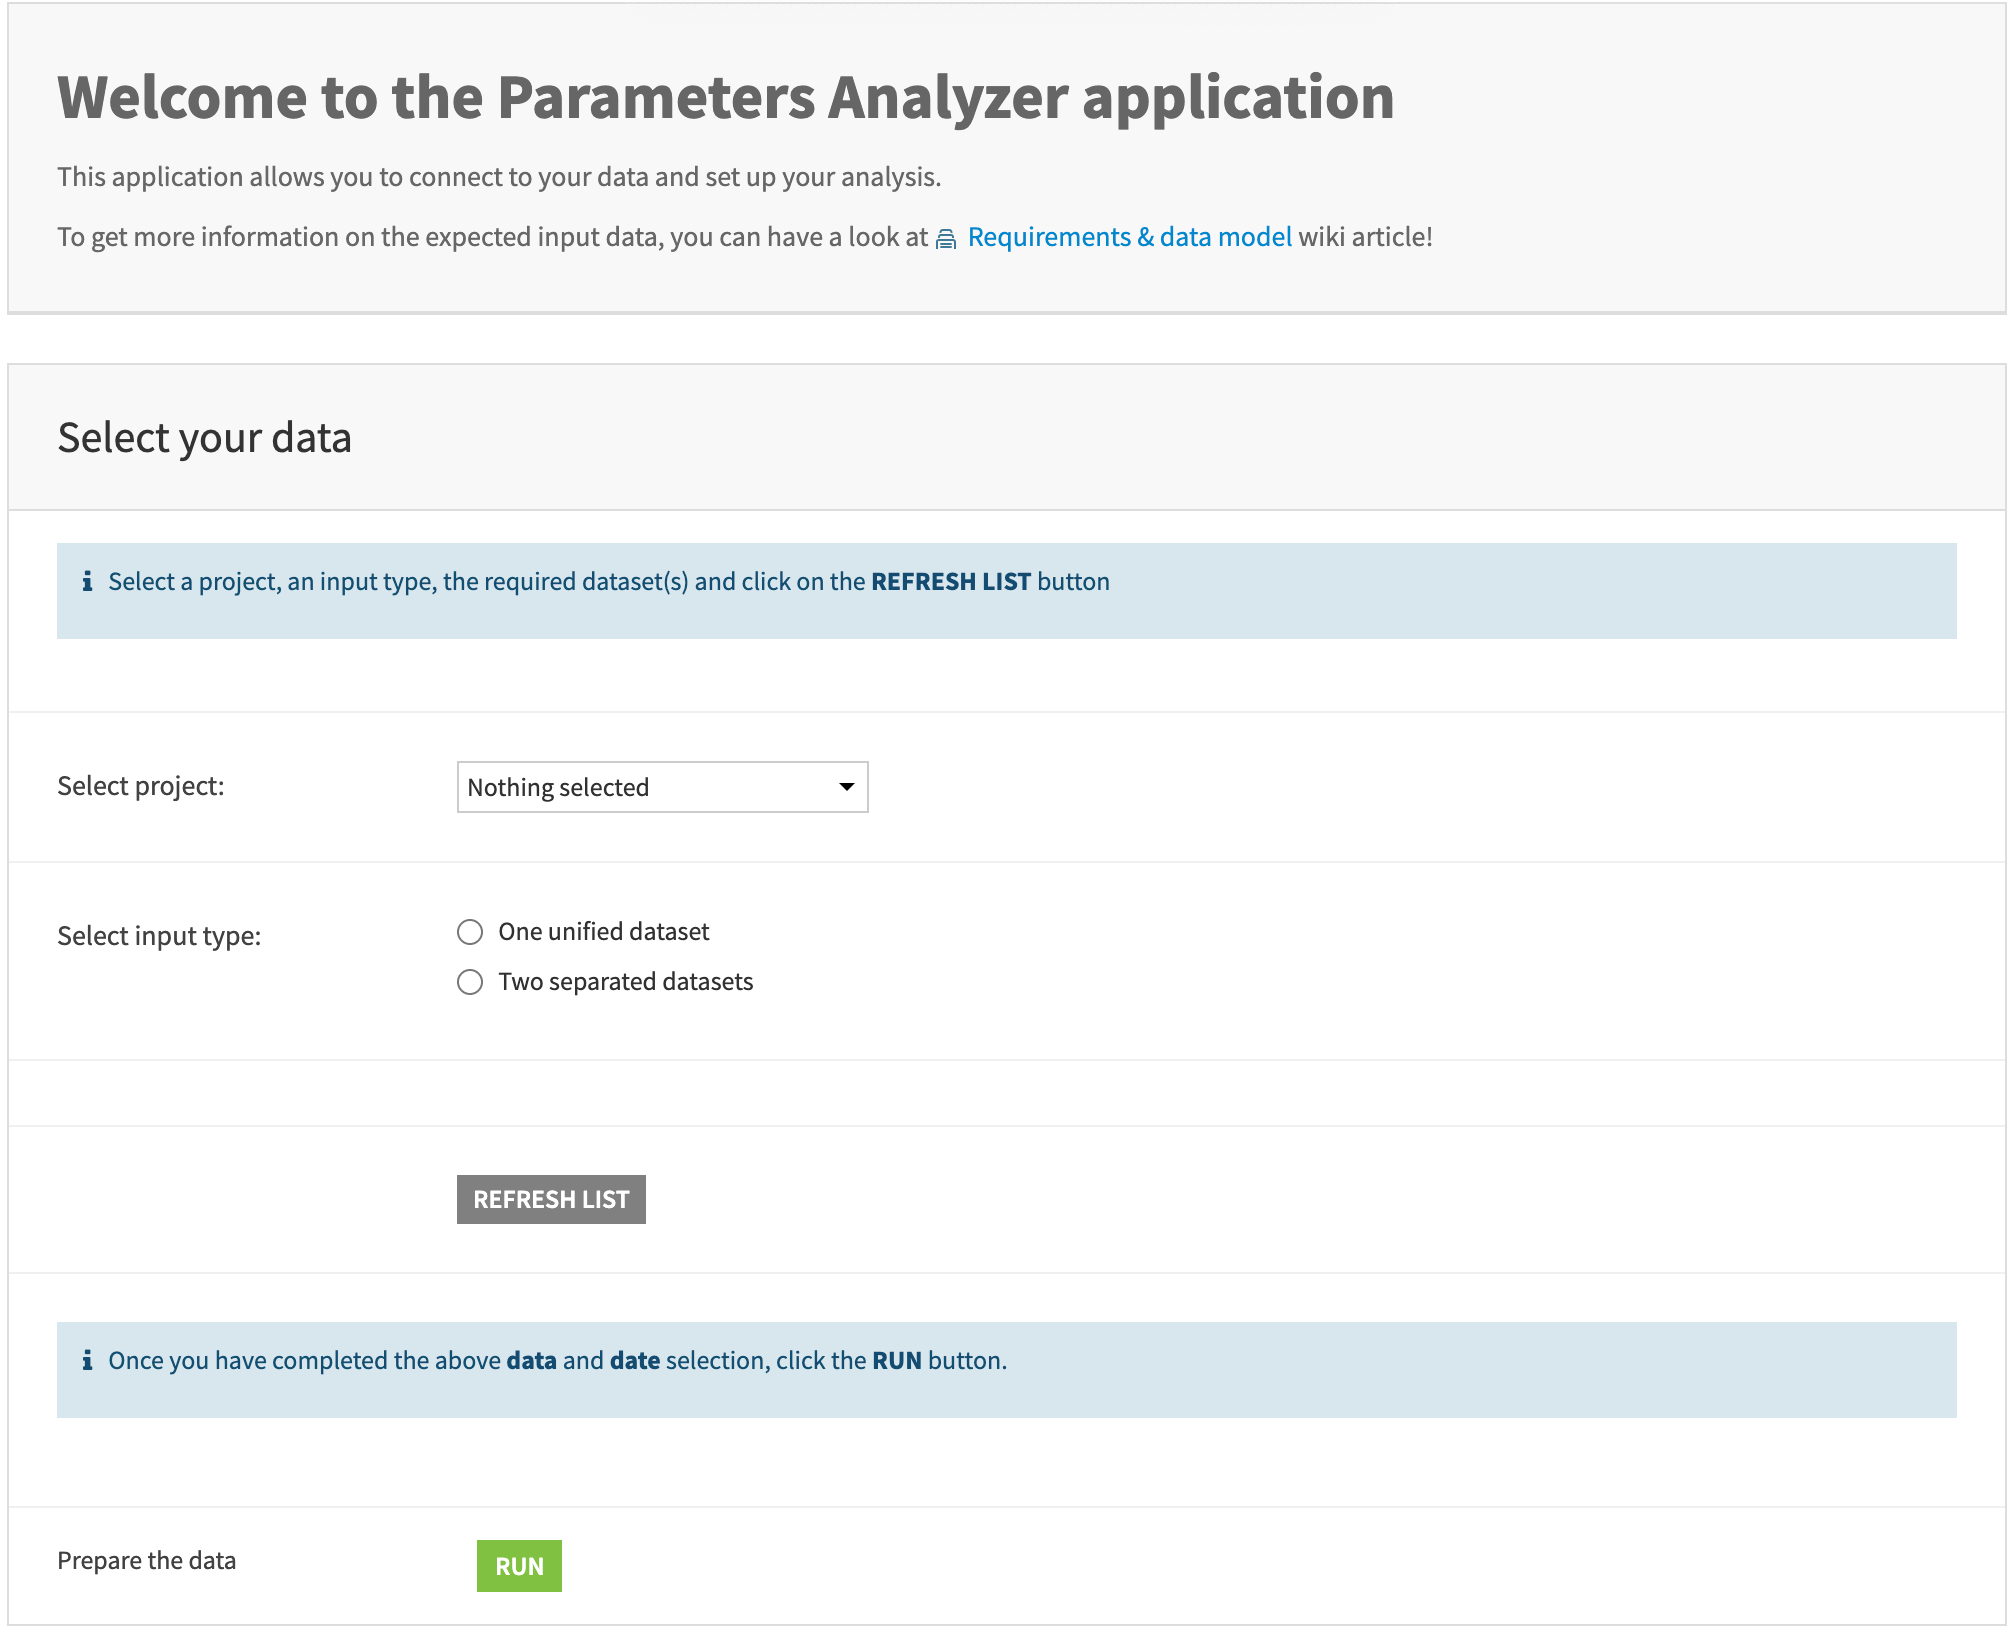
Select your data#
Follow these steps for selecting your data.
Step |
Details |
|---|---|
|
Select your data preparation project name from the list. You need to have admin rights to this project to use the app. |
|
Select the input type you want, according to your data model. Depending on the choice, you’ll have one or two dataset selectors appear. These selectors list the datasets of the project. |
|
As specified in the data model section, your datasets must include at least one parsed date. Once you’ve selected the project and datasets, click the Refresh List button to retrieve the list of parsed dates in the datasets. Since this step is mandatory, ensure your data preparation project is adjusted accordingly. |
|
Once you have completed the previous steps, click on the Run button to launch the scenario that sets up the app. |
|
Wait for the scenario to complete before clicking Open Parameters Analyzer. |
Once the Dataiku app is configured, the web application should be easy to use. You can start by launching a new analysis or exploring saved studies and work on a copy if you already have saved studies.
Launch a new analysis#
Target definition#
In the period section, select the range of the reference date selected in the Dataiku app. The entire range of this date is automatically selected.
Then, select a target variable (the outcome you want to analyze) and click Apply.
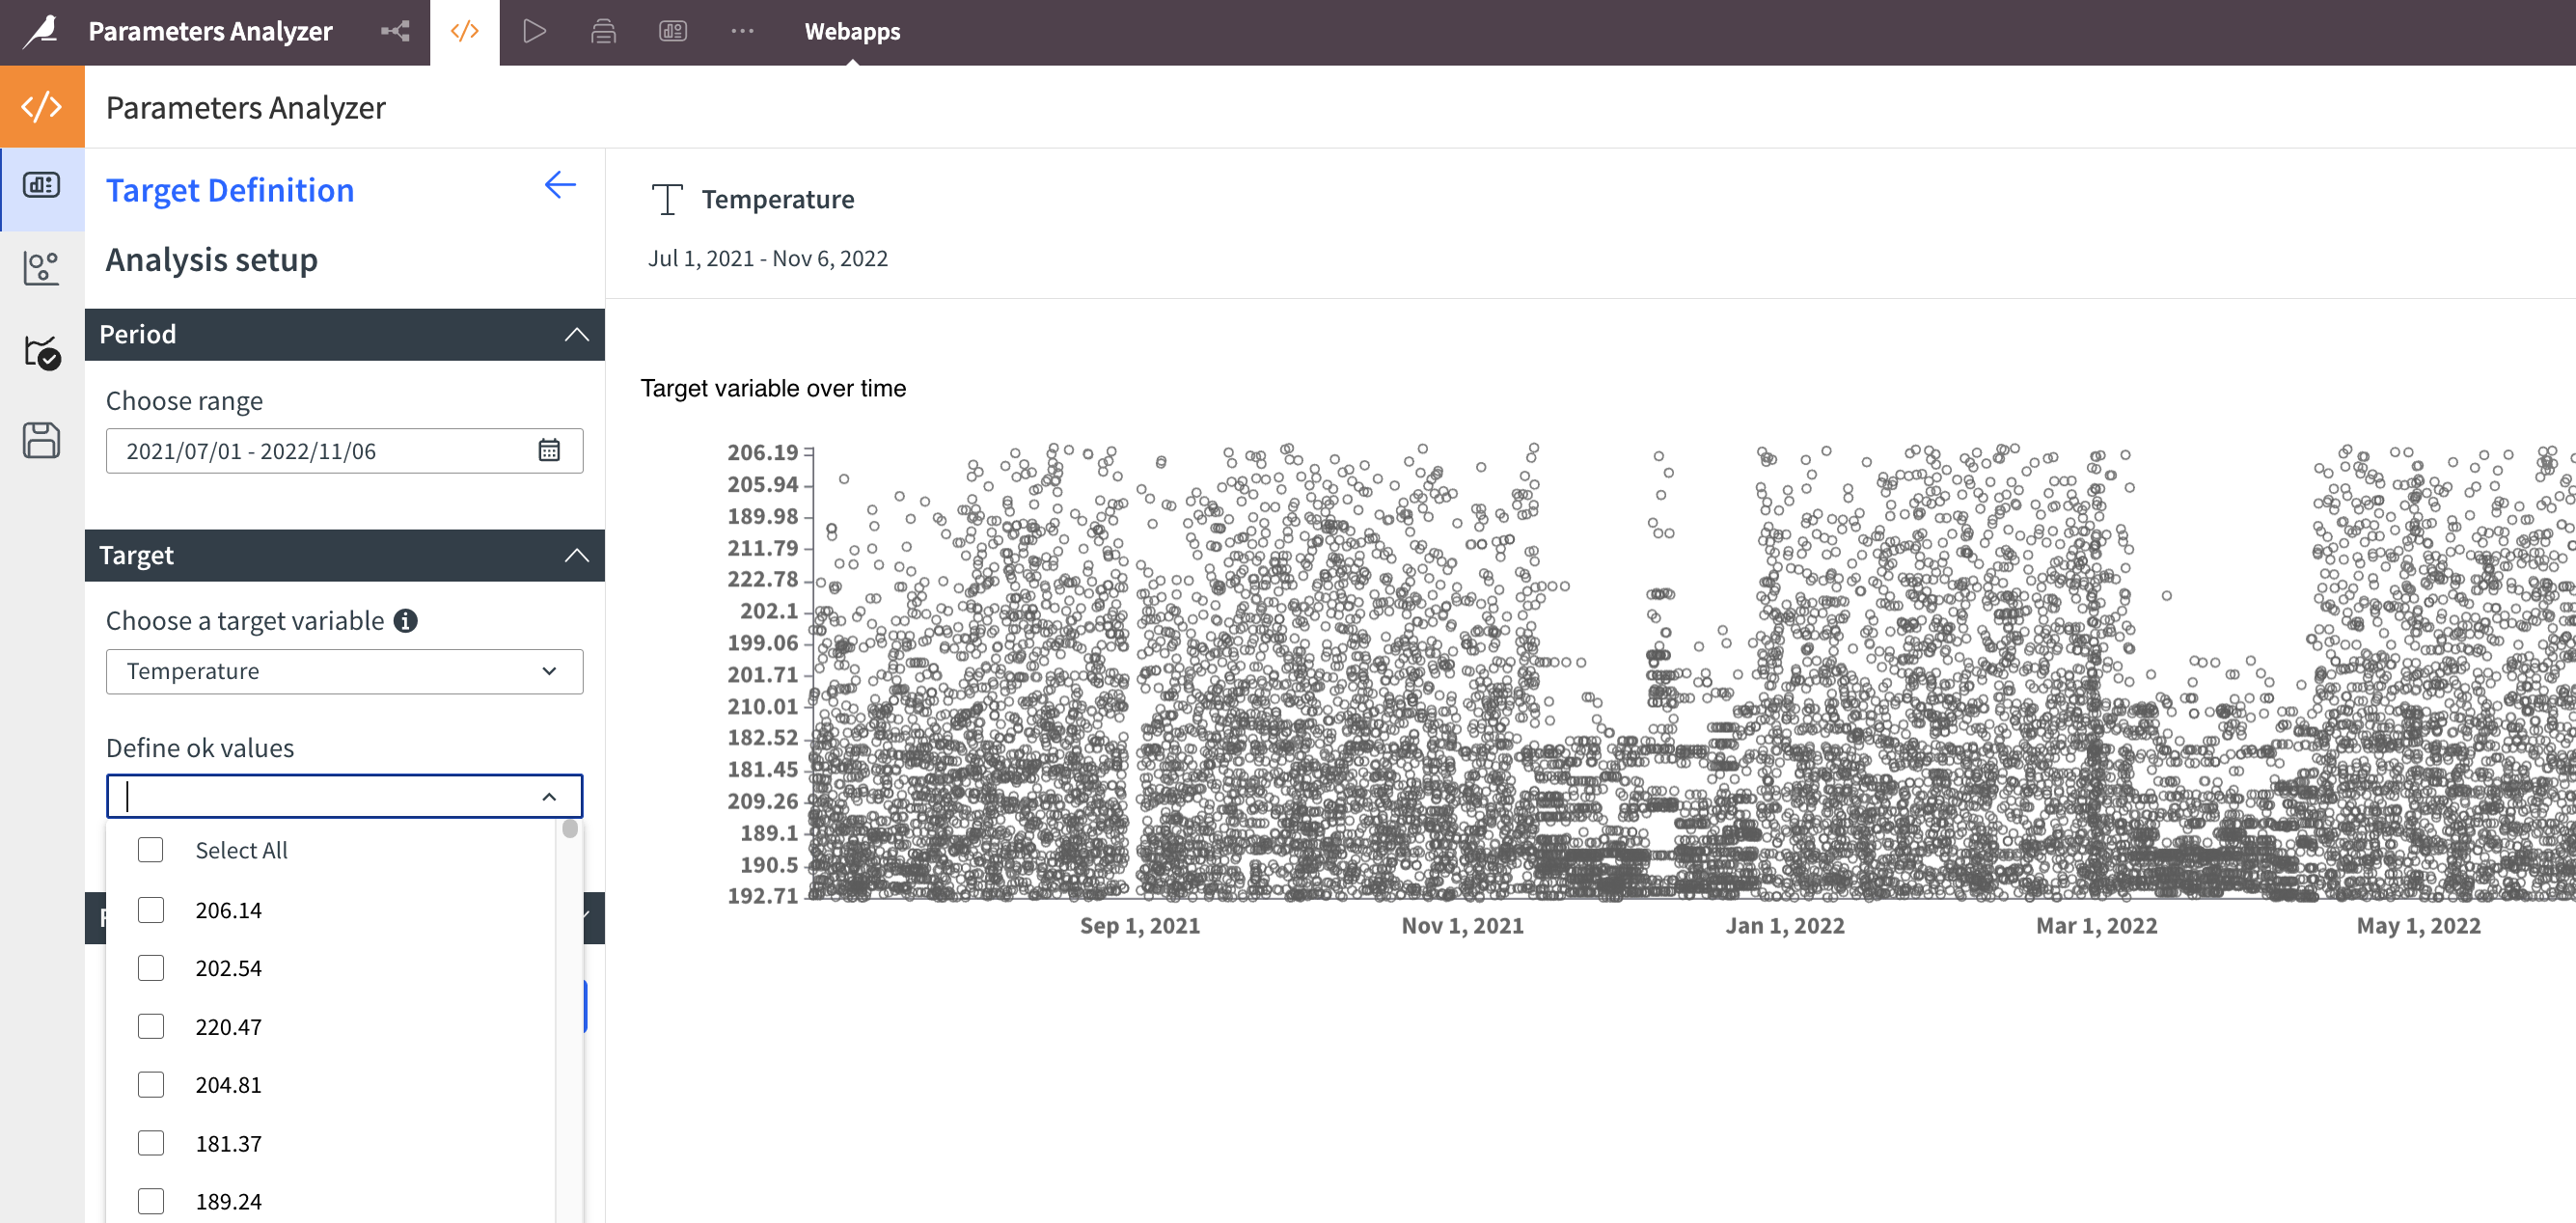
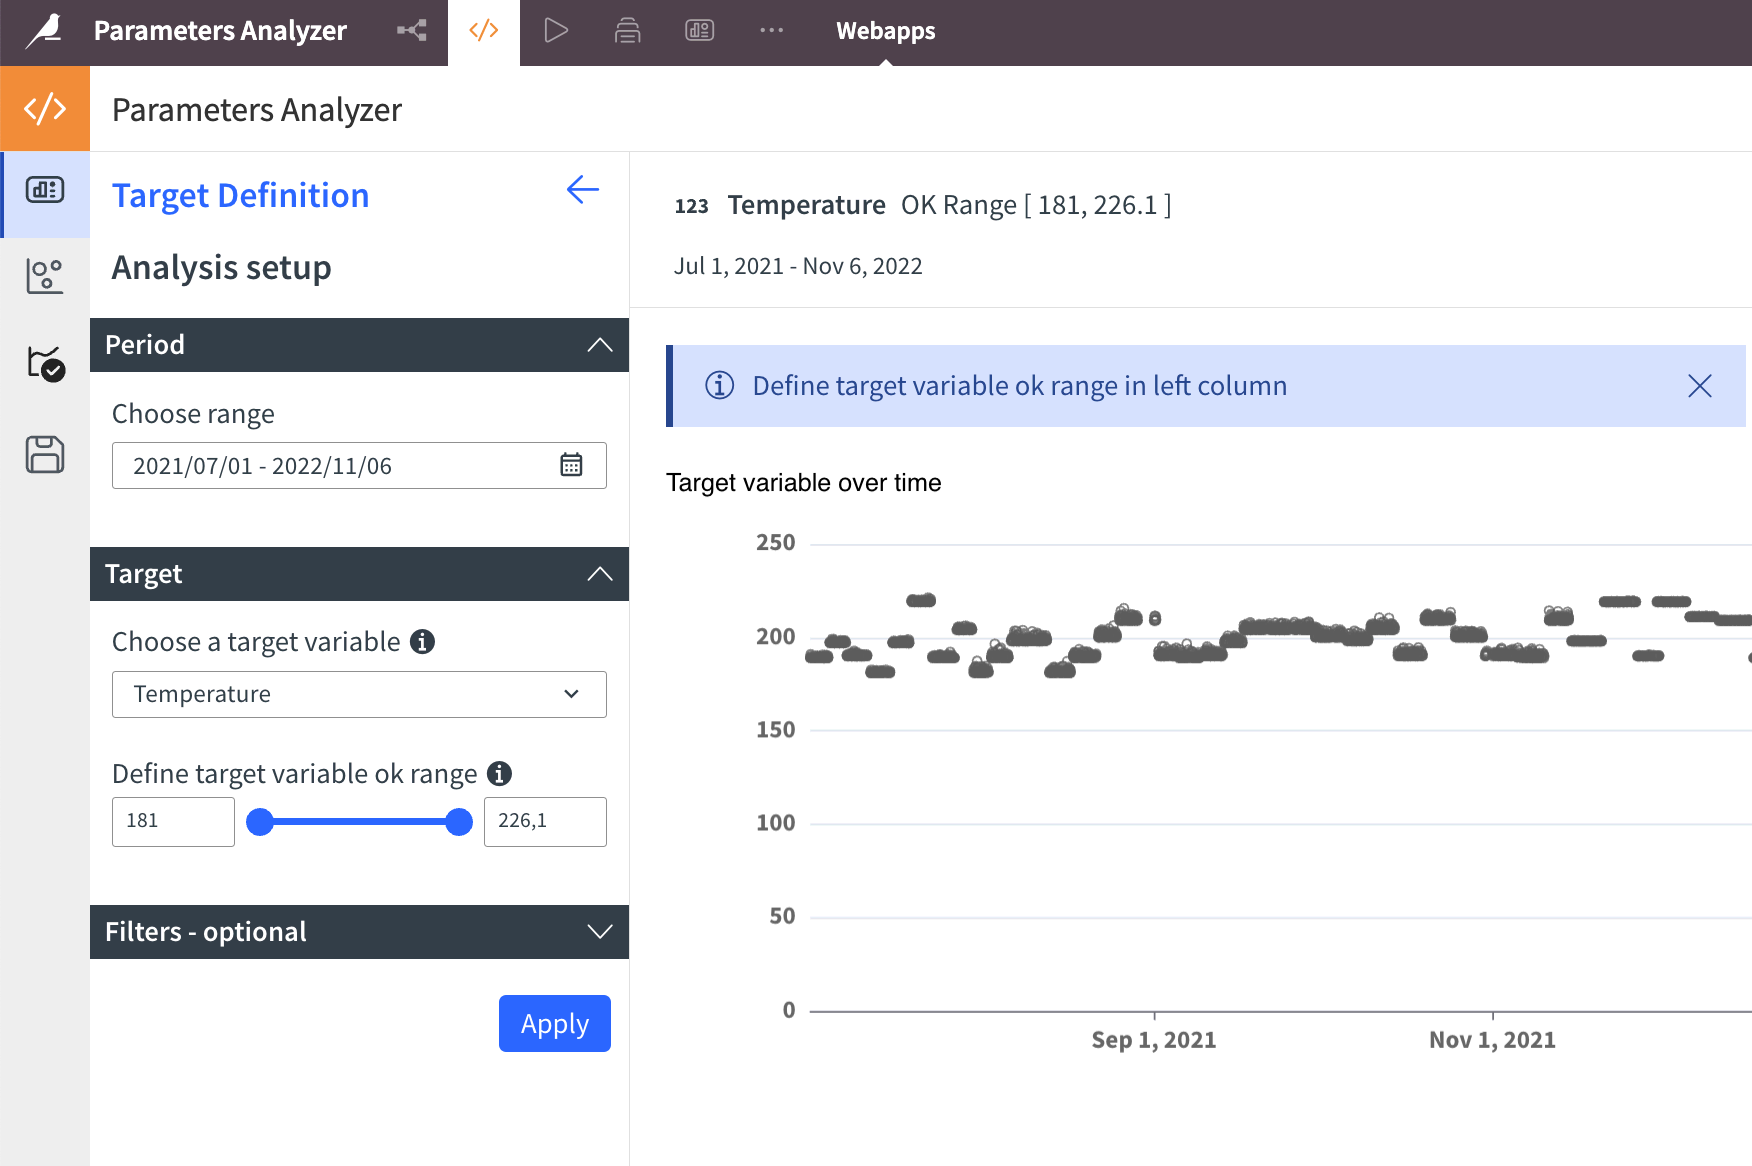
If you have a limited number of points to display (<50,000), you’ll see the time series chart that will help you select the outcome OK range:
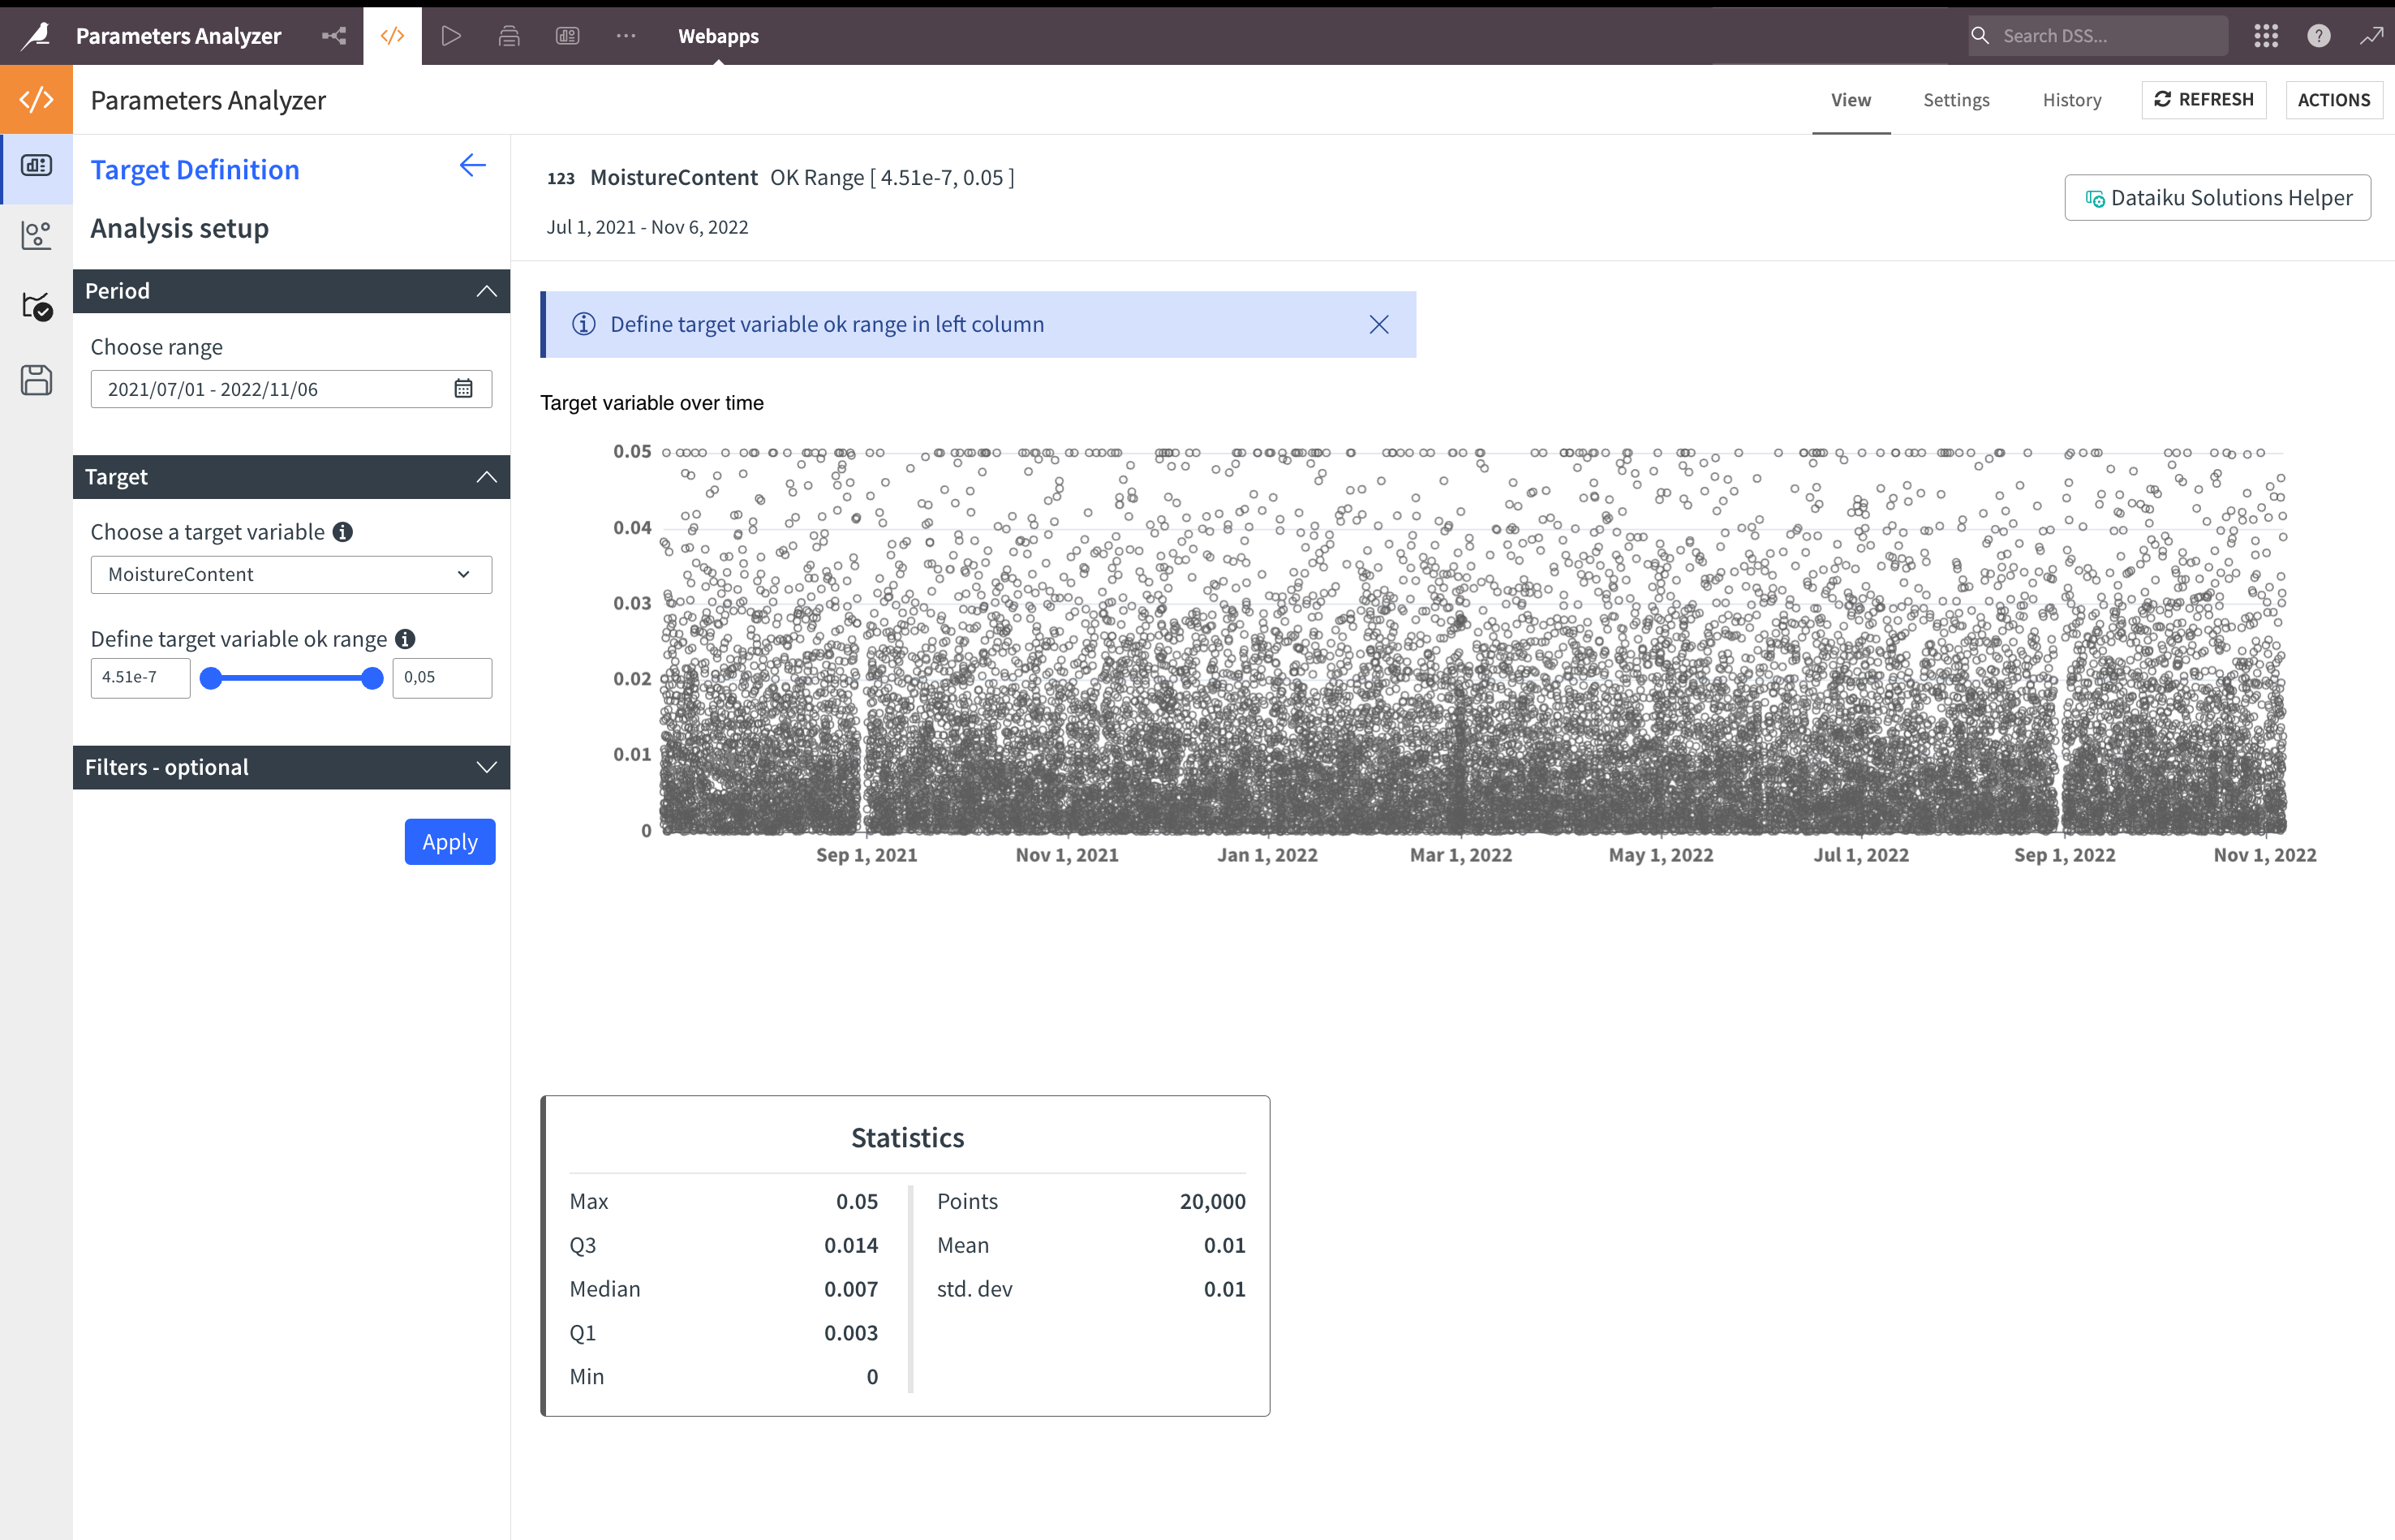
You can now select the OK range of your target variable with the slider on the left or by typing the limits in the boxes, then click Apply. The chart will be colored, and you’ll get the target variable distribution:
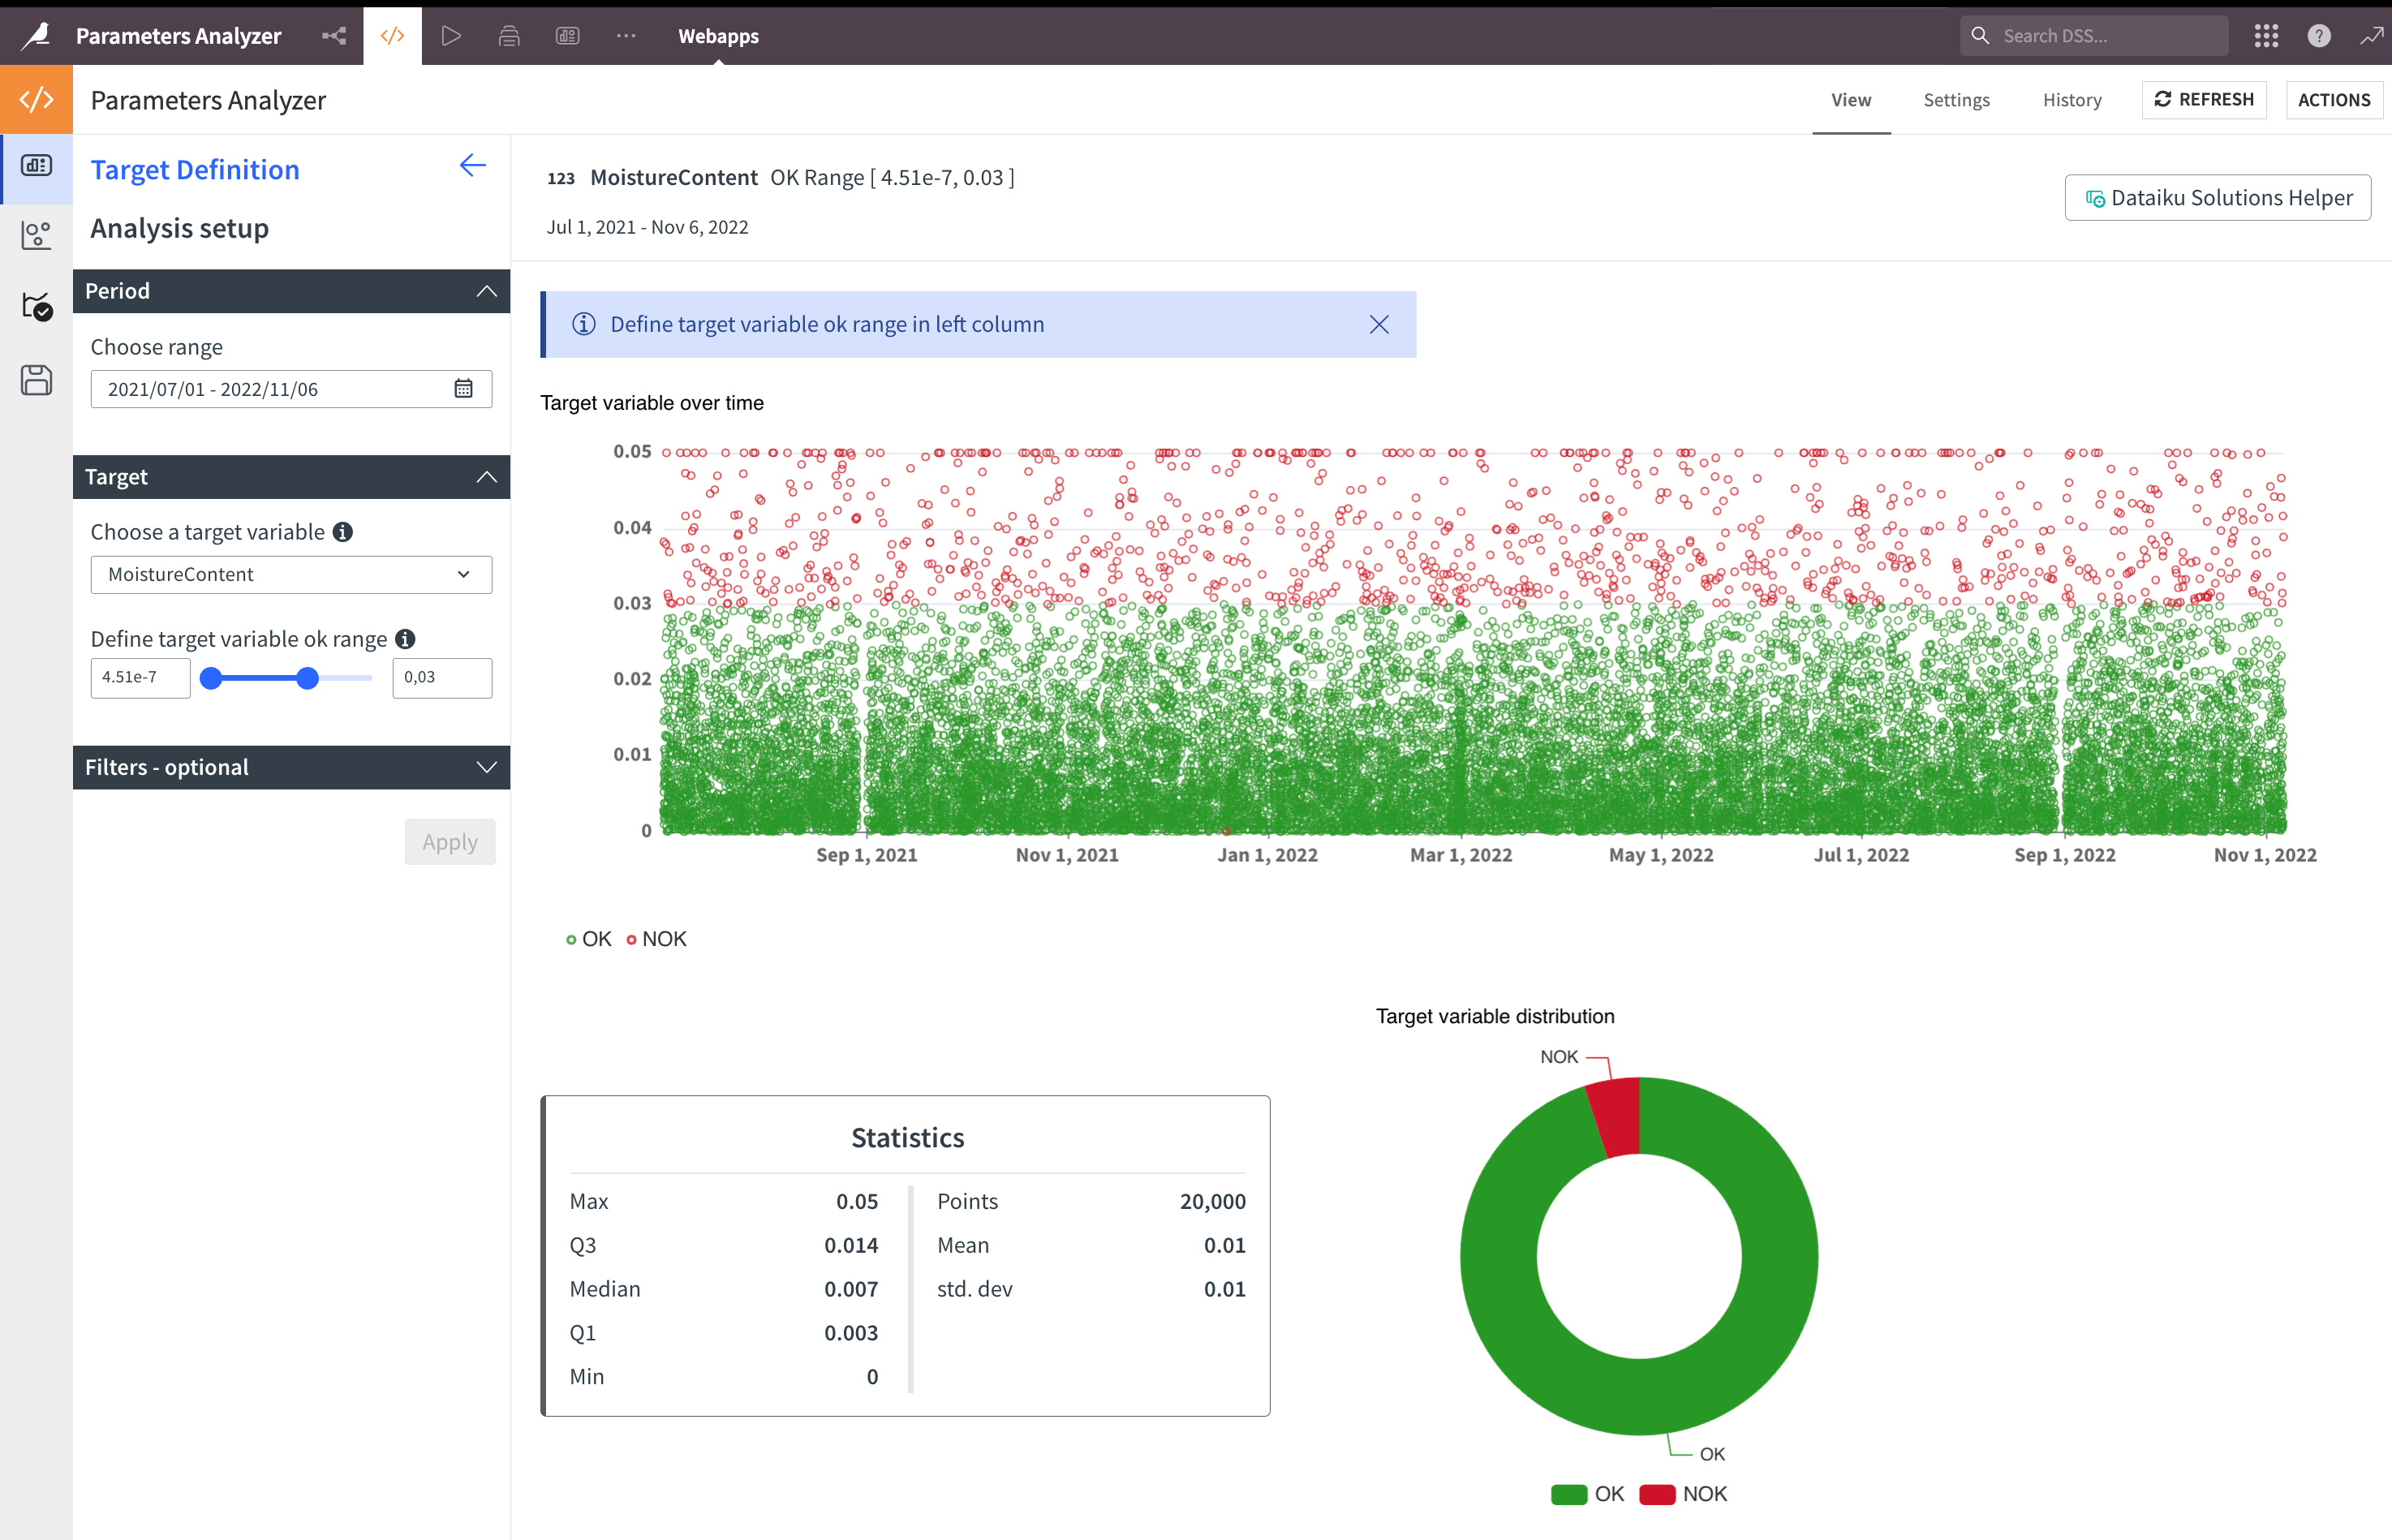
If needed, you can add some filters — both for numerical and categorical variables.
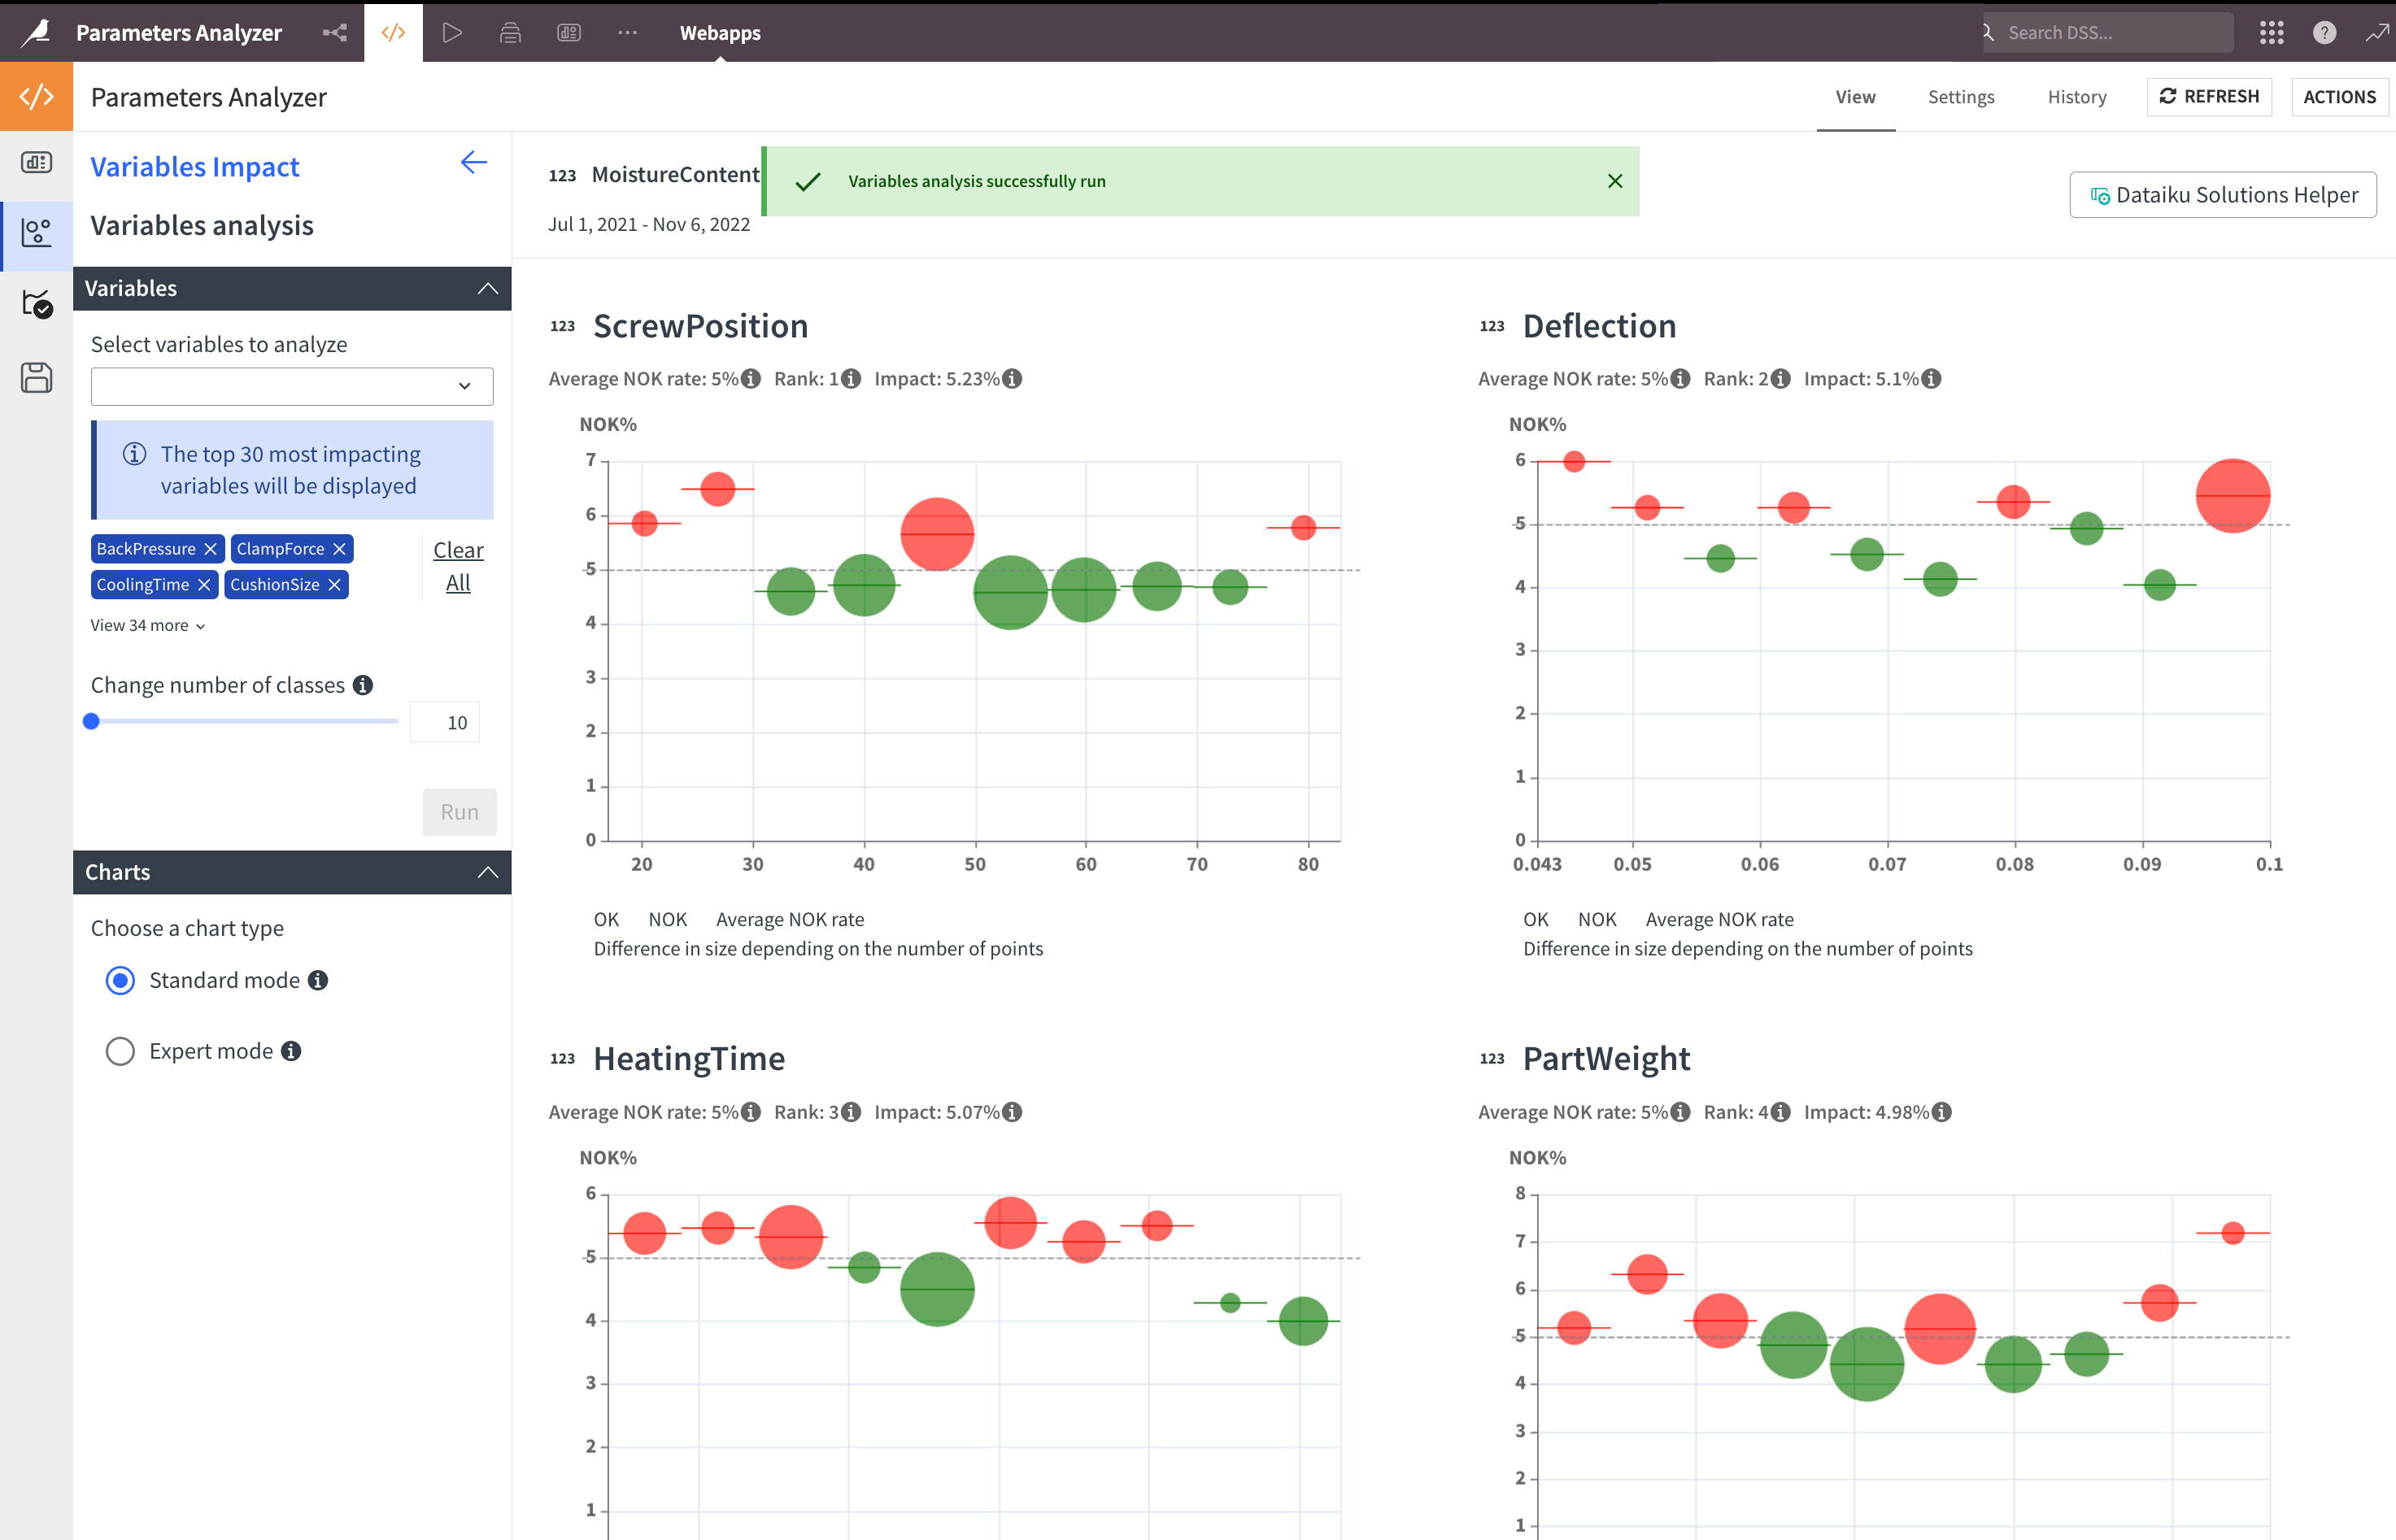
Variables selection & results#
The next step is in the second tab on the left, in which you’ll select the variables to analyze. You can directly type into this field to filter variables. Once your variable selection is done, adjust the number of classes (10–30). It’s the number of points displayed on the charts.
See also
To have more information on this parameter, check the Methodology article of the wiki.
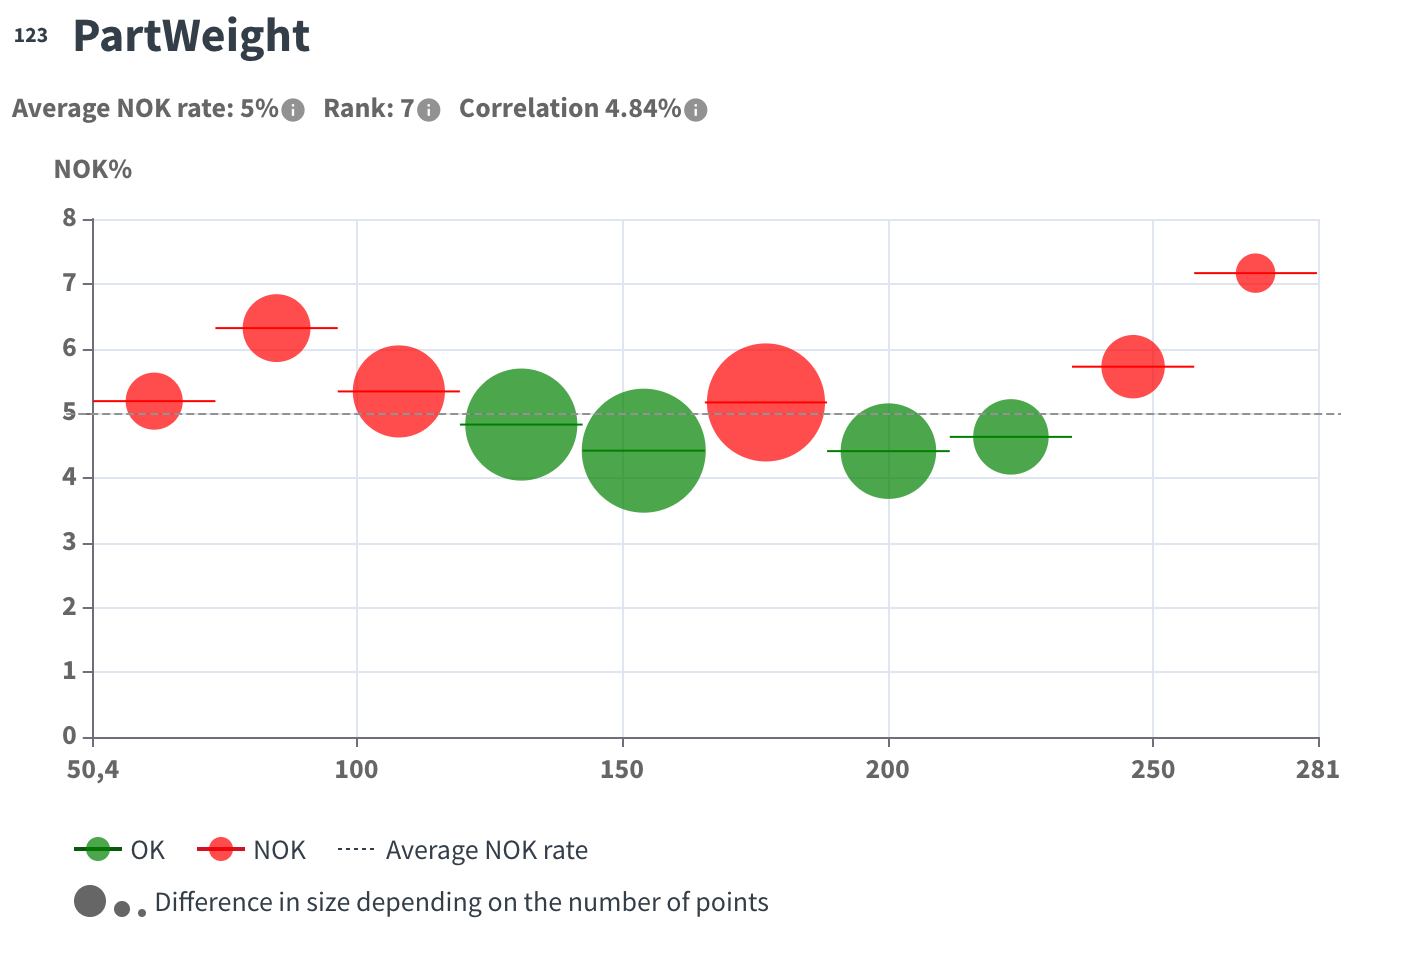
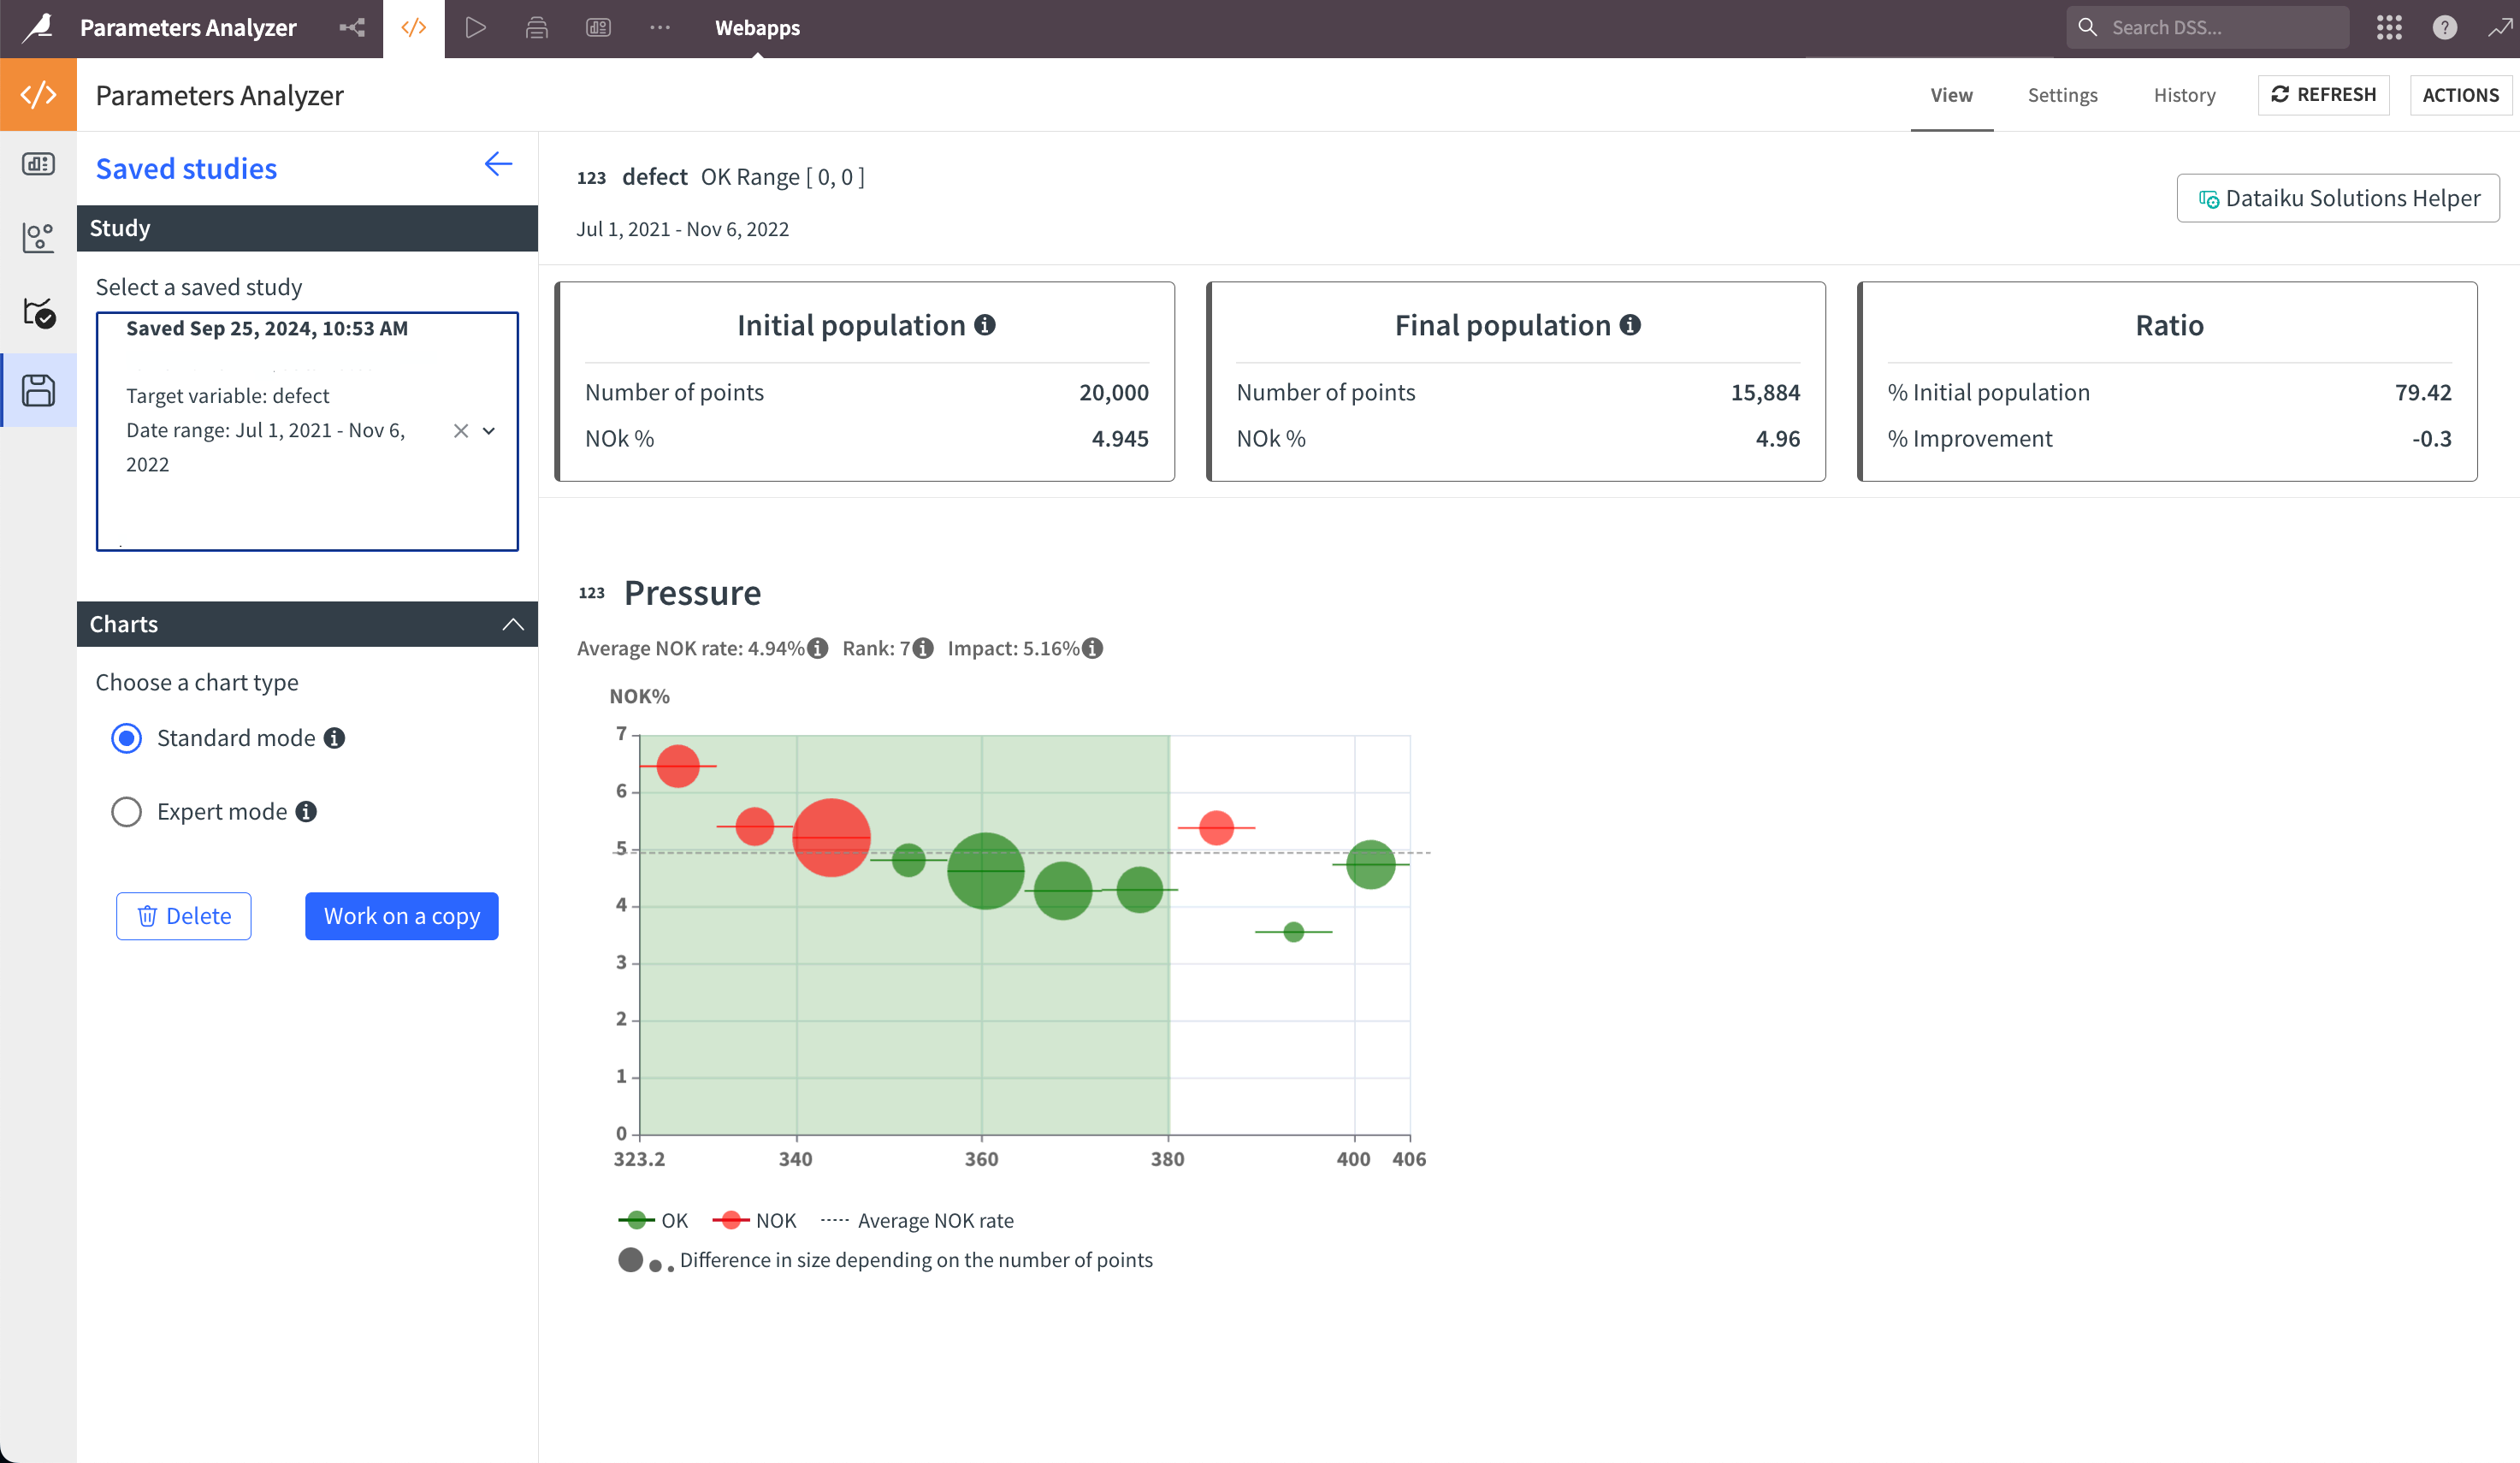
Click Run to get the result. The most impactful variables on the selected outcome are ranked by a correlation factor. Each chart includes:
The name and type of the variable in the title.
The average NOK rate: the percentage of NOK points calculated on non-empty rows.
The rank and correlation of this variable.
In the default bubble charts:
The size of the bubble shows the number of points in the bubble.
The horizontal line of the bubble shows the interval.
The dashed line shows the average NOK rate of the variable.
The color is green if the NOK rate of this interval is below the average NOK rate.
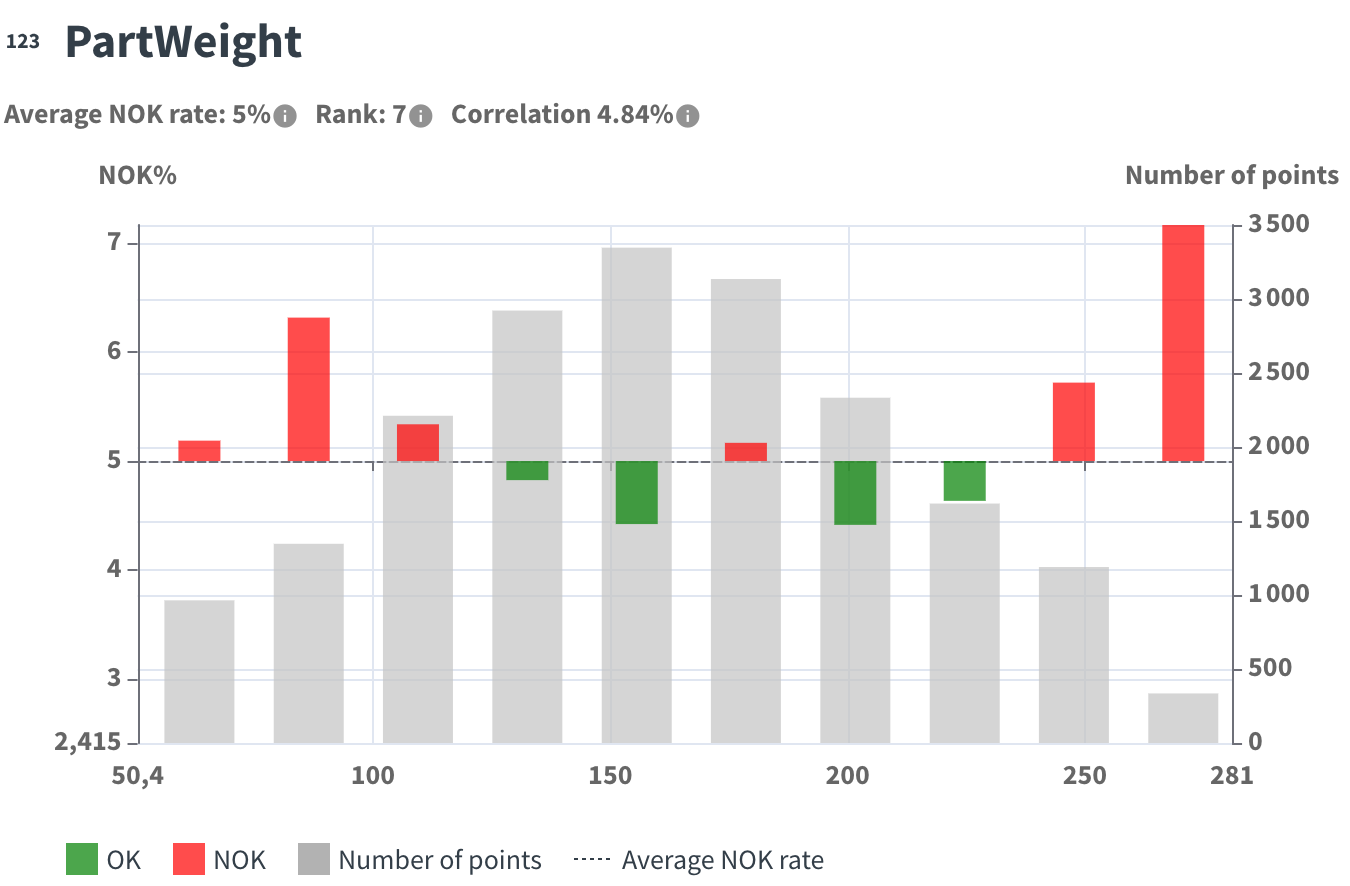
You can switch to Expert mode, which uses a histogram view:
The gray histogram shows the number of points.
Bars start from the average NOK rate line:
Upward if the defect rate is superior to the average.
Downward if the defect rate is inferior.
Below is a comparison of the two chart types:
Standard mode chart:
Expert mode chart:
Define a new rule#
Once you have obtained the results, you can start defining a rule, which is a combination of several parameter intervals. Select a variable, adjust the range or select the modalities, and click Save Range.
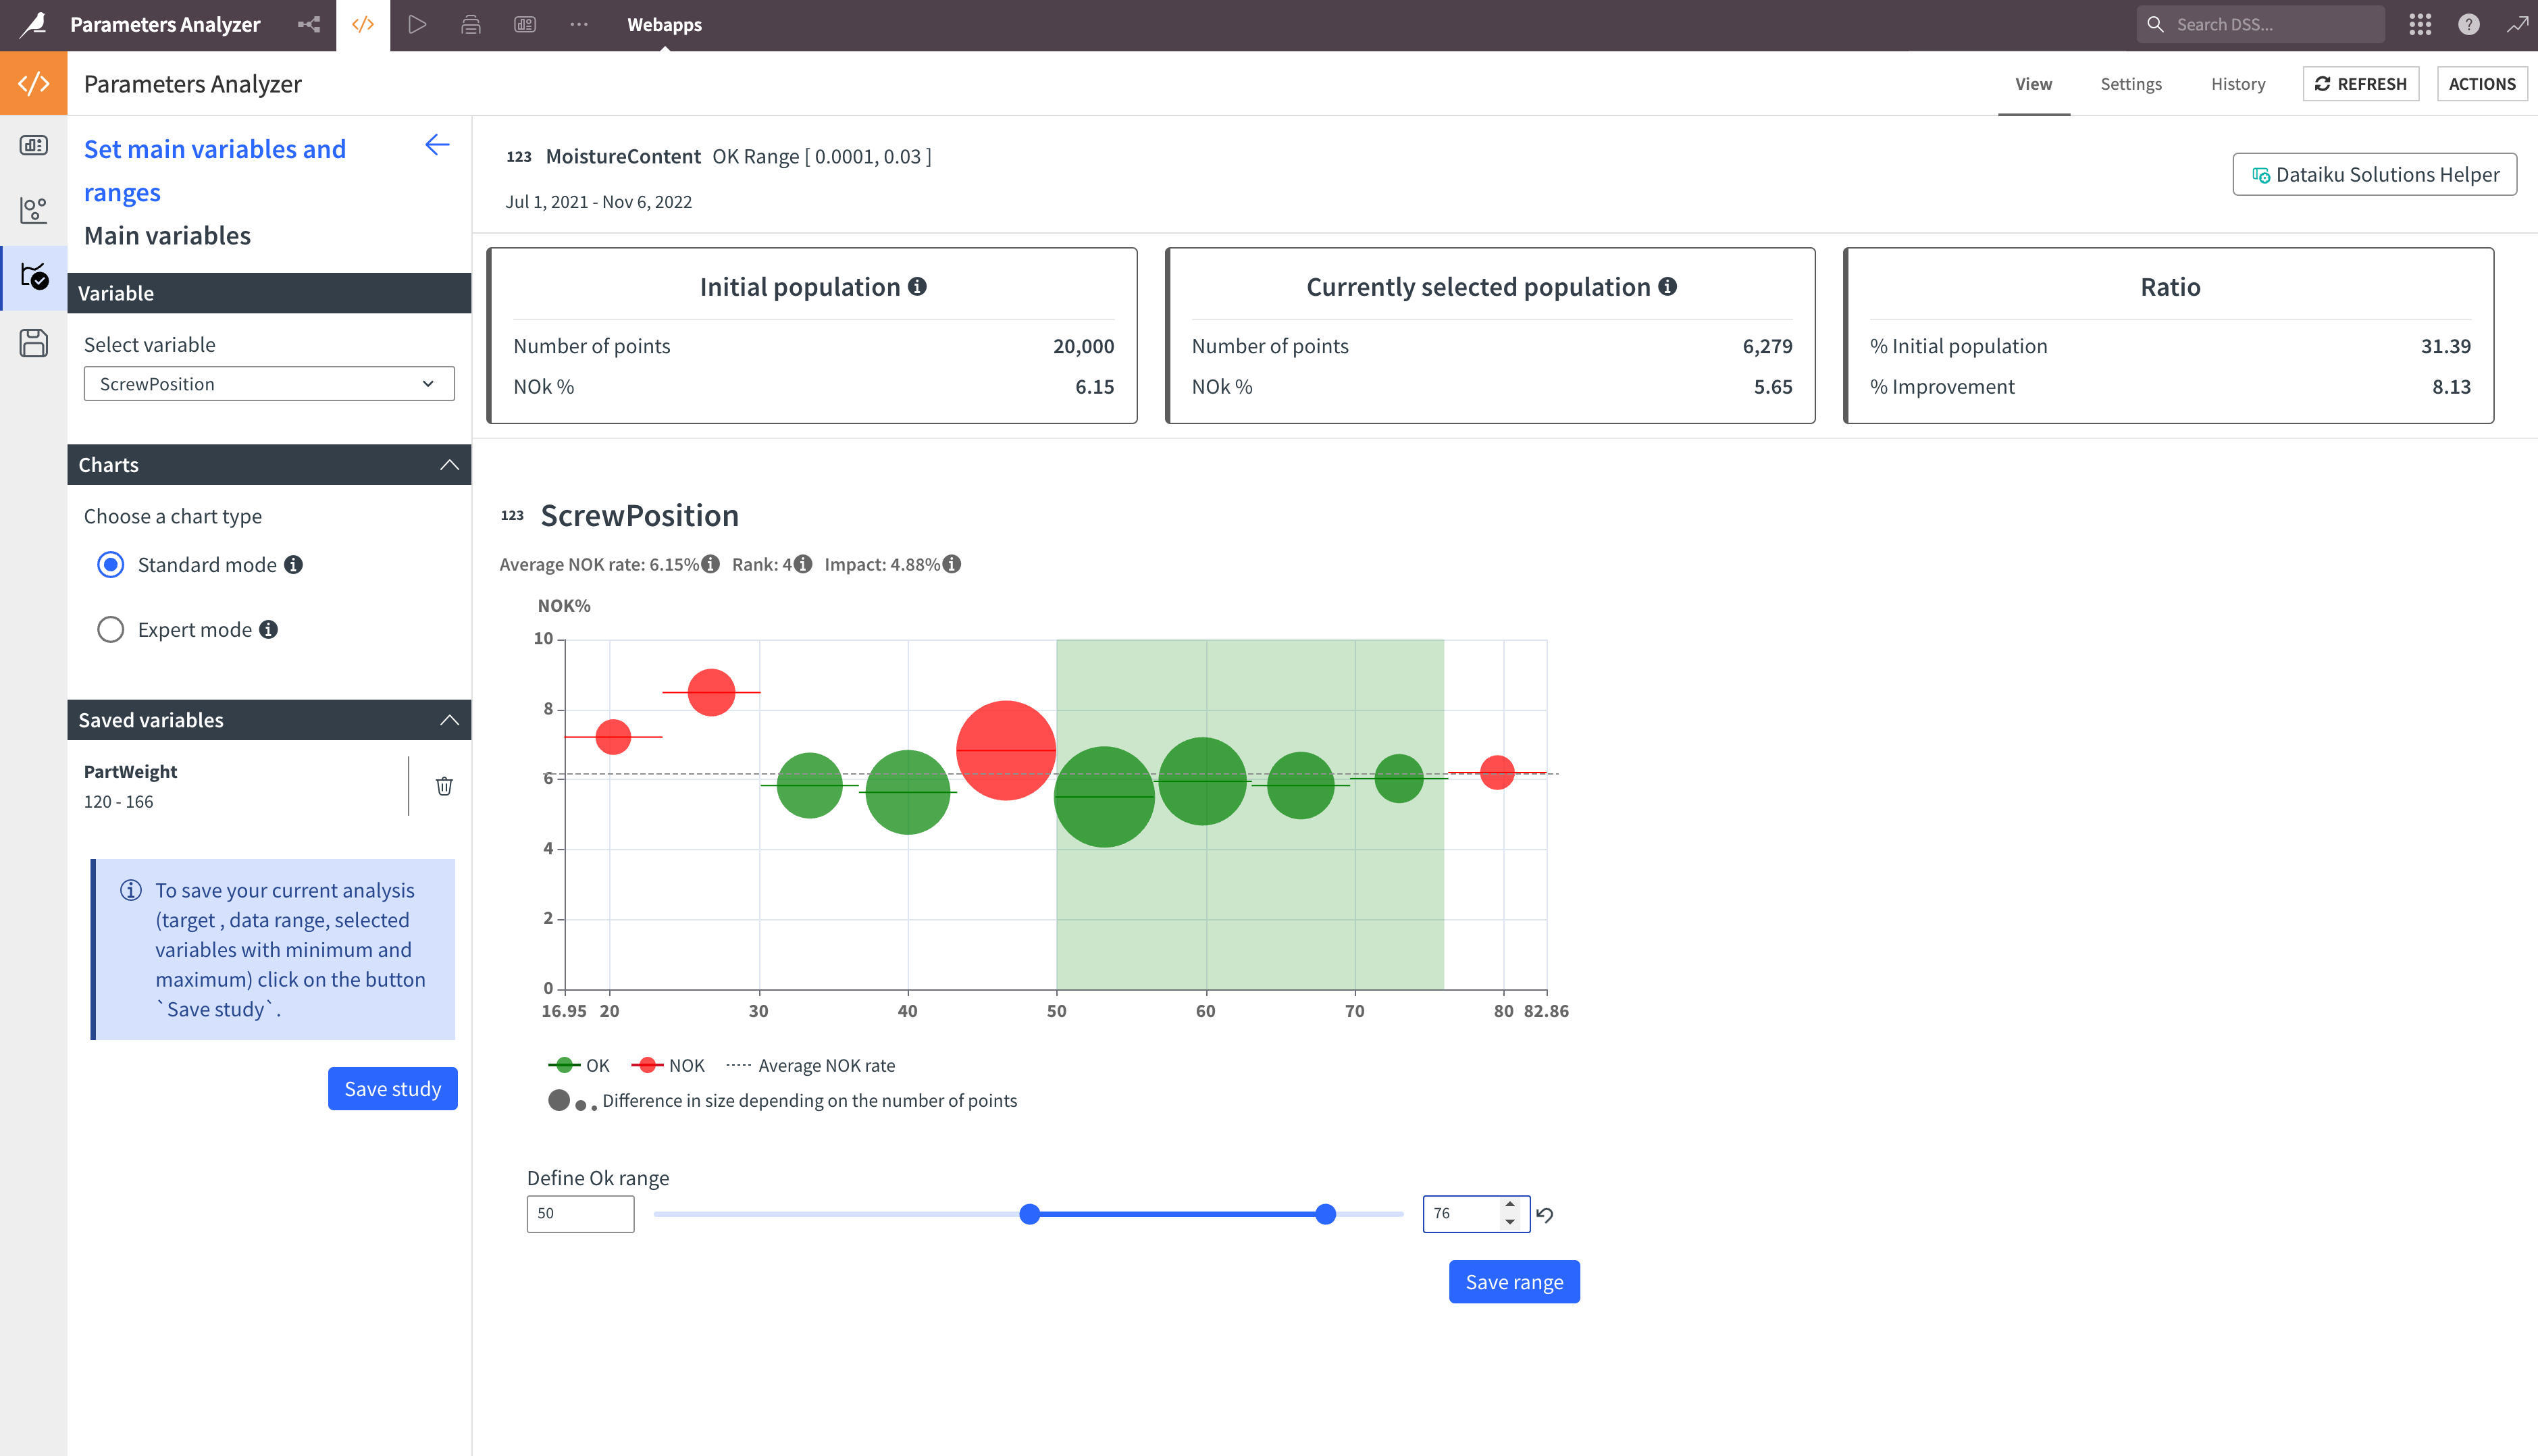
At the top, you’ll have:
Metric |
Contents |
|---|---|
Initial population |
Number of points and NOK rate in the analysis. |
Selected population |
Number of points and NOK rate in the selected ranges. |
Ratio |
Percentage of the initial population and percentage of improvement in the selected ranges. |
The result always reflects the combination of the selected ranges.
Explore saved studies and work on a copy#
Instead of launching a new analysis, you can check the existing saved studies by navigating to the fourth tab.
Select the study you want to display and work on a copy. This will reload the study with its saved analysis parameters.
Reproducing these processes with minimal effort for your data#
This Solution equips Dataiku users with an understanding of how to analyze the impact of process parameters changes by process experts, such as process and quality engineers.
By creating a singular Solution that can benefit and influence the decisions of a variety of teams in a single organization, you can implement strategies to better understand your manufacturing process, know and control the most impacting parameters, and finally make continuous improvement.