
Share insights with a dashboard#
See a screencast covering this section’s steps.

Once you start collaborating, you’ll need a way to communicate insights.
Dashboards are a key tool in Dataiku for sharing insights such as charts, webapps, metrics, machine learning model results, etc. They’re particularly well suited for situations where different users on the project may require different levels of permission.
View the project’s dashboard#
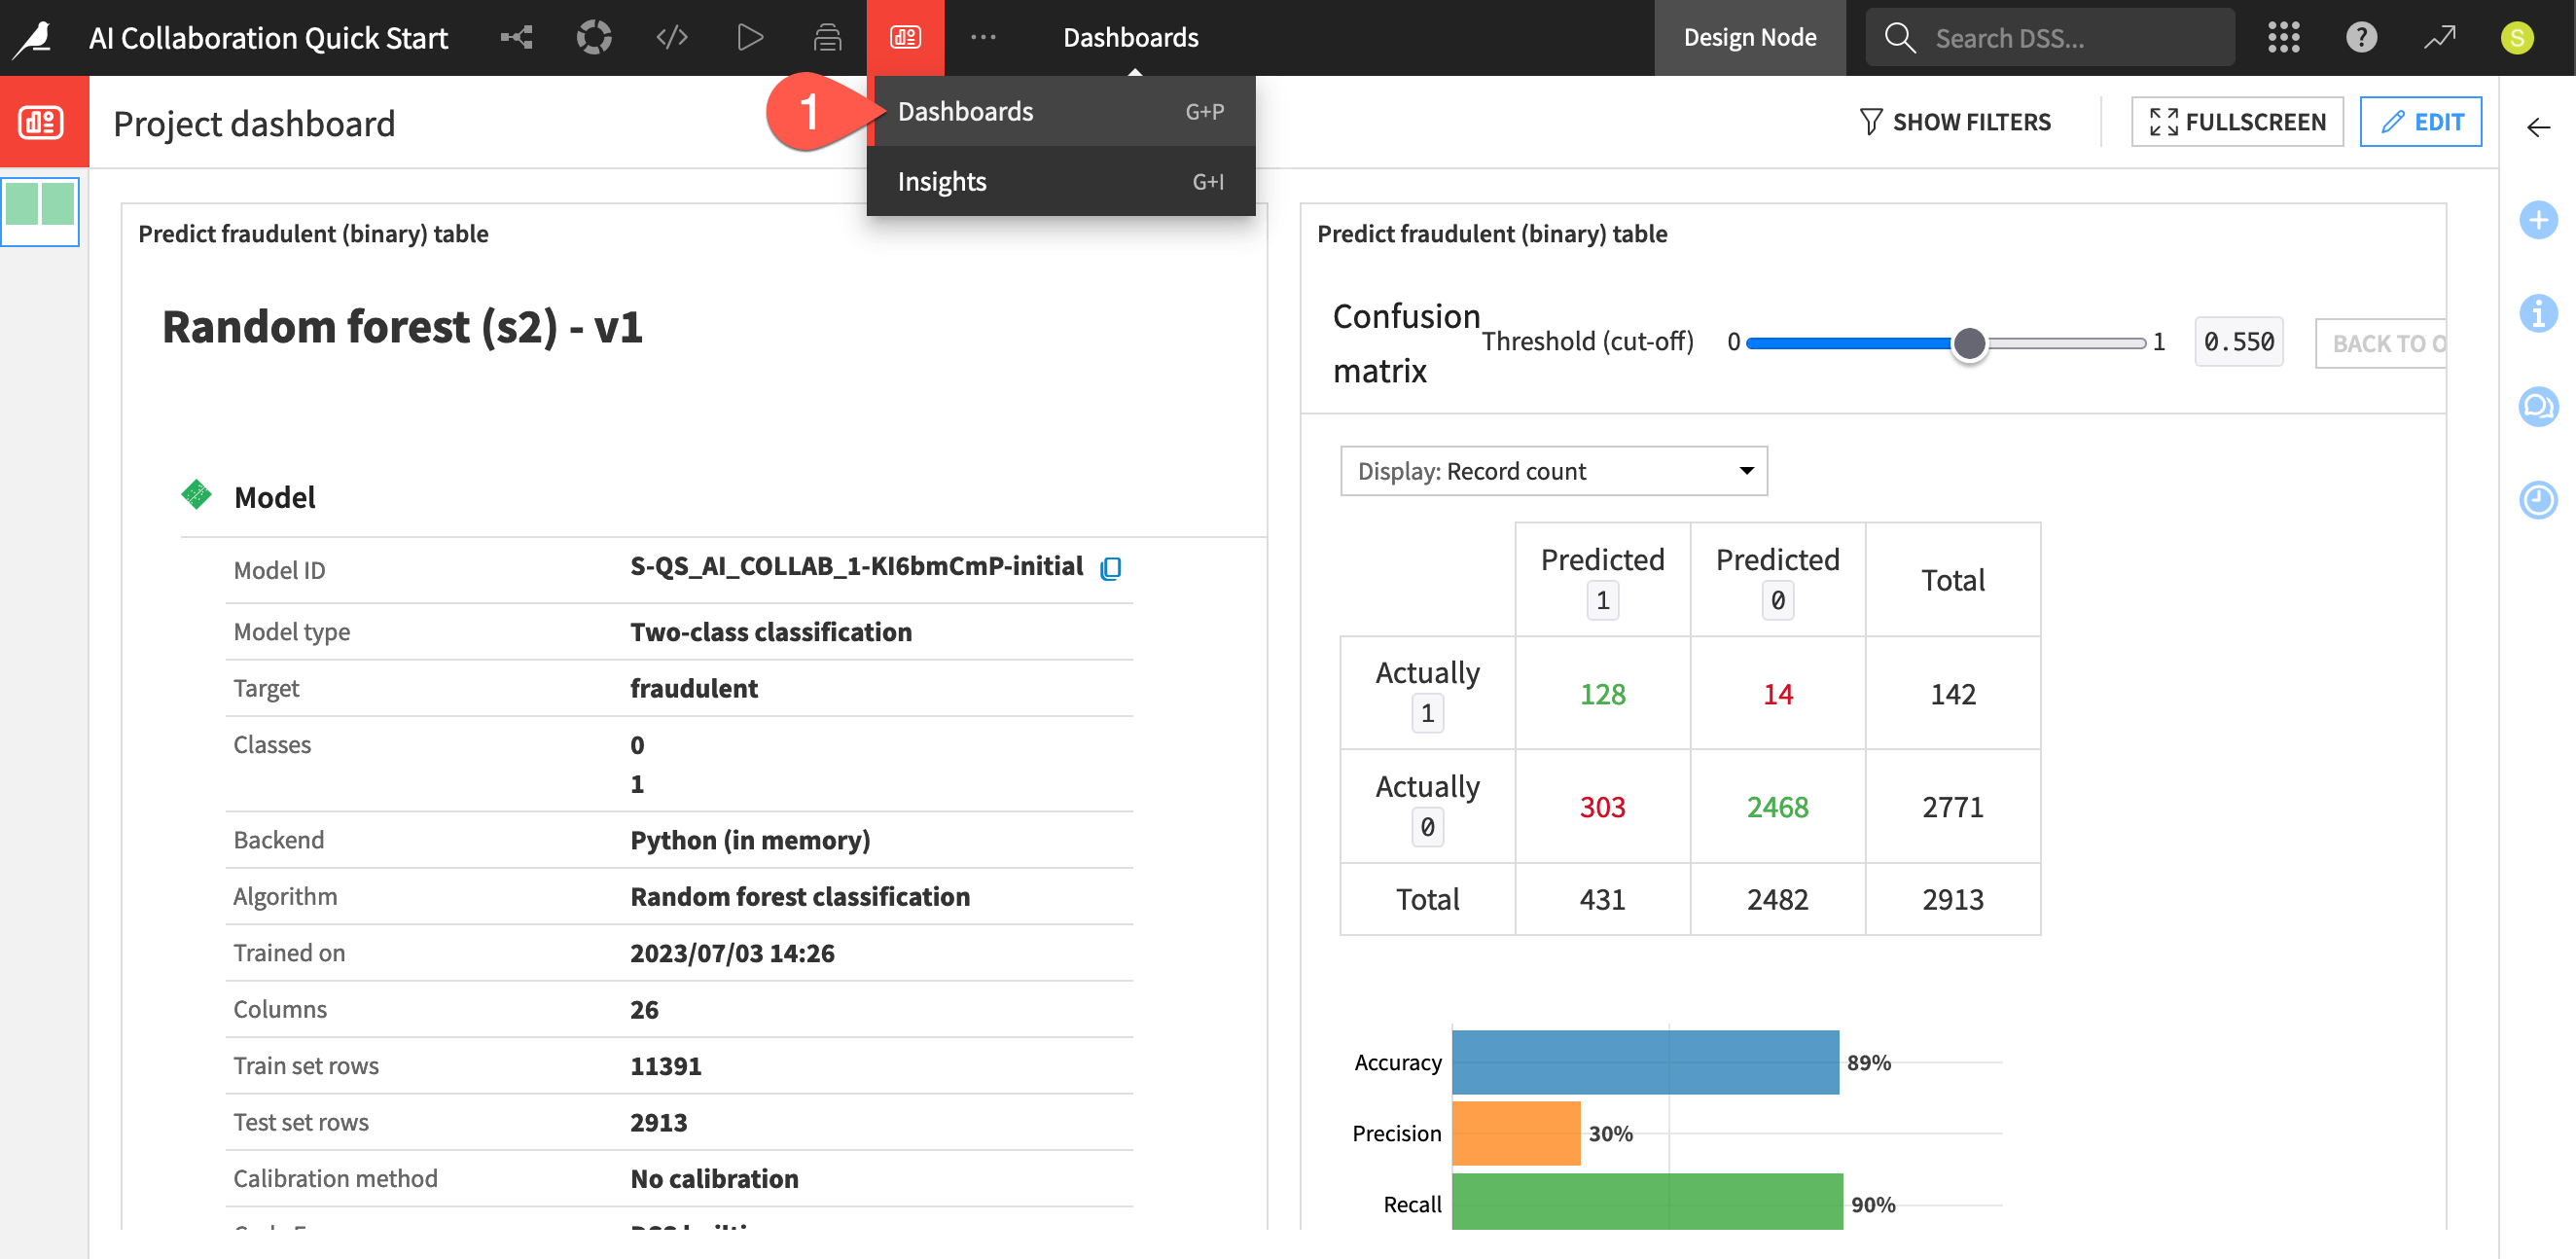
Start by exploring the project’s existing dashboard.
From the project’s top navigation bar, go to the Dashboards (
 ) page (or use the keyboard shortcut
 g+p).Click to open the Project dashboard.
Observe the insights about the model found in the project’s Flow.
Create an insight on a dashboard#
Add more information to this dashboard.
Click Edit to make changes.
In the left panel, click the plus (
 ) to add a new page.
Click + New Tile to add to the dashboard.
Choose Chart from the available dashboard tiles.
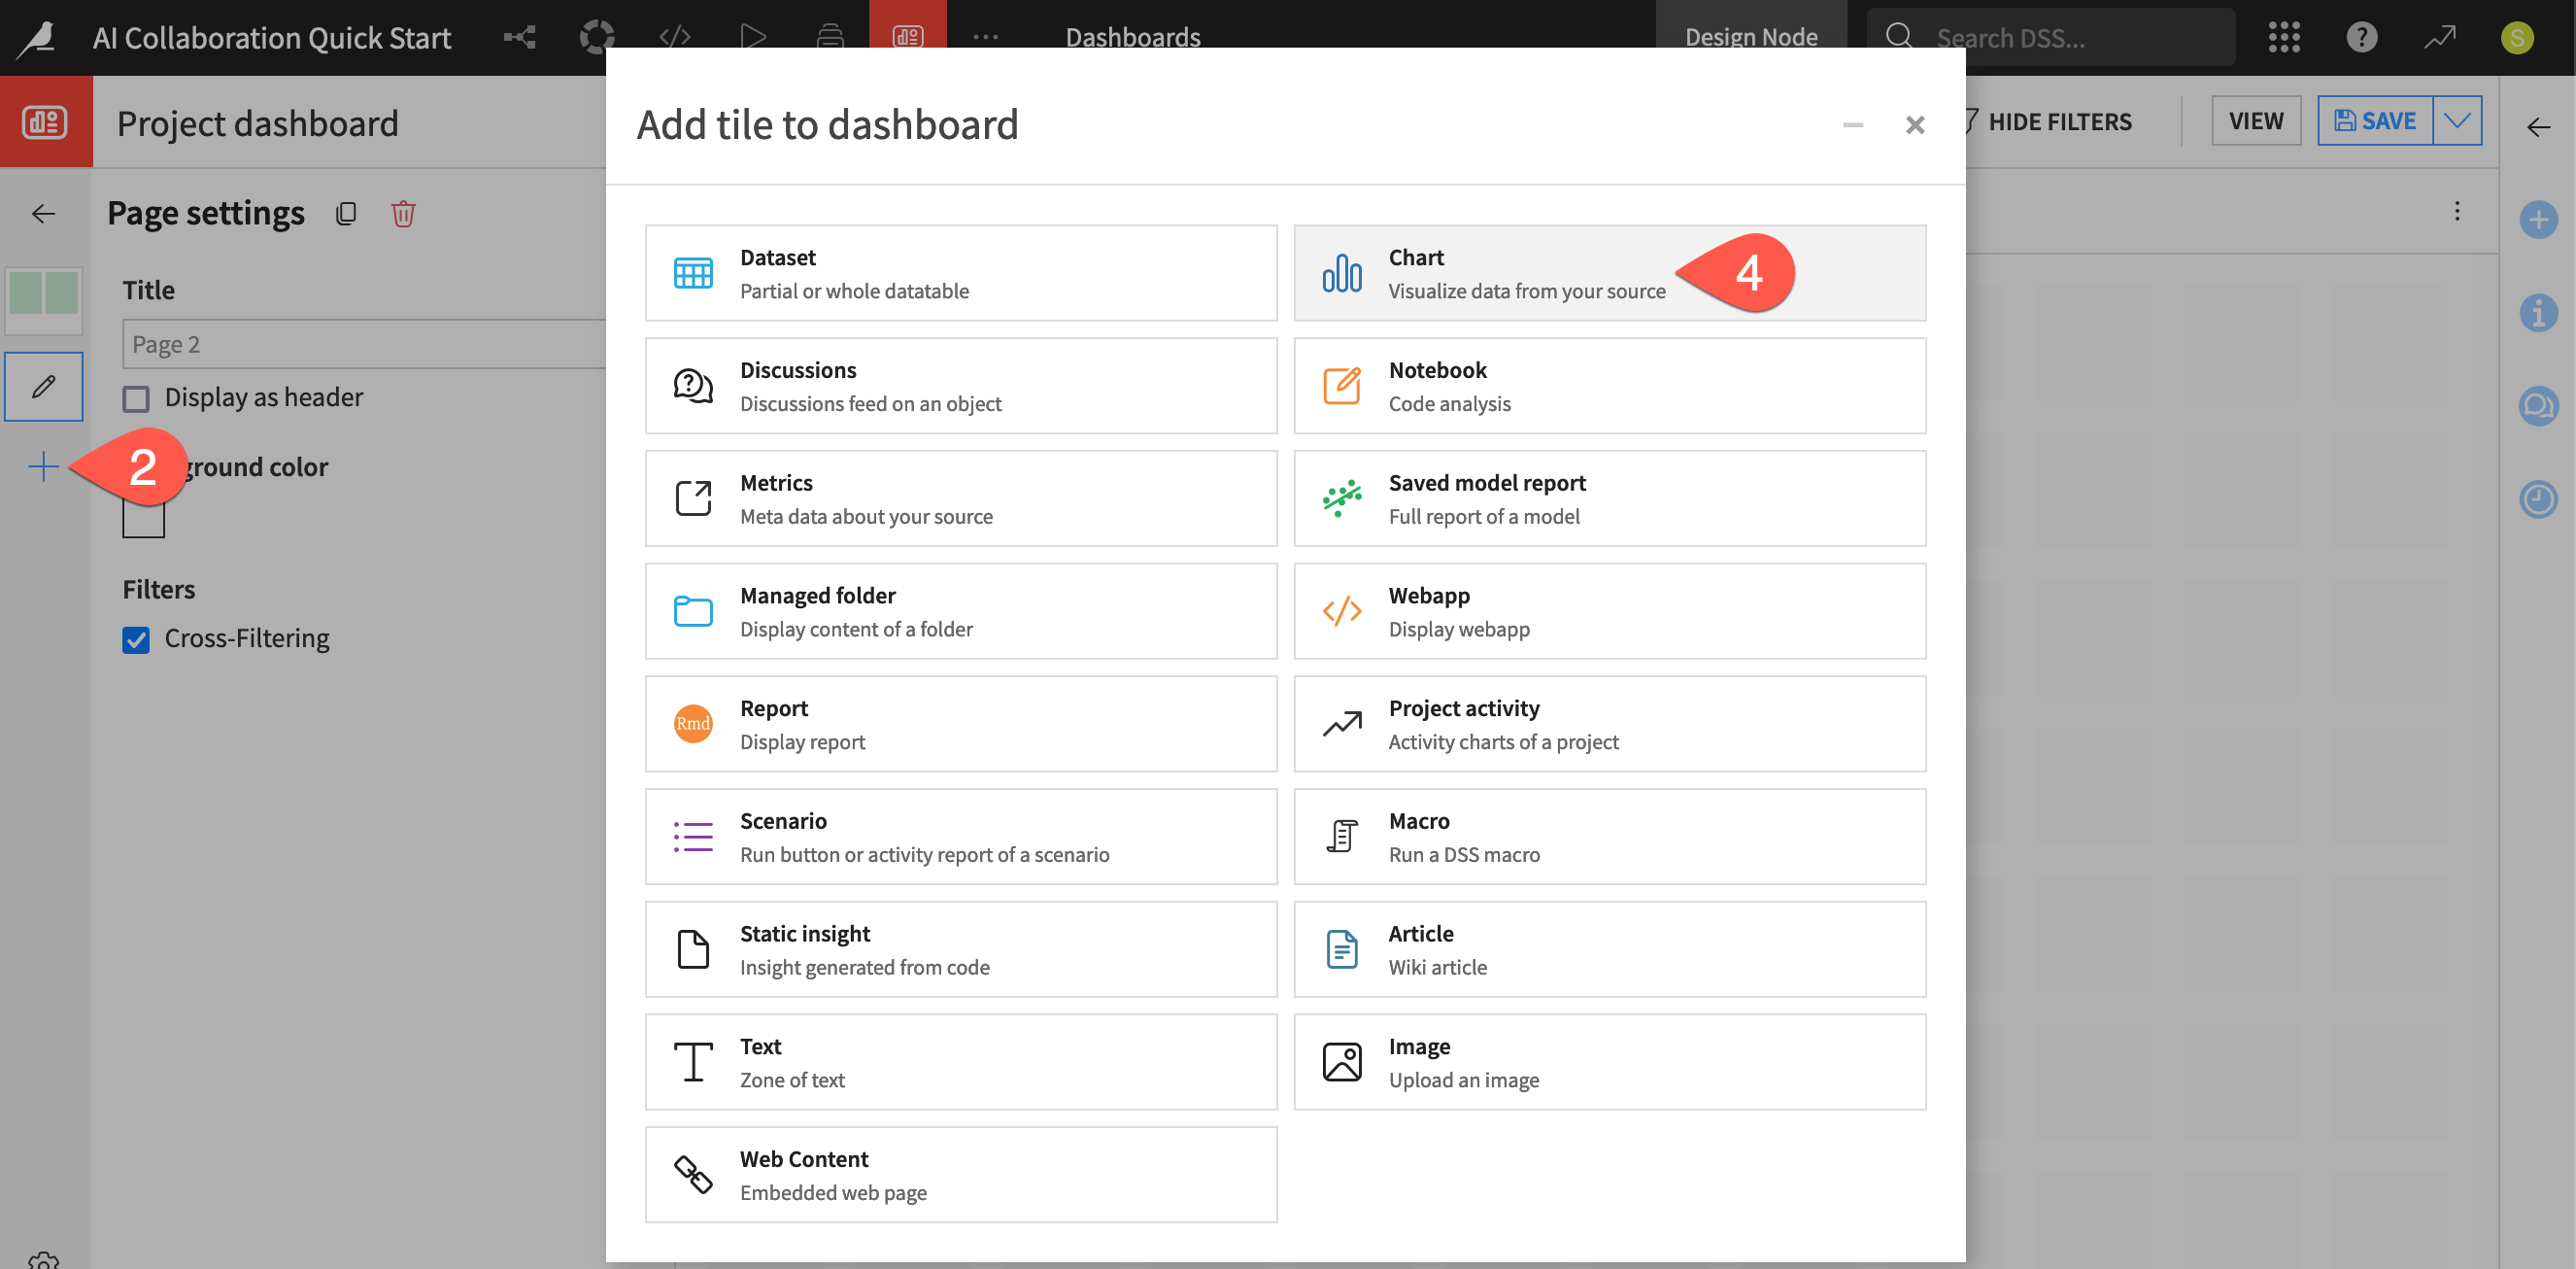
For the source dataset, select job_postings_prepared_joined.
Click Add.
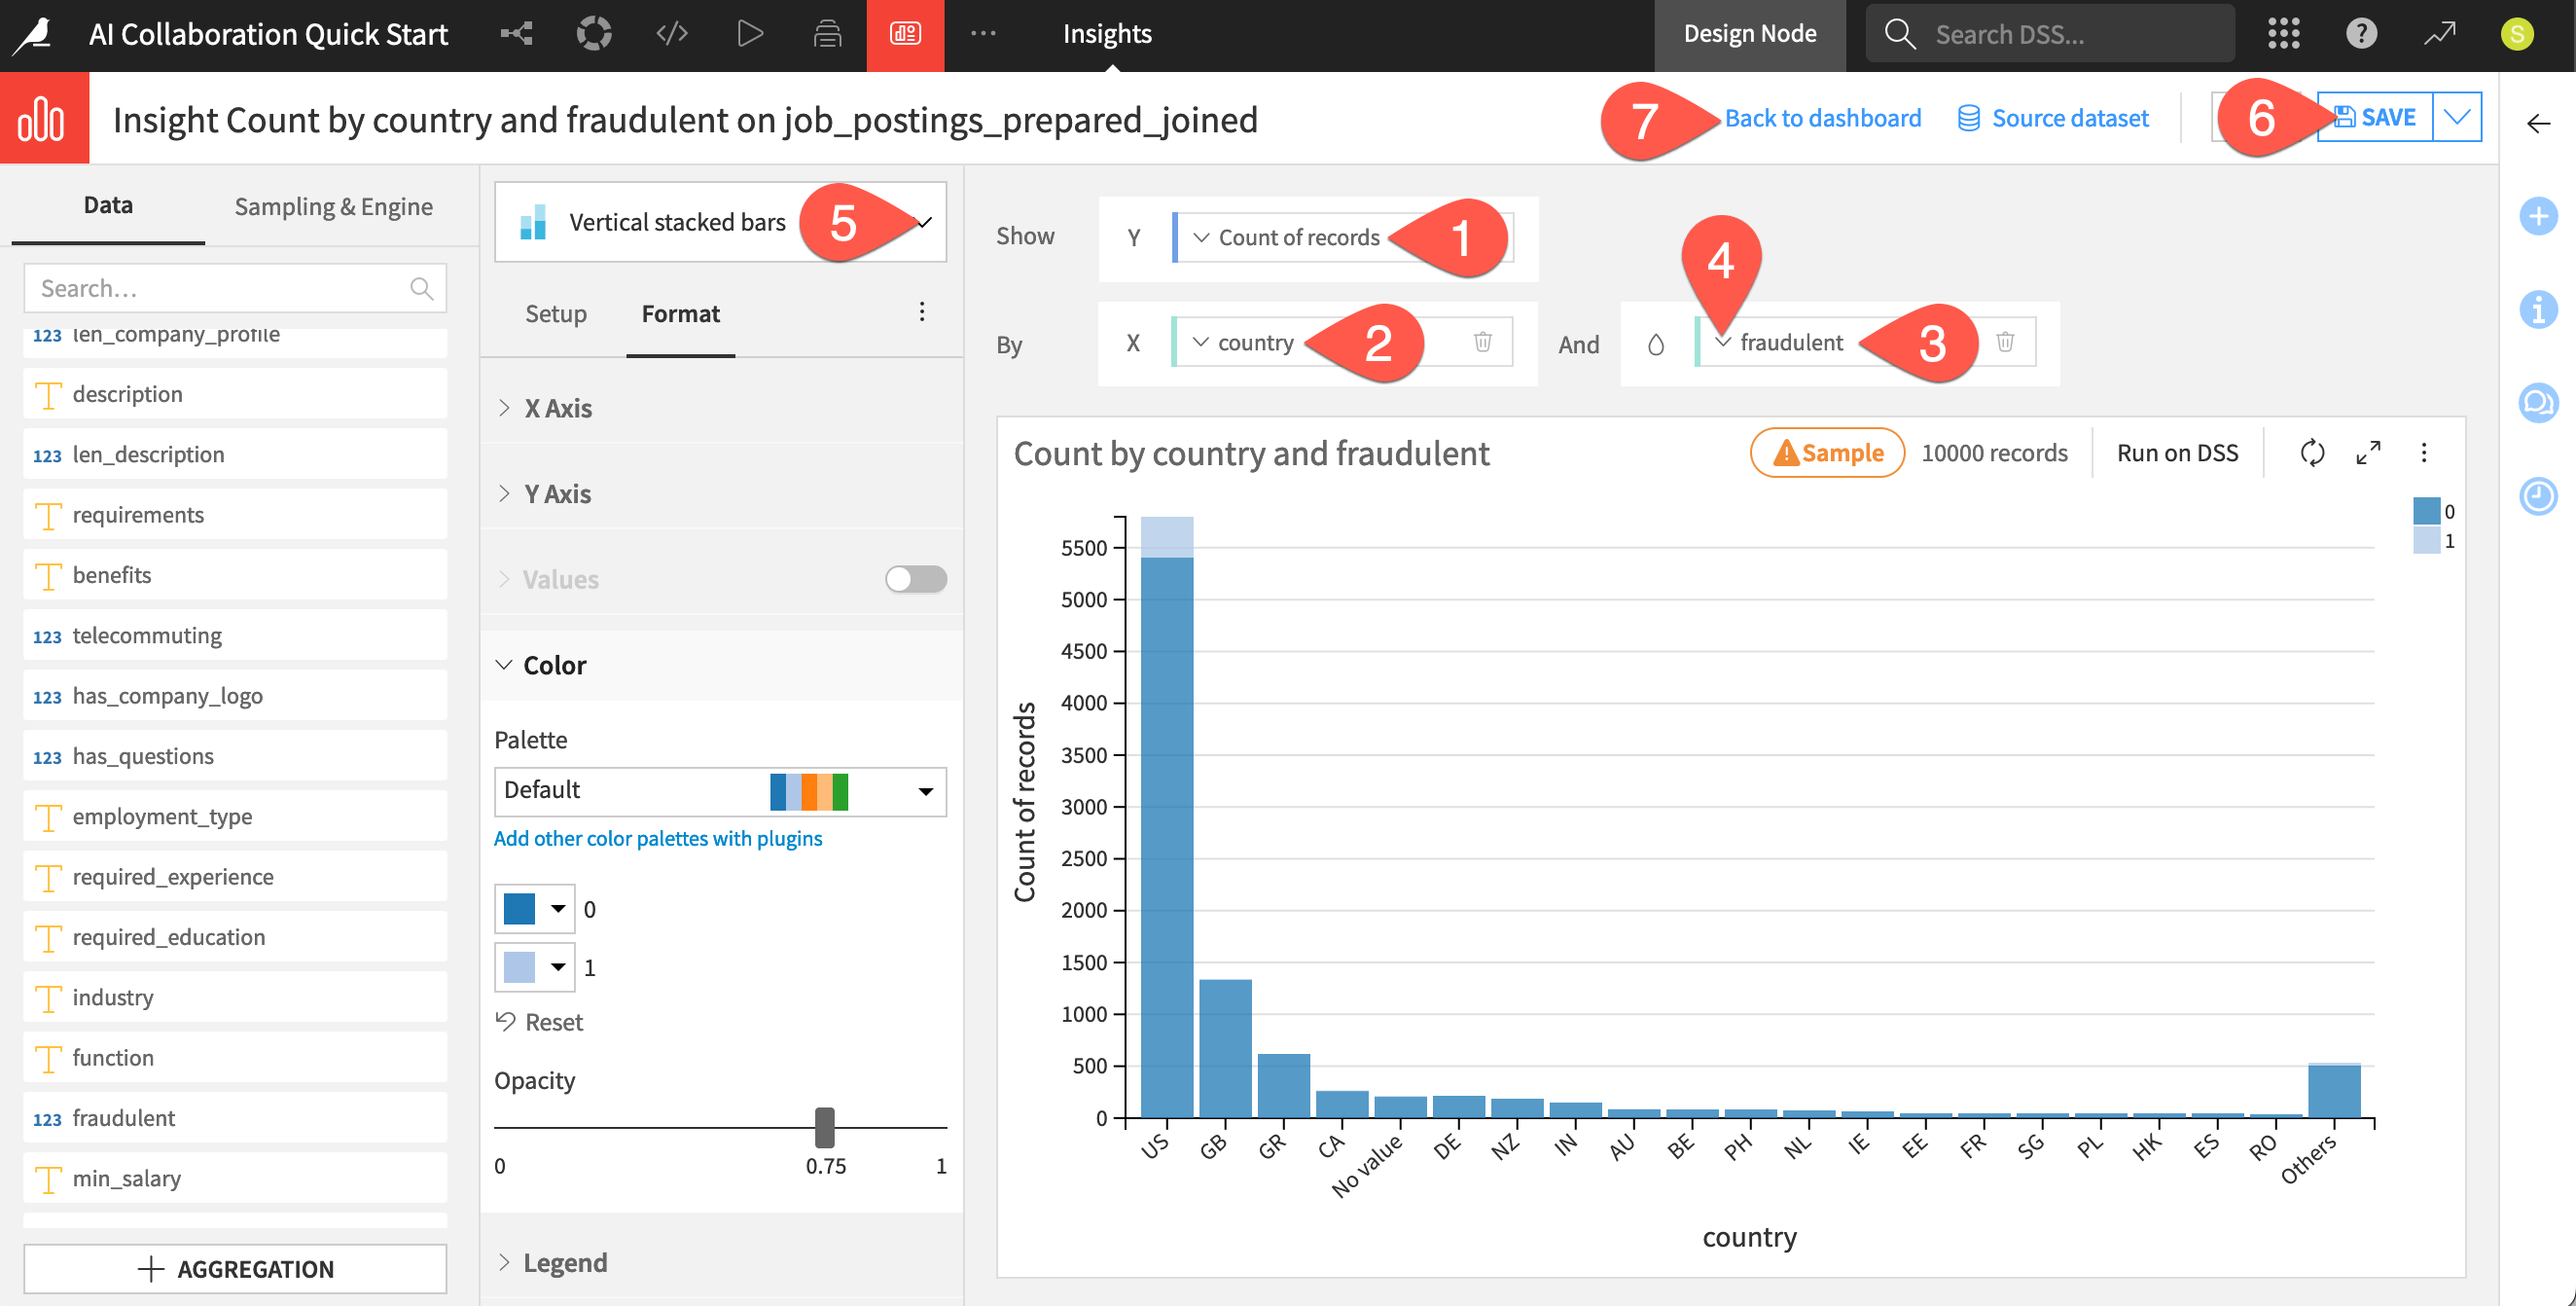
Create a chart insight showing the count of records by country and the target variable fraudulent.
From the available columns, drag Count of records to the Y axis.
Drag country to the X axis.
Drag fraudulent to the color droplet (
 ) field.
Click the vertical dots (
 ) next to fraudulent, and select Grouping (bin) > None, use raw values.
Open the chart picker dropdown, and select Vertical stacked bars.
Click Save (or use the keyboard shortcut
Cmd/Ctrl+S).Click Back to dashboard. You’ll see your new chart there.
Important
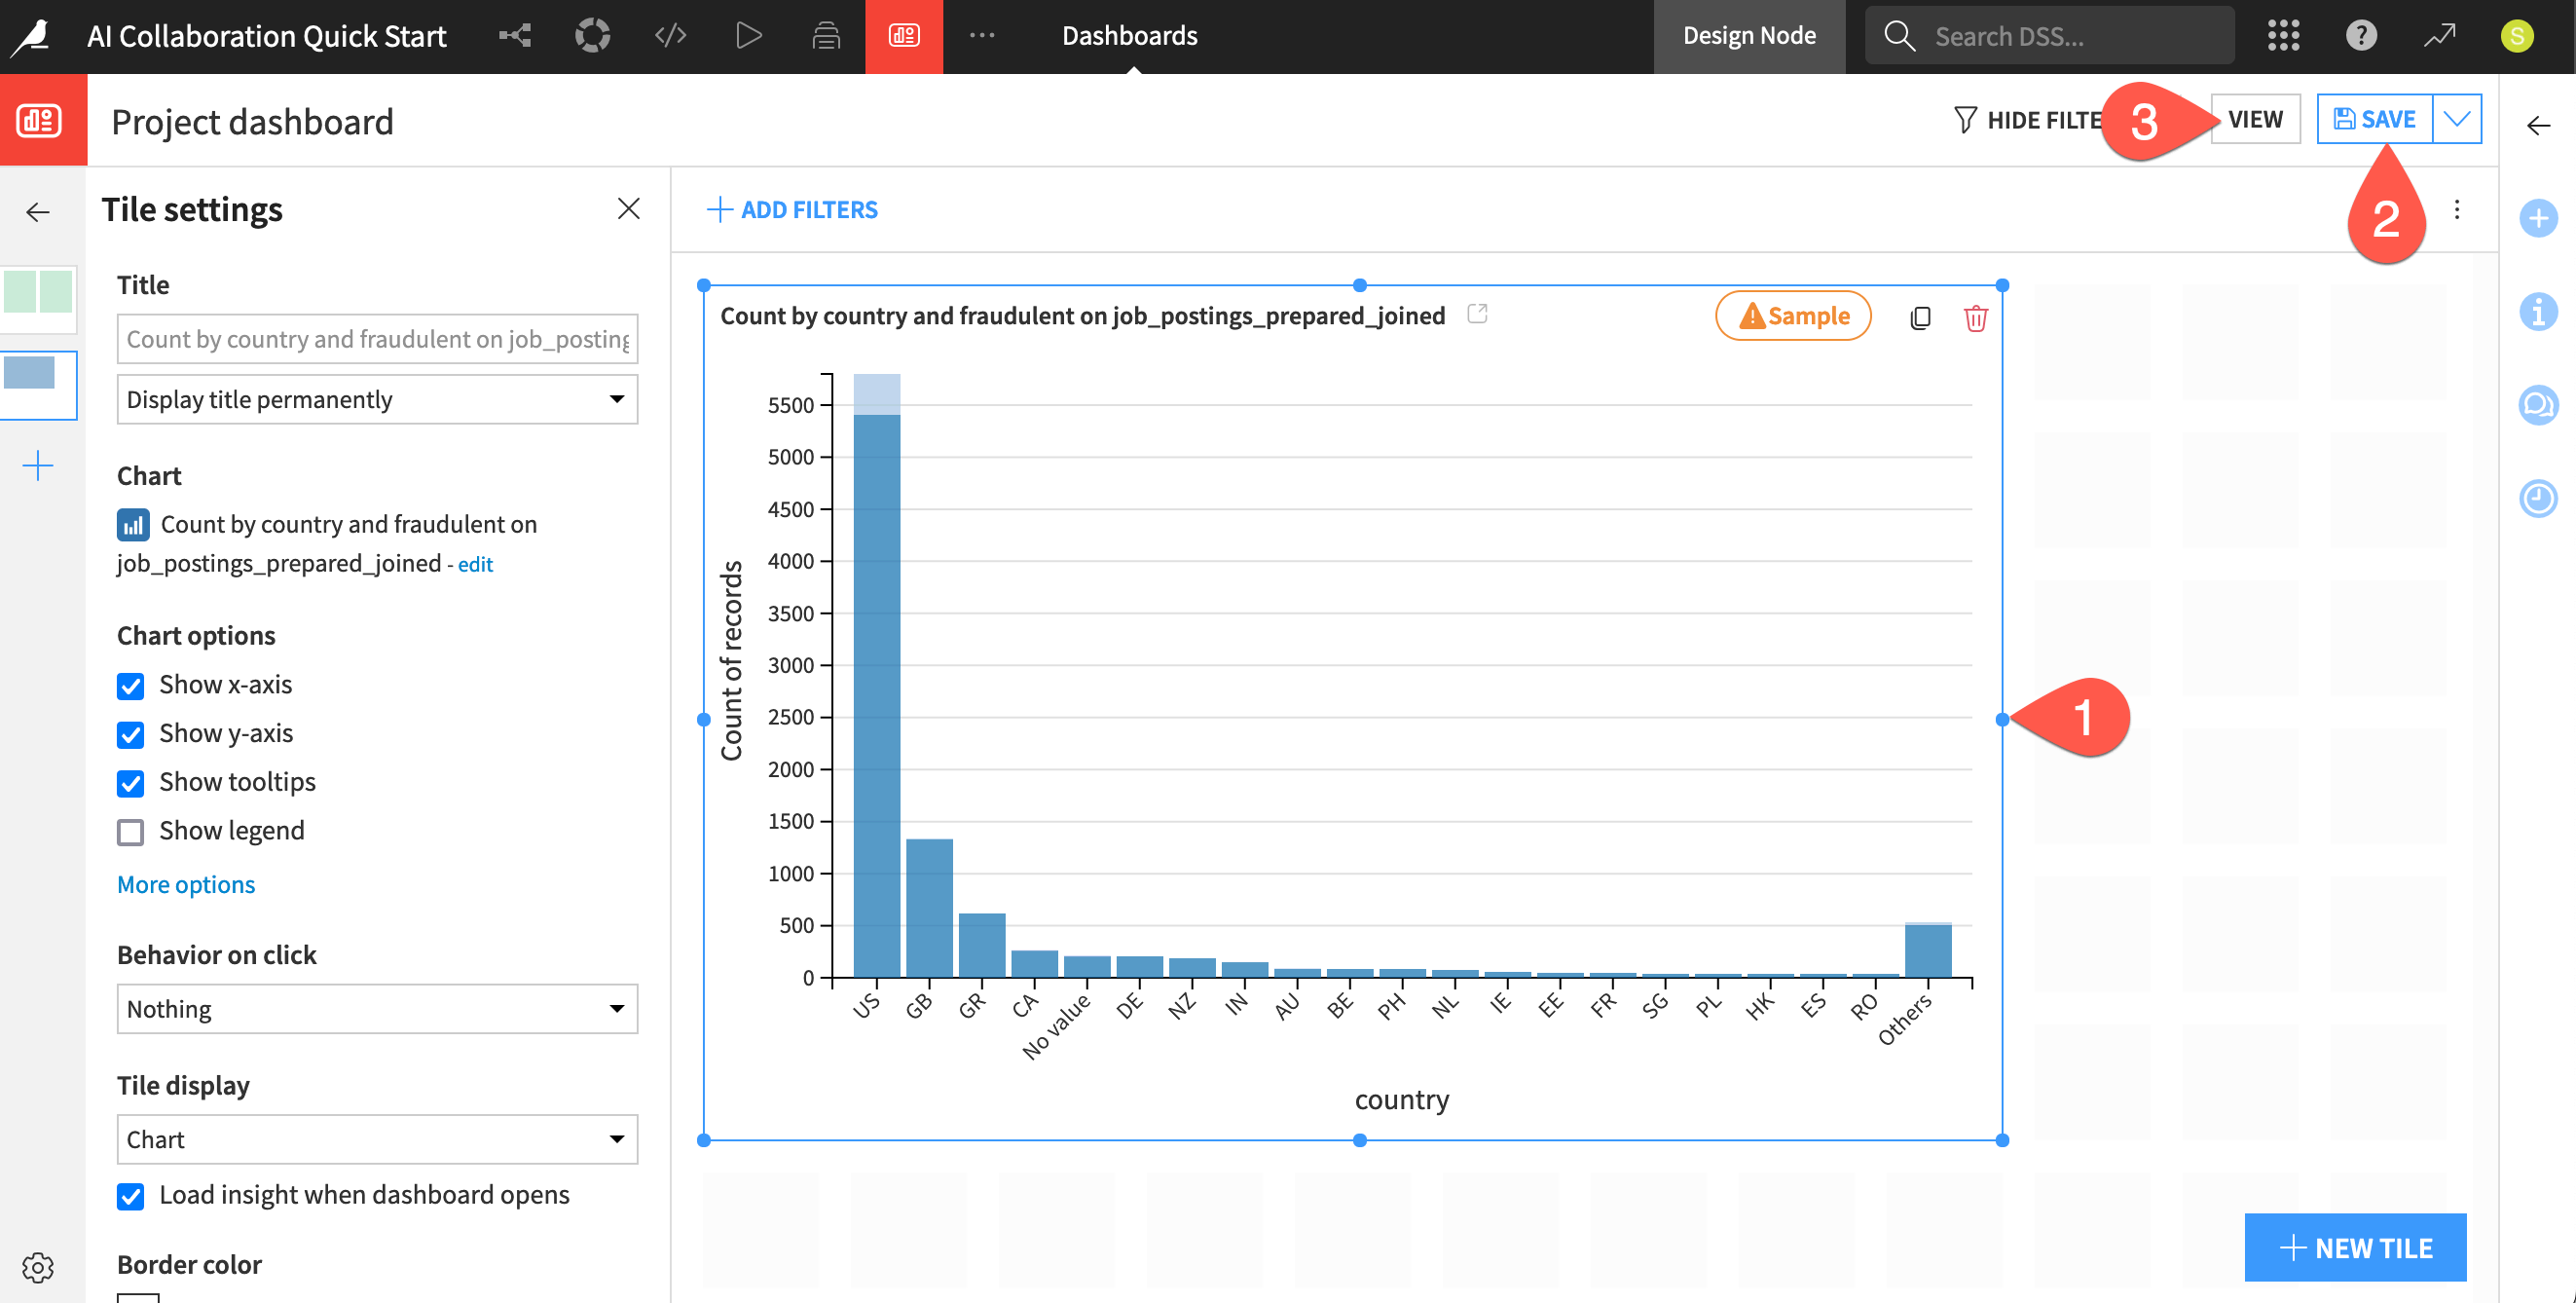
The top of the chart indicates that the current insight is calculated on a sample of the data. Sampling ensures you can work interactively on large datasets. You can adjust this in the Sampling & Engine tab.
Now adjust the size of the insight on the dashboard page.
Click on the chart tile, and drag the corners to a larger size.
Click Save (or use the keyboard shortcut
Cmd/Ctrl+S).Click View to see the current state of the dashboard.
Tip
Feel free to add more tile insights to this dashboard or learn more about dashboards in the Knowledge Base.