Tutorial | A/B testing for event promotion (AB test calculator plugin)#
Note
This content was last updated using Dataiku 11.
Dataiku’s A/B testing capabilities introduce an easy and standardized way to carry out marketing experiments. A/B testing is a reliable method to compare two variants of a campaign. Its core idea is simple: You split your audience into two groups, expose them to two different variants, and find out which variant is best. Yet, its implementation is usually tedious. Follow along to find out how to leverage Dataiku to A/B test your marketing campaigns smoothly!
Business case#
A music group is about to reunite for an exclusive concert. To make sure their fan base will be there, they asked their marketing analyst, Victoria, to send a special email to invite their biggest fans. Victoria isn’t certain of the ideal send time for this email, so she wants to set up an experiment to compare the different send times and learn best practices for future concert promotion.
She has already selected the two send times that she wishes to compare: 9 AM, the A variant and 2 PM, the B variant. Her A and B campaigns should be the same, except for the chosen variation. She picked a relevant metric or key performance indicator (KPI) to measure the performance of the campaign. In this case, it makes sense to compare send times with a time-dependent metric, such as the click-through rate (CTR).
Workflow overview#
The workflow consists of two major steps:
The design of the experiment. Compute what’s the minimum audience size that you need to get significant results and split your audience into two groups.
The analysis of the results. Retrieve your results into Dataiku and determine the outcome of the experiment.
Prerequisites#
The A/B test calculator plugin is installed on the instance.
Prepare the experiment on Dataiku’s visual interface#
First, create a project and import this list of email addresses into a dataset. You can then explore this dataset and see that it contains 1000 unique email addresses.

A test on thousands of users seems more trustworthy than a test on ten users. However, how can you estimate the minimum number of users required for the A/B test? More importantly, how can you strike a balance between this statistical constraint and a limited audience size?
The minimum audience size computation is based on the types of campaigns and the guarantees expected from the test. It mainly relies on the following parameters:
A baseline success rate, the metric value that you would expect from the least performing variant.
The minimum detectable effect, the minimum difference required to determine that a variant performs better.
The statistical significance, the odds that the test finds out that the two variants are performing equally well when this is the case.
You can use Dataiku’s A/B test sample size calculator to estimate the sample size.
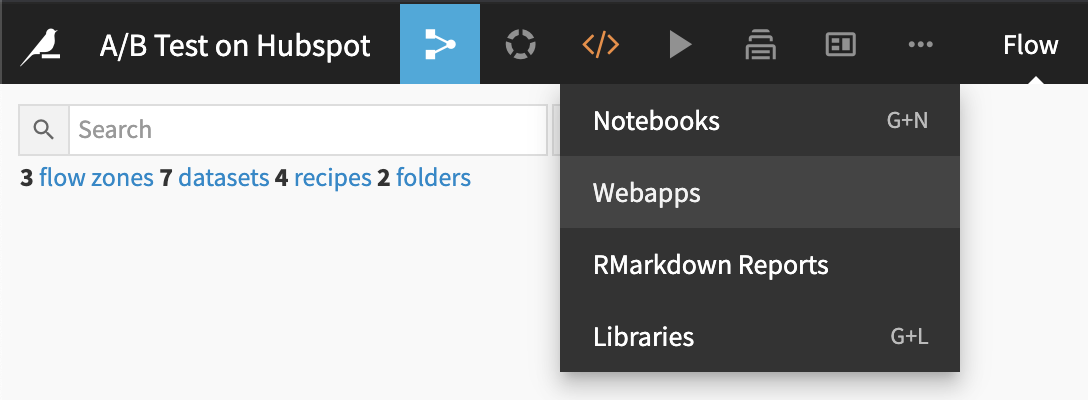
From the top navigation bar, navigate to Webapps.
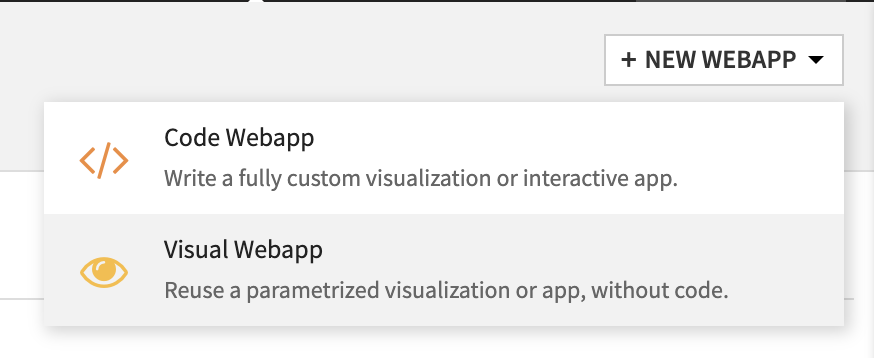
Create a visual webapp.
Select the AB test sample size calculator and name your new webapp something like Size calculator.

In the settings of the webapp, create a new folder if you want to save your parameters.
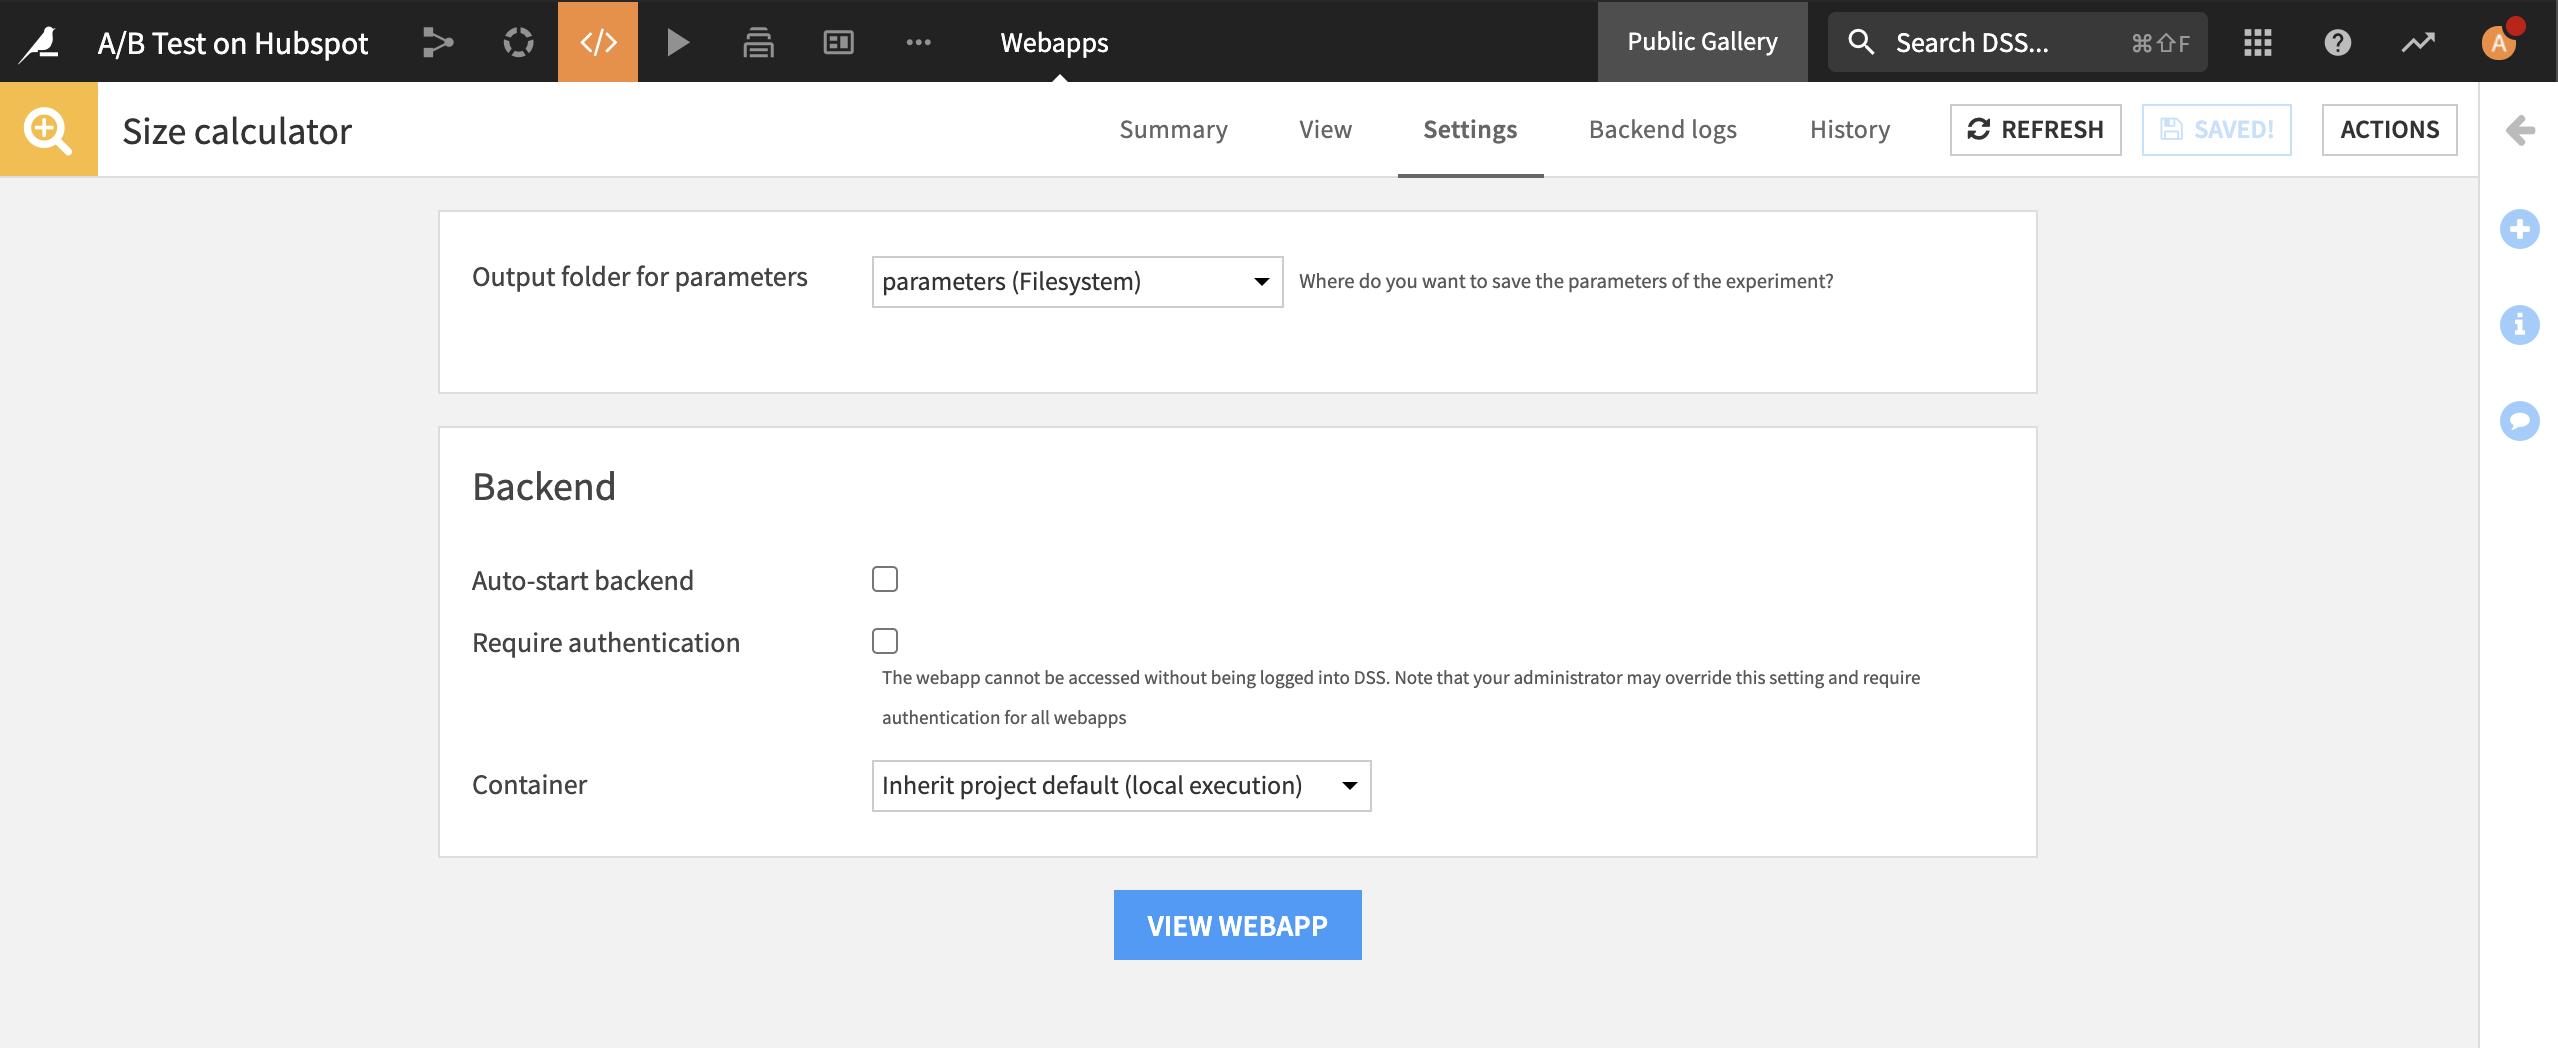
Start the webapp’s backend and go to the view tab of the webapp.
From past campaigns, Victoria already has an idea of the average success rate, which can act as a reasonable estimate of the baseline success rate. What’s the minimum uplift that she would expect from a “better” send time? It corresponds to the minimum detectable difference.
The statistical significance is traditionally set to 90% or 95%, with 90% more common for marketing experiments. Here you can see that if Victoria’s baseline CTR is 17% and she expects the CTR of a better campaign to be 7% higher, she will need to send 300 emails at 9 AM (A) and 300 emails at 2 PM (B) for a 90% significance level.
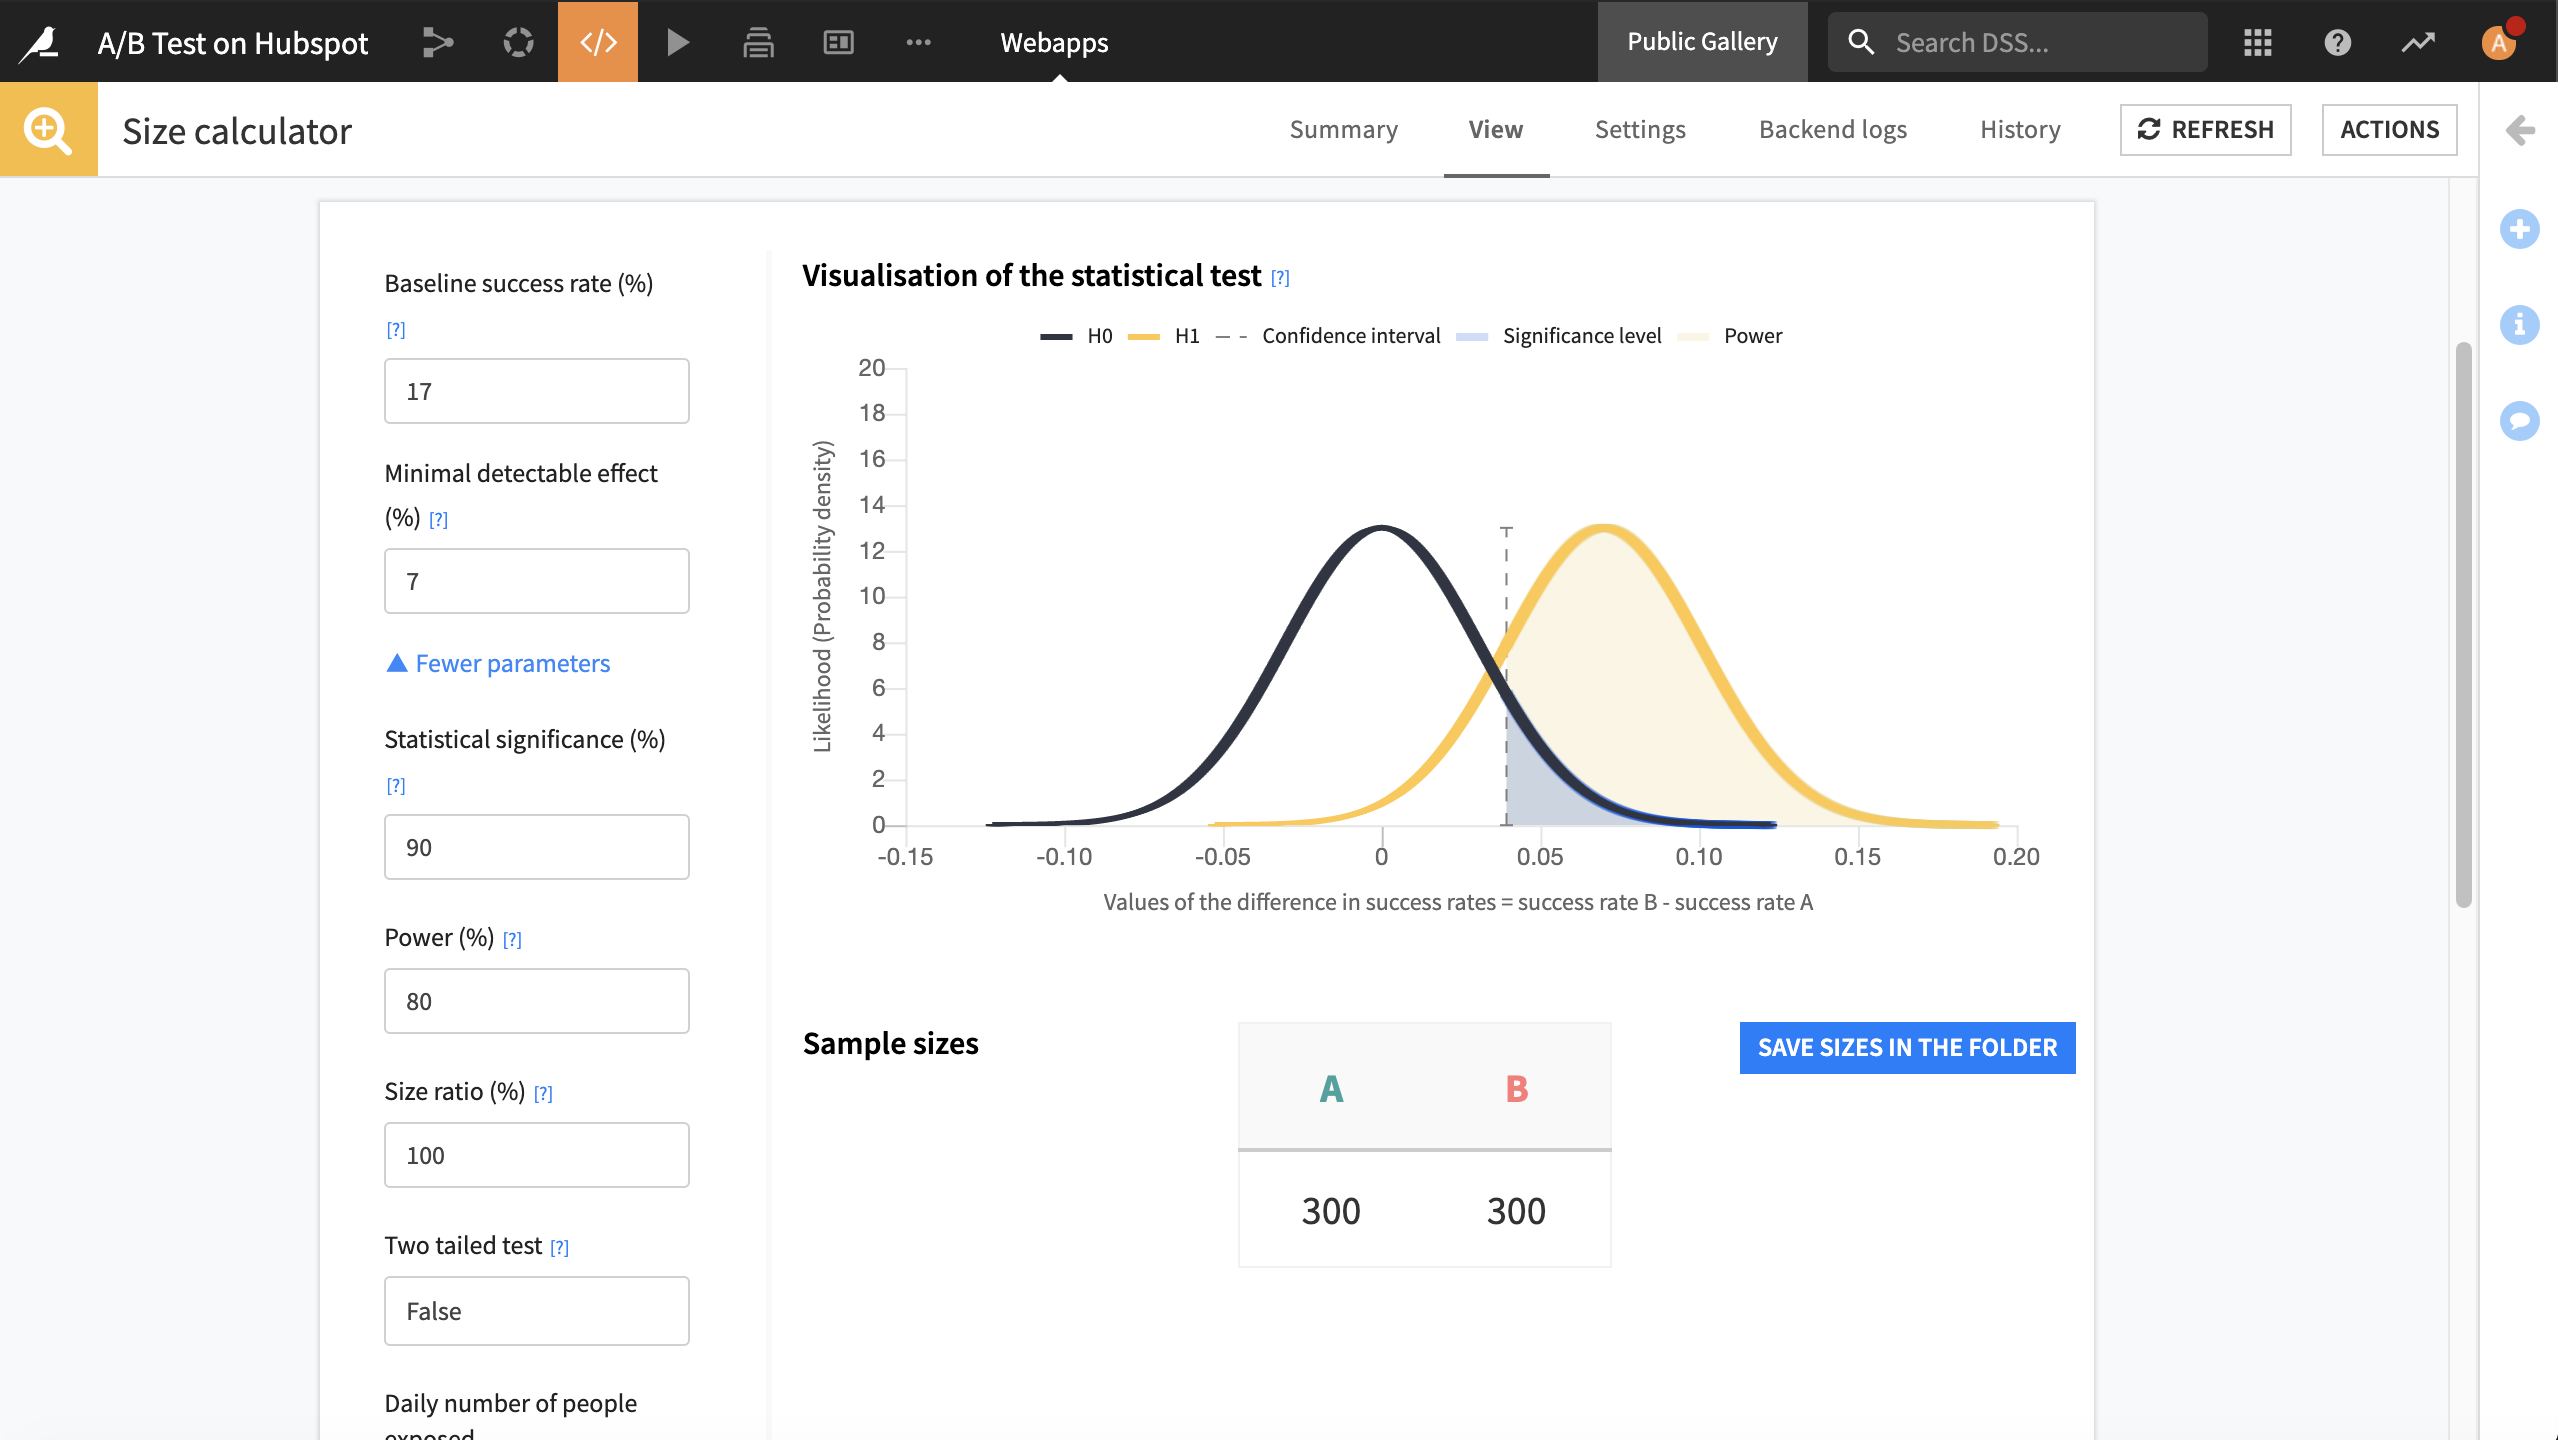
Once you obtained the relevant sample sizes, click “Save sizes in the folder to keep track of them in the folder that you selected.
It’s now clear that Victoria needs to send at least 300 emails per send time. How can you efficiently split the contact dataset while using these minimum sample sizes? Let’s see how to do that with the population Split recipe.
From the Flow, choose +New Recipe > A/B test calculator, then select the population Split recipe:
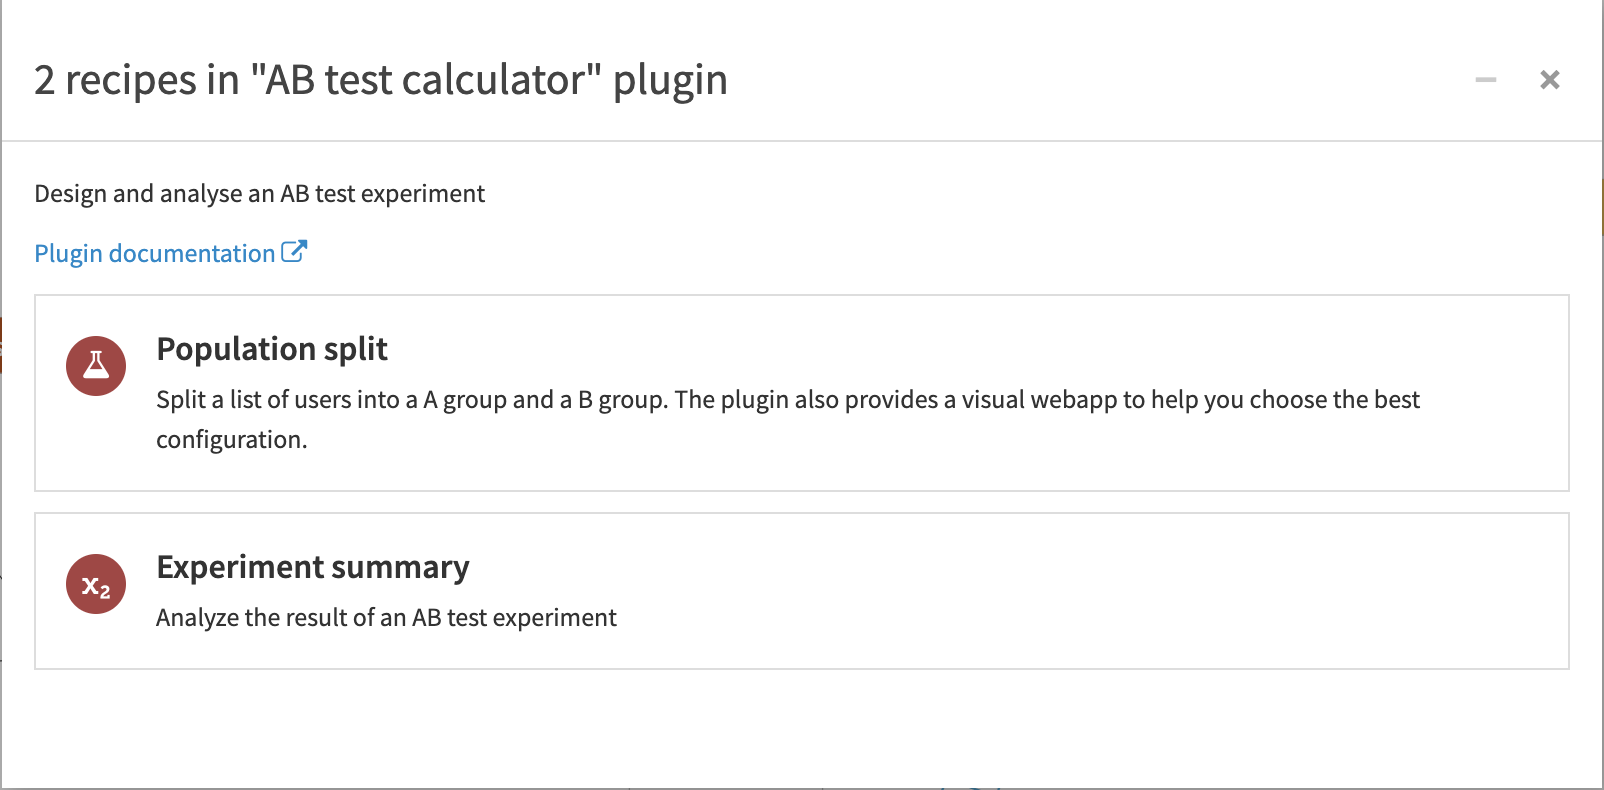
It concretely retrieves the figures computed in the A/B test sample size calculator and randomly assigns a group to each user.
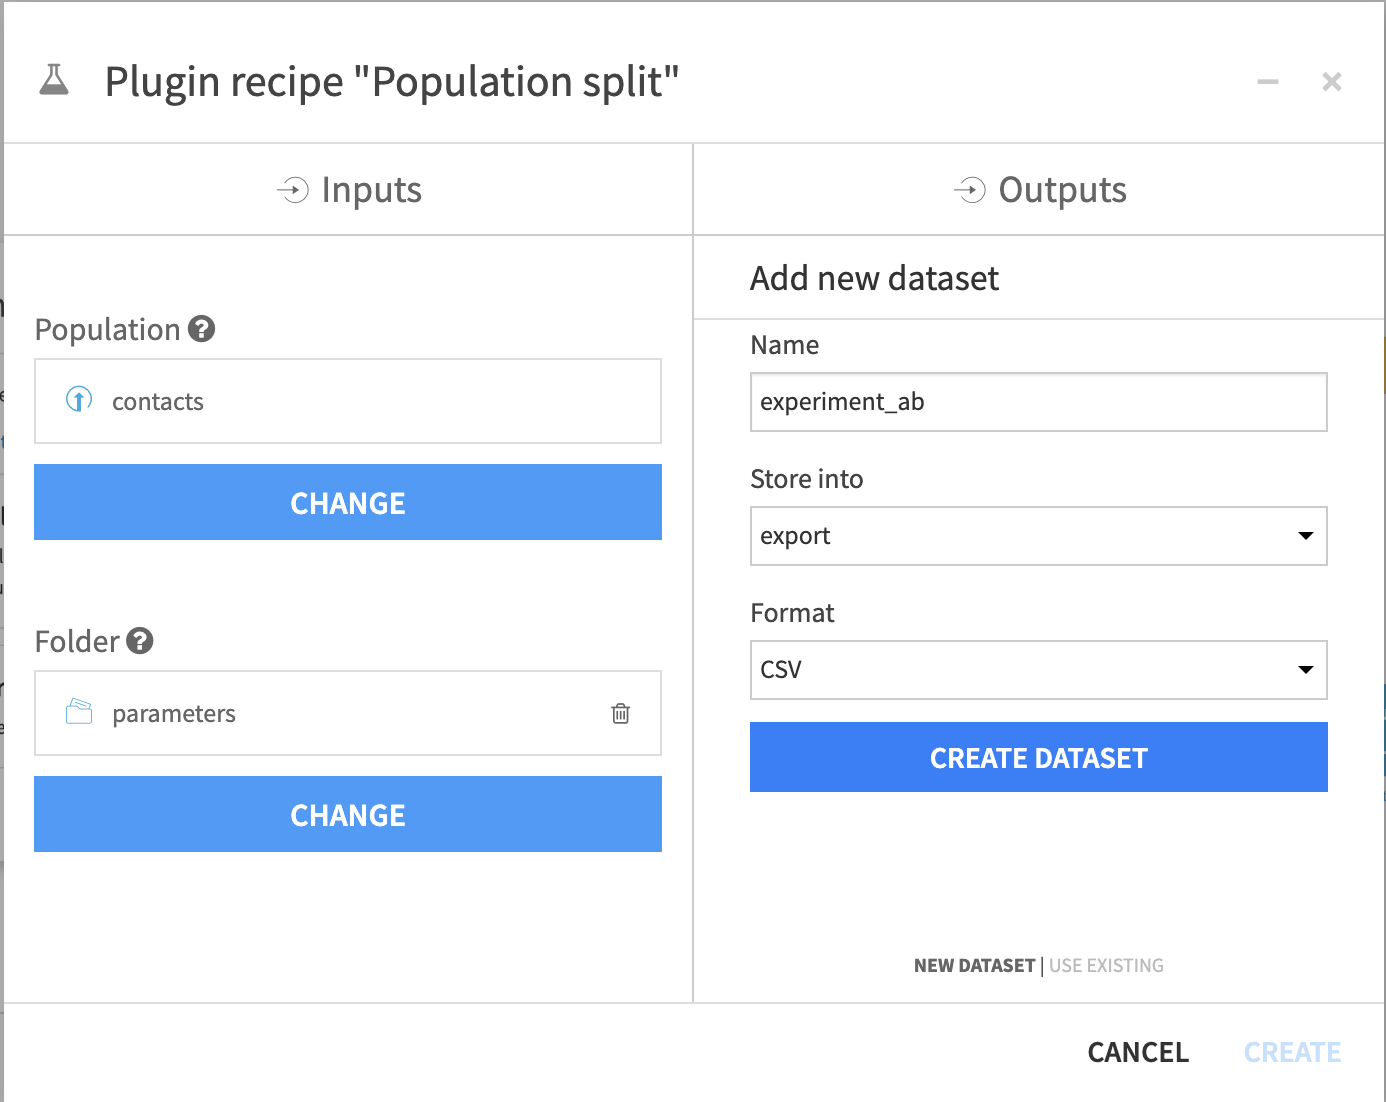
Select, as inputs, the contacts dataset and the Parameters folder, where you saved the sample sizes. Create an output dataset.
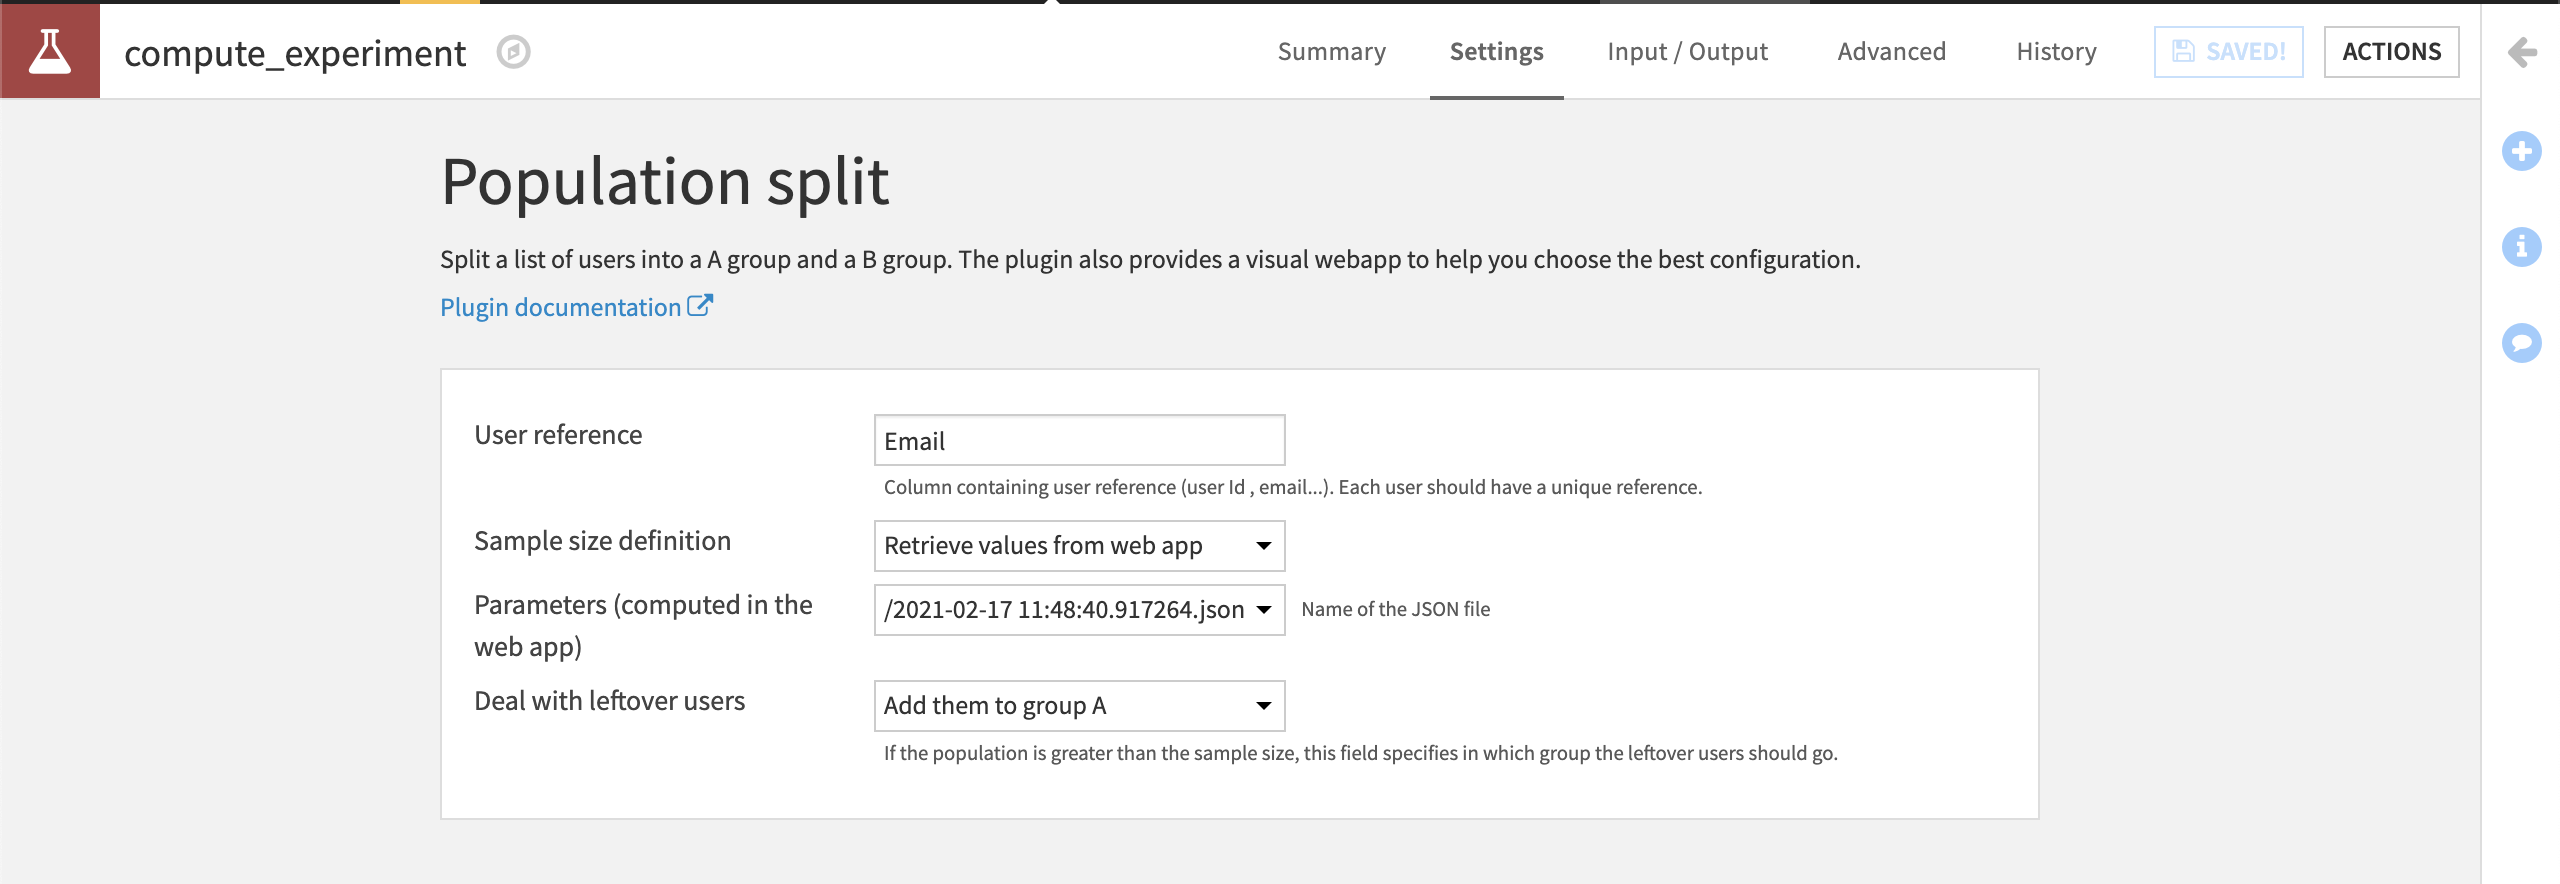
In the settings of the recipe, choose your user reference. This should uniquely identify and retrieve the names of parameters that you previously saved from the A/B test sample size calculator webapp.
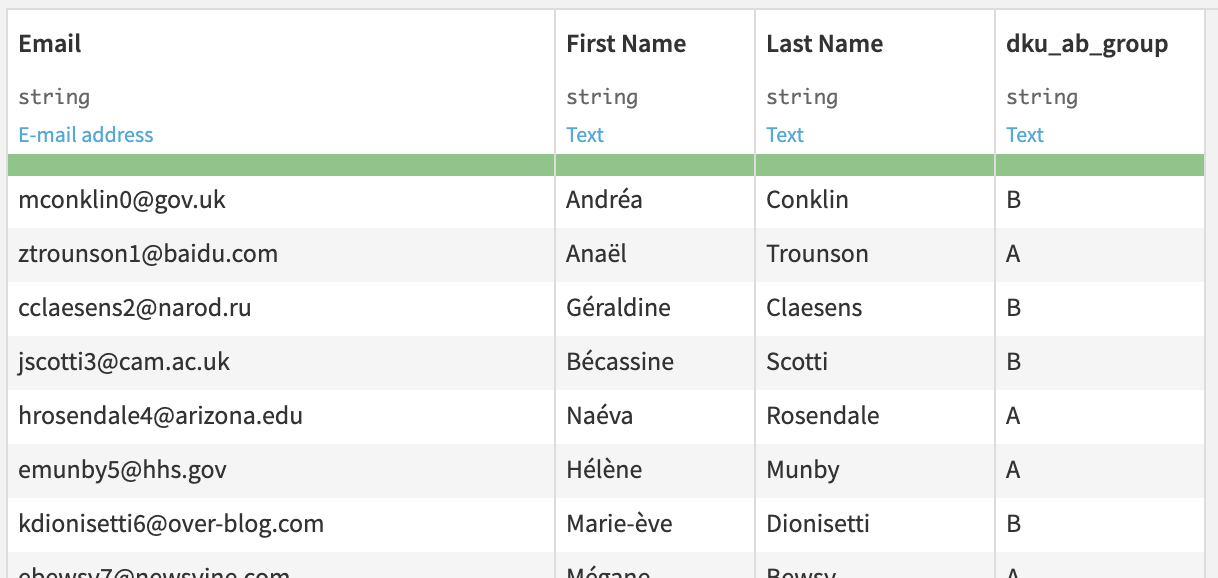
Run the recipe. See that in the output dataset, it adds a column dku_ab_group to indicate their groups, as shown below:
You are all set up to run the experiment on the platform of her liking. You may use Google Analytics for banners, or LinkedIn for social media ads.
Analyze the results in Dataiku#
Victoria finished running her experiment and it’s now time to analyze the results. To retrieve the results, import the results CSV.
This dataset contains a row for each email and a column to know if the addressee clicked.
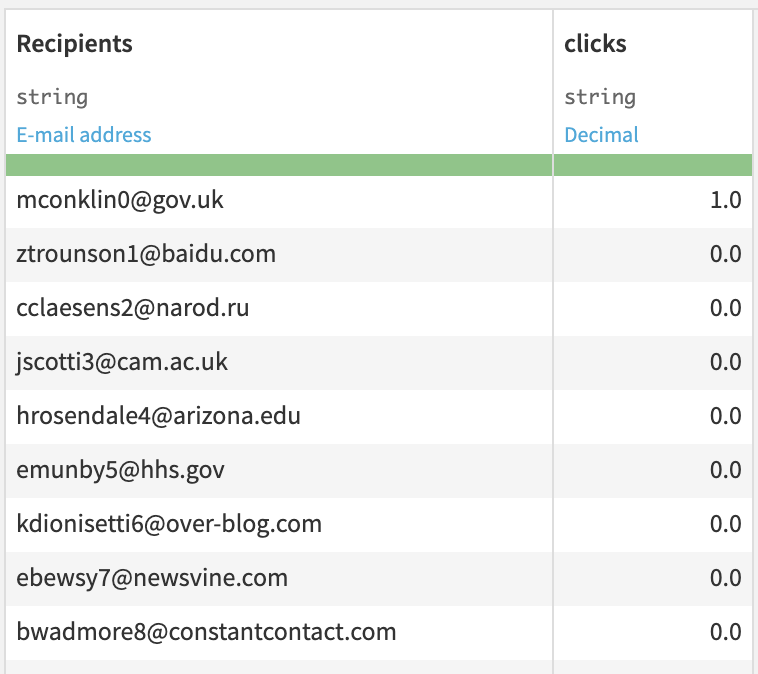
To retrieve the group of each email, use a Join recipe between this dataset and the experiment dataset that was the output dataset of the population Split recipe. The output of the join should look like the following.
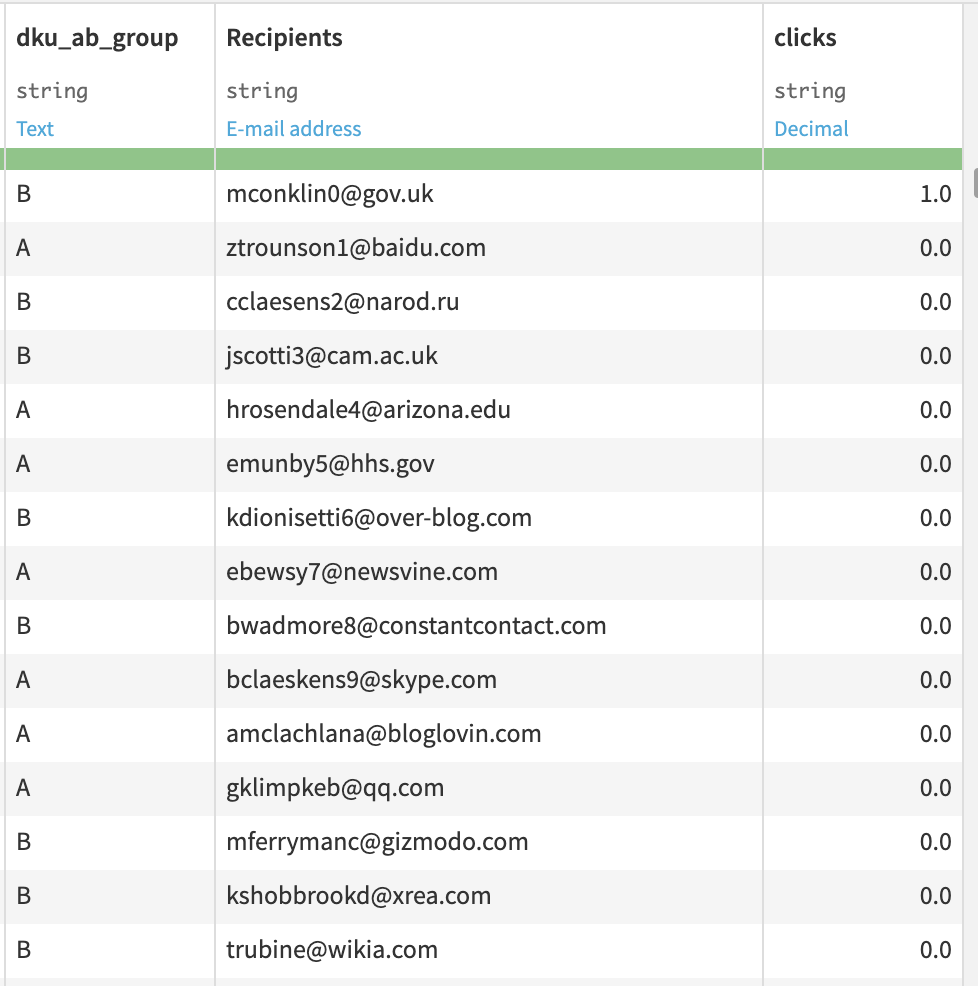
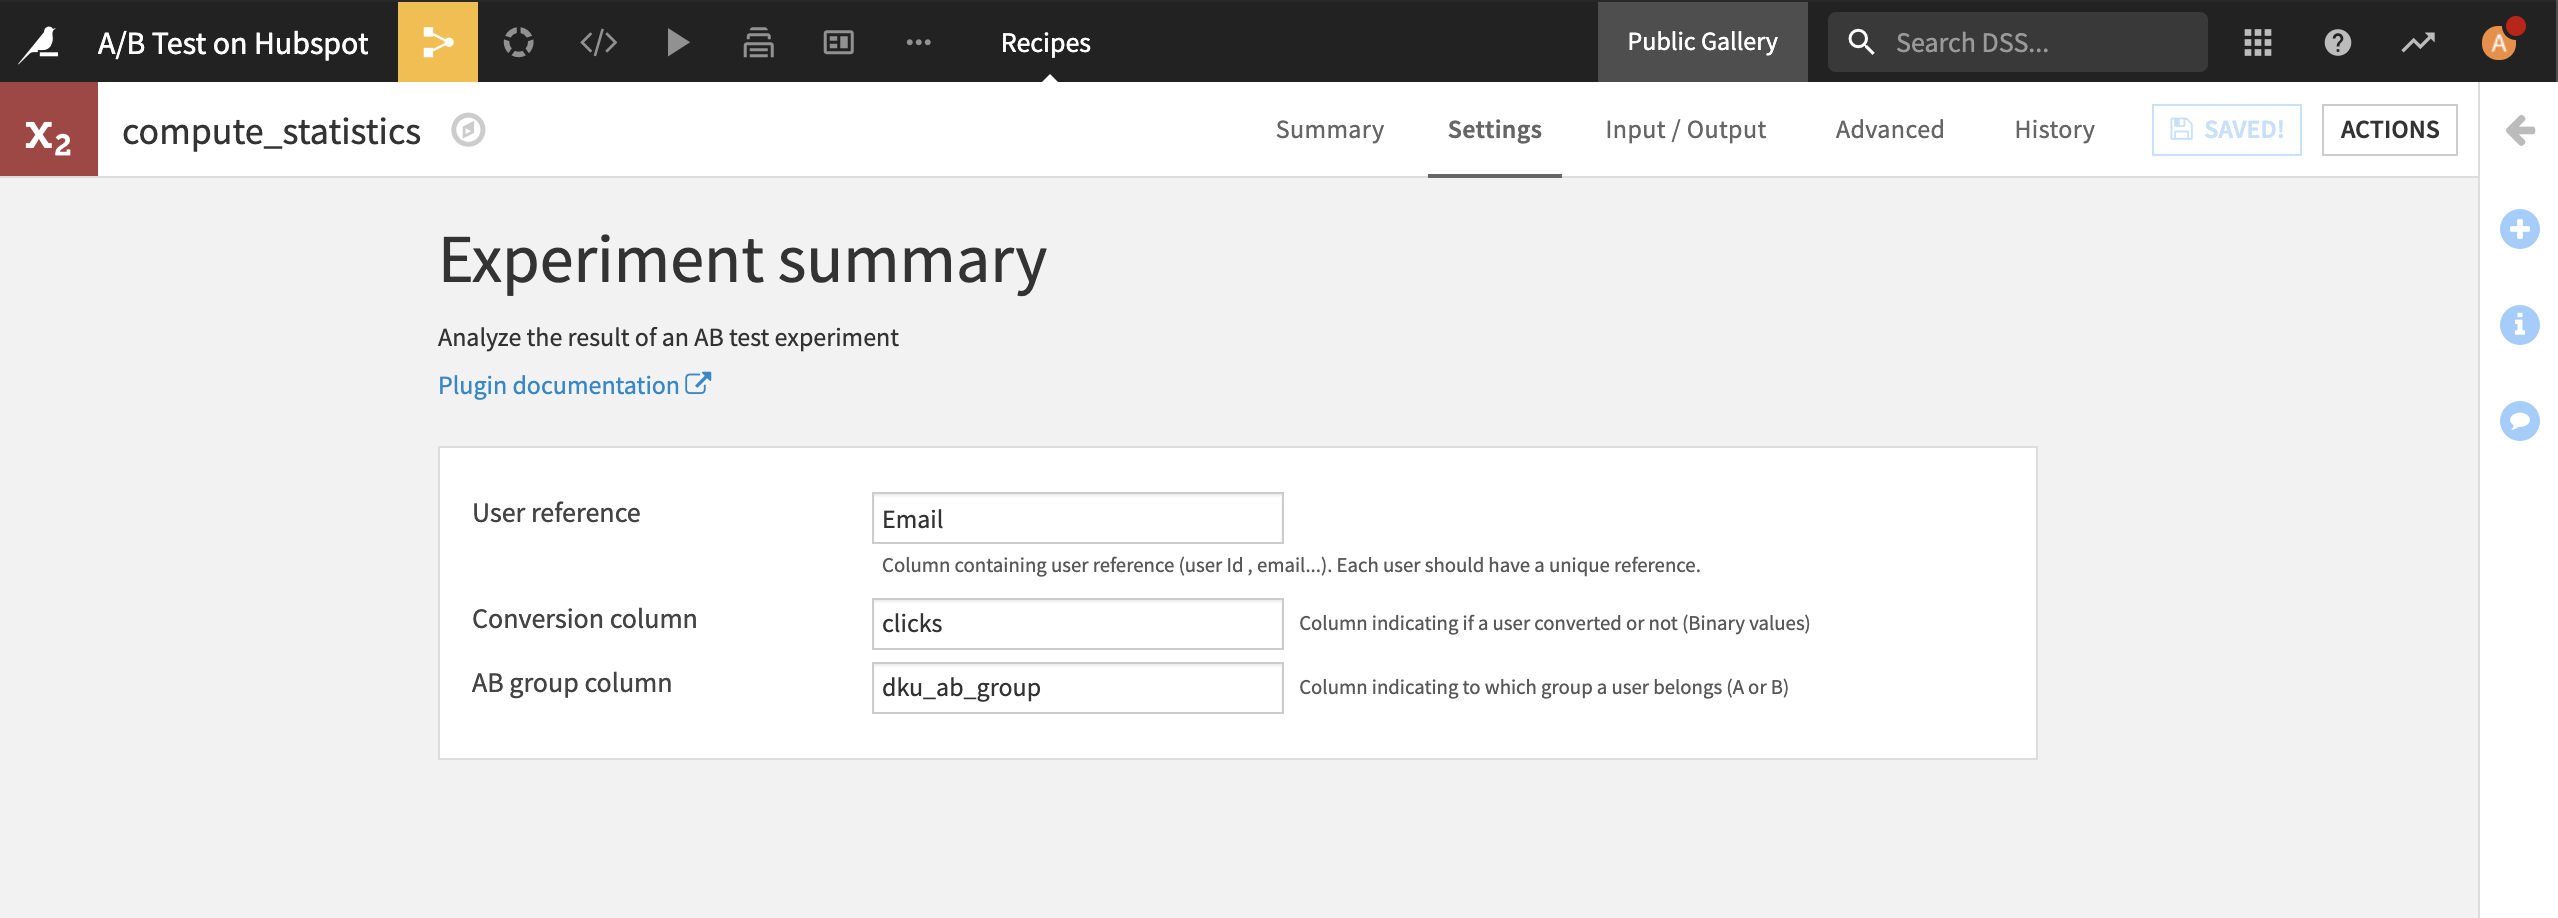
This joined dataset can now be used as the input to the Experiment Summary recipe. In the Flow, click +New Recipe > A/B test calculator, then click the Experiment Summary recipe.
Specify the relevant columns in the recipe’s Settings tab.
The output dataset contains the statistics of your experiment.
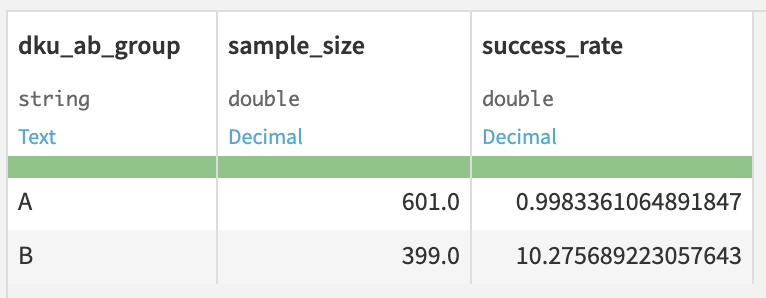
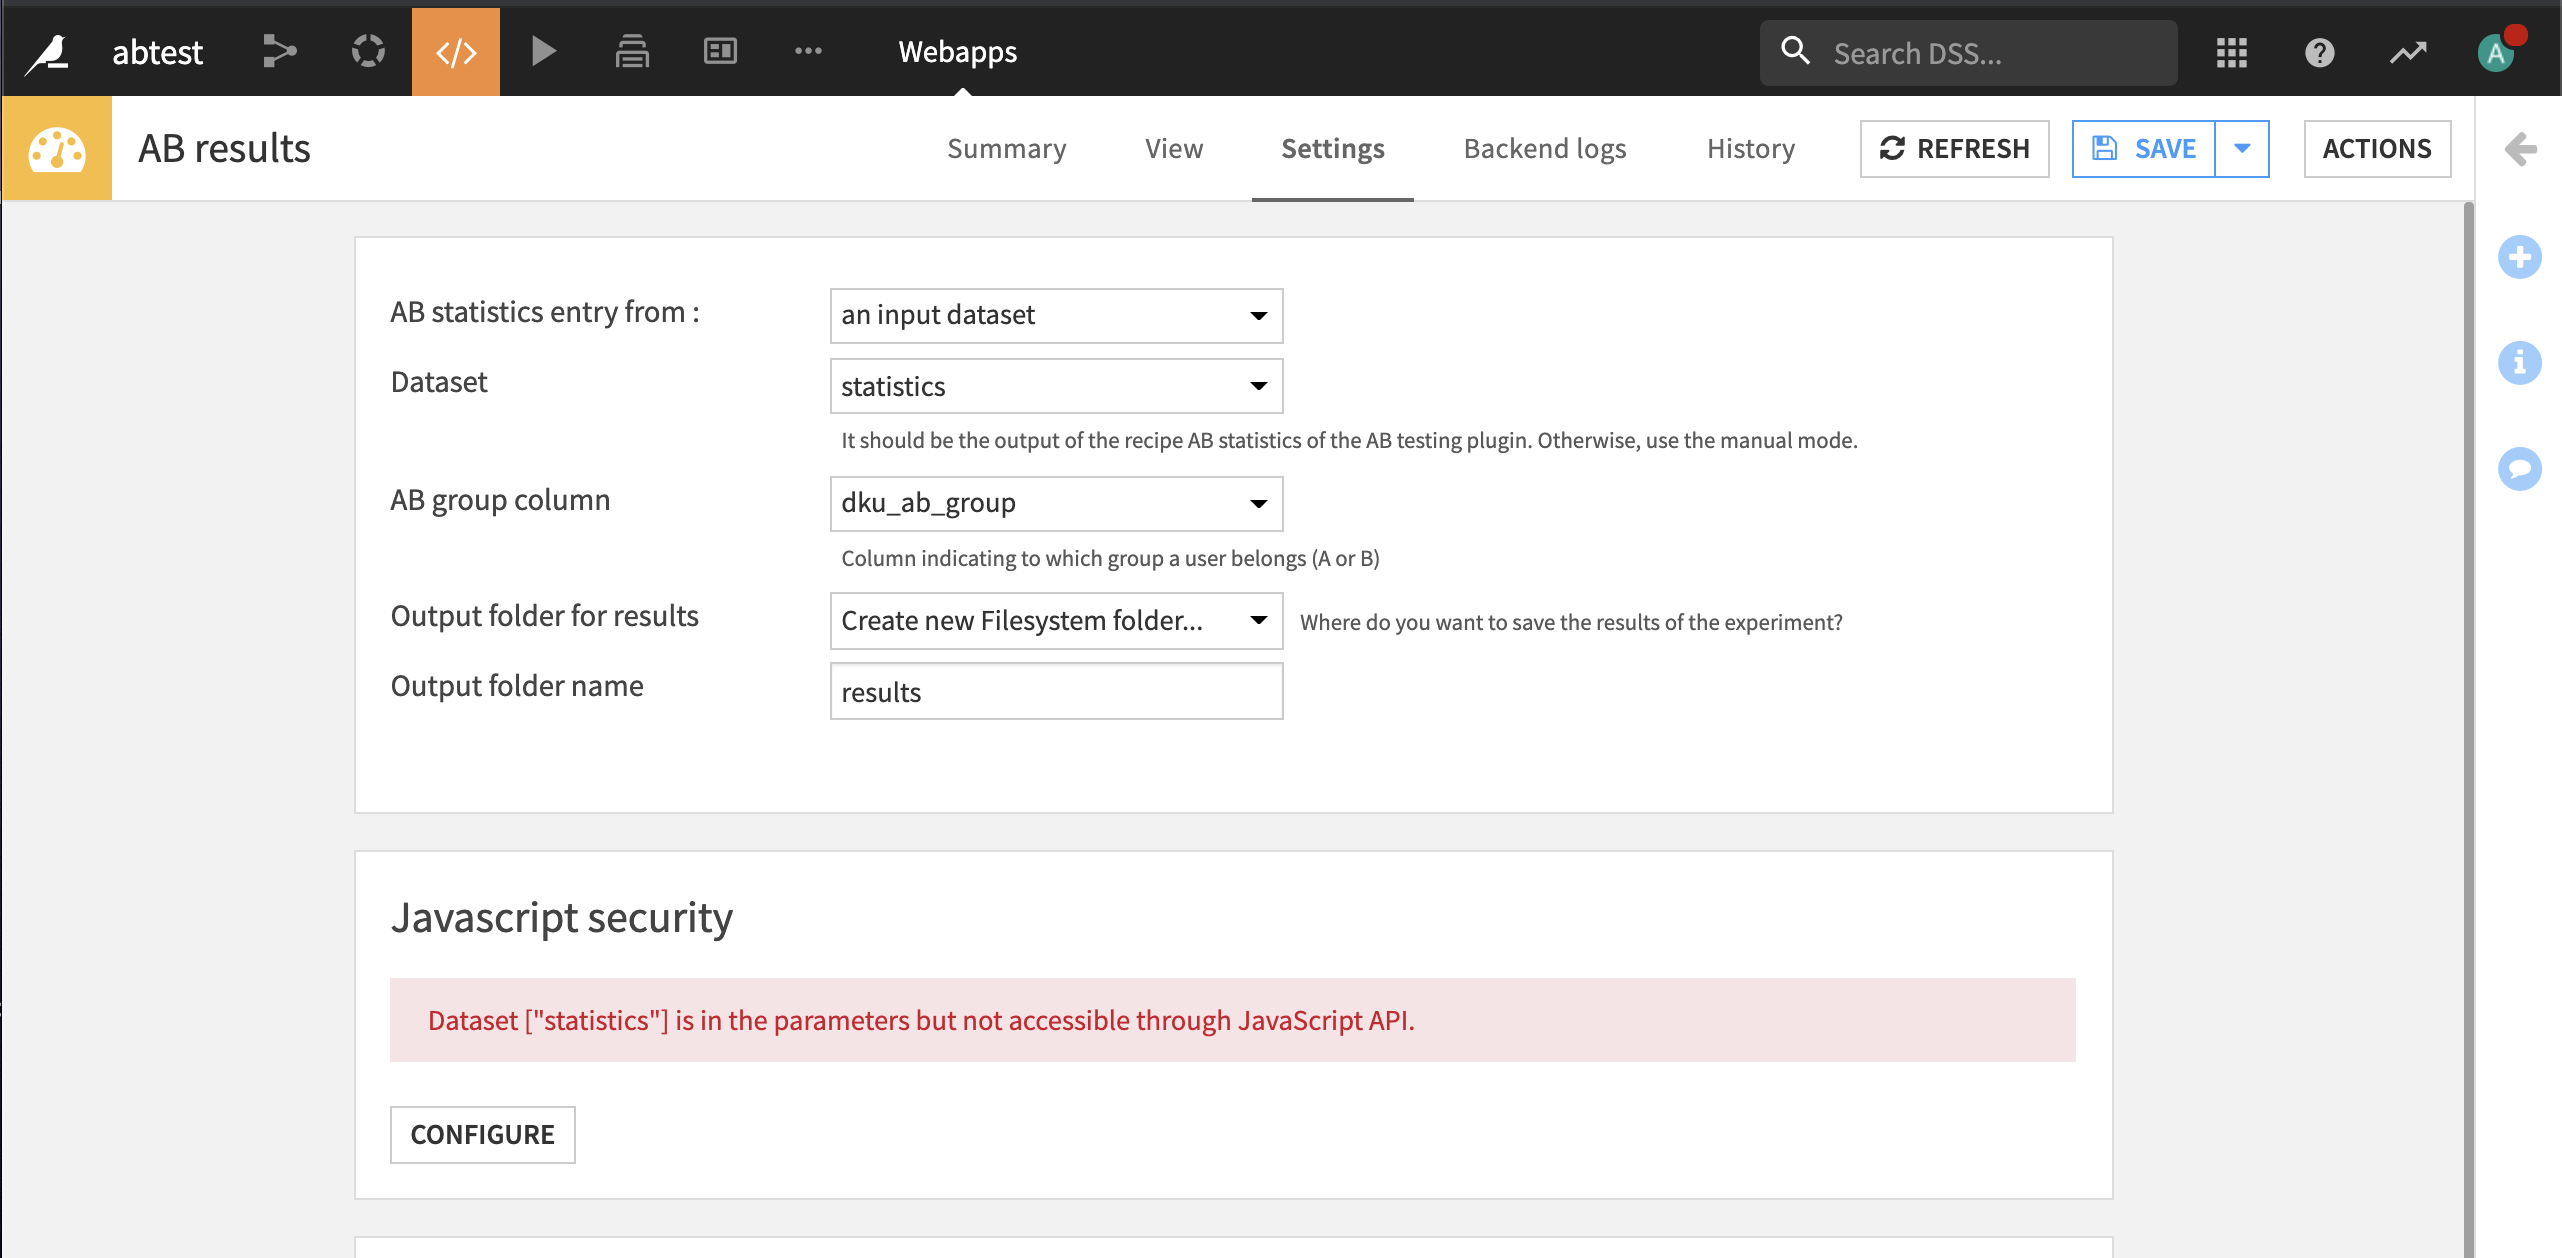
Now go back to the webapps list and create a new visual webapp. This time create an AB test results analysis webapp and name it something like `AB results. In the settings of the webapp:
Choose the statistics dataset that was the output of the Experiment Summary recipe.
Choose dku_ab_group as the AB group column.
Create a new results folder as the output.
In the JavaScript security section, you may need to give the webapp read access to the statistics dataset.
Click the View tab of the webapp to visualize the results.
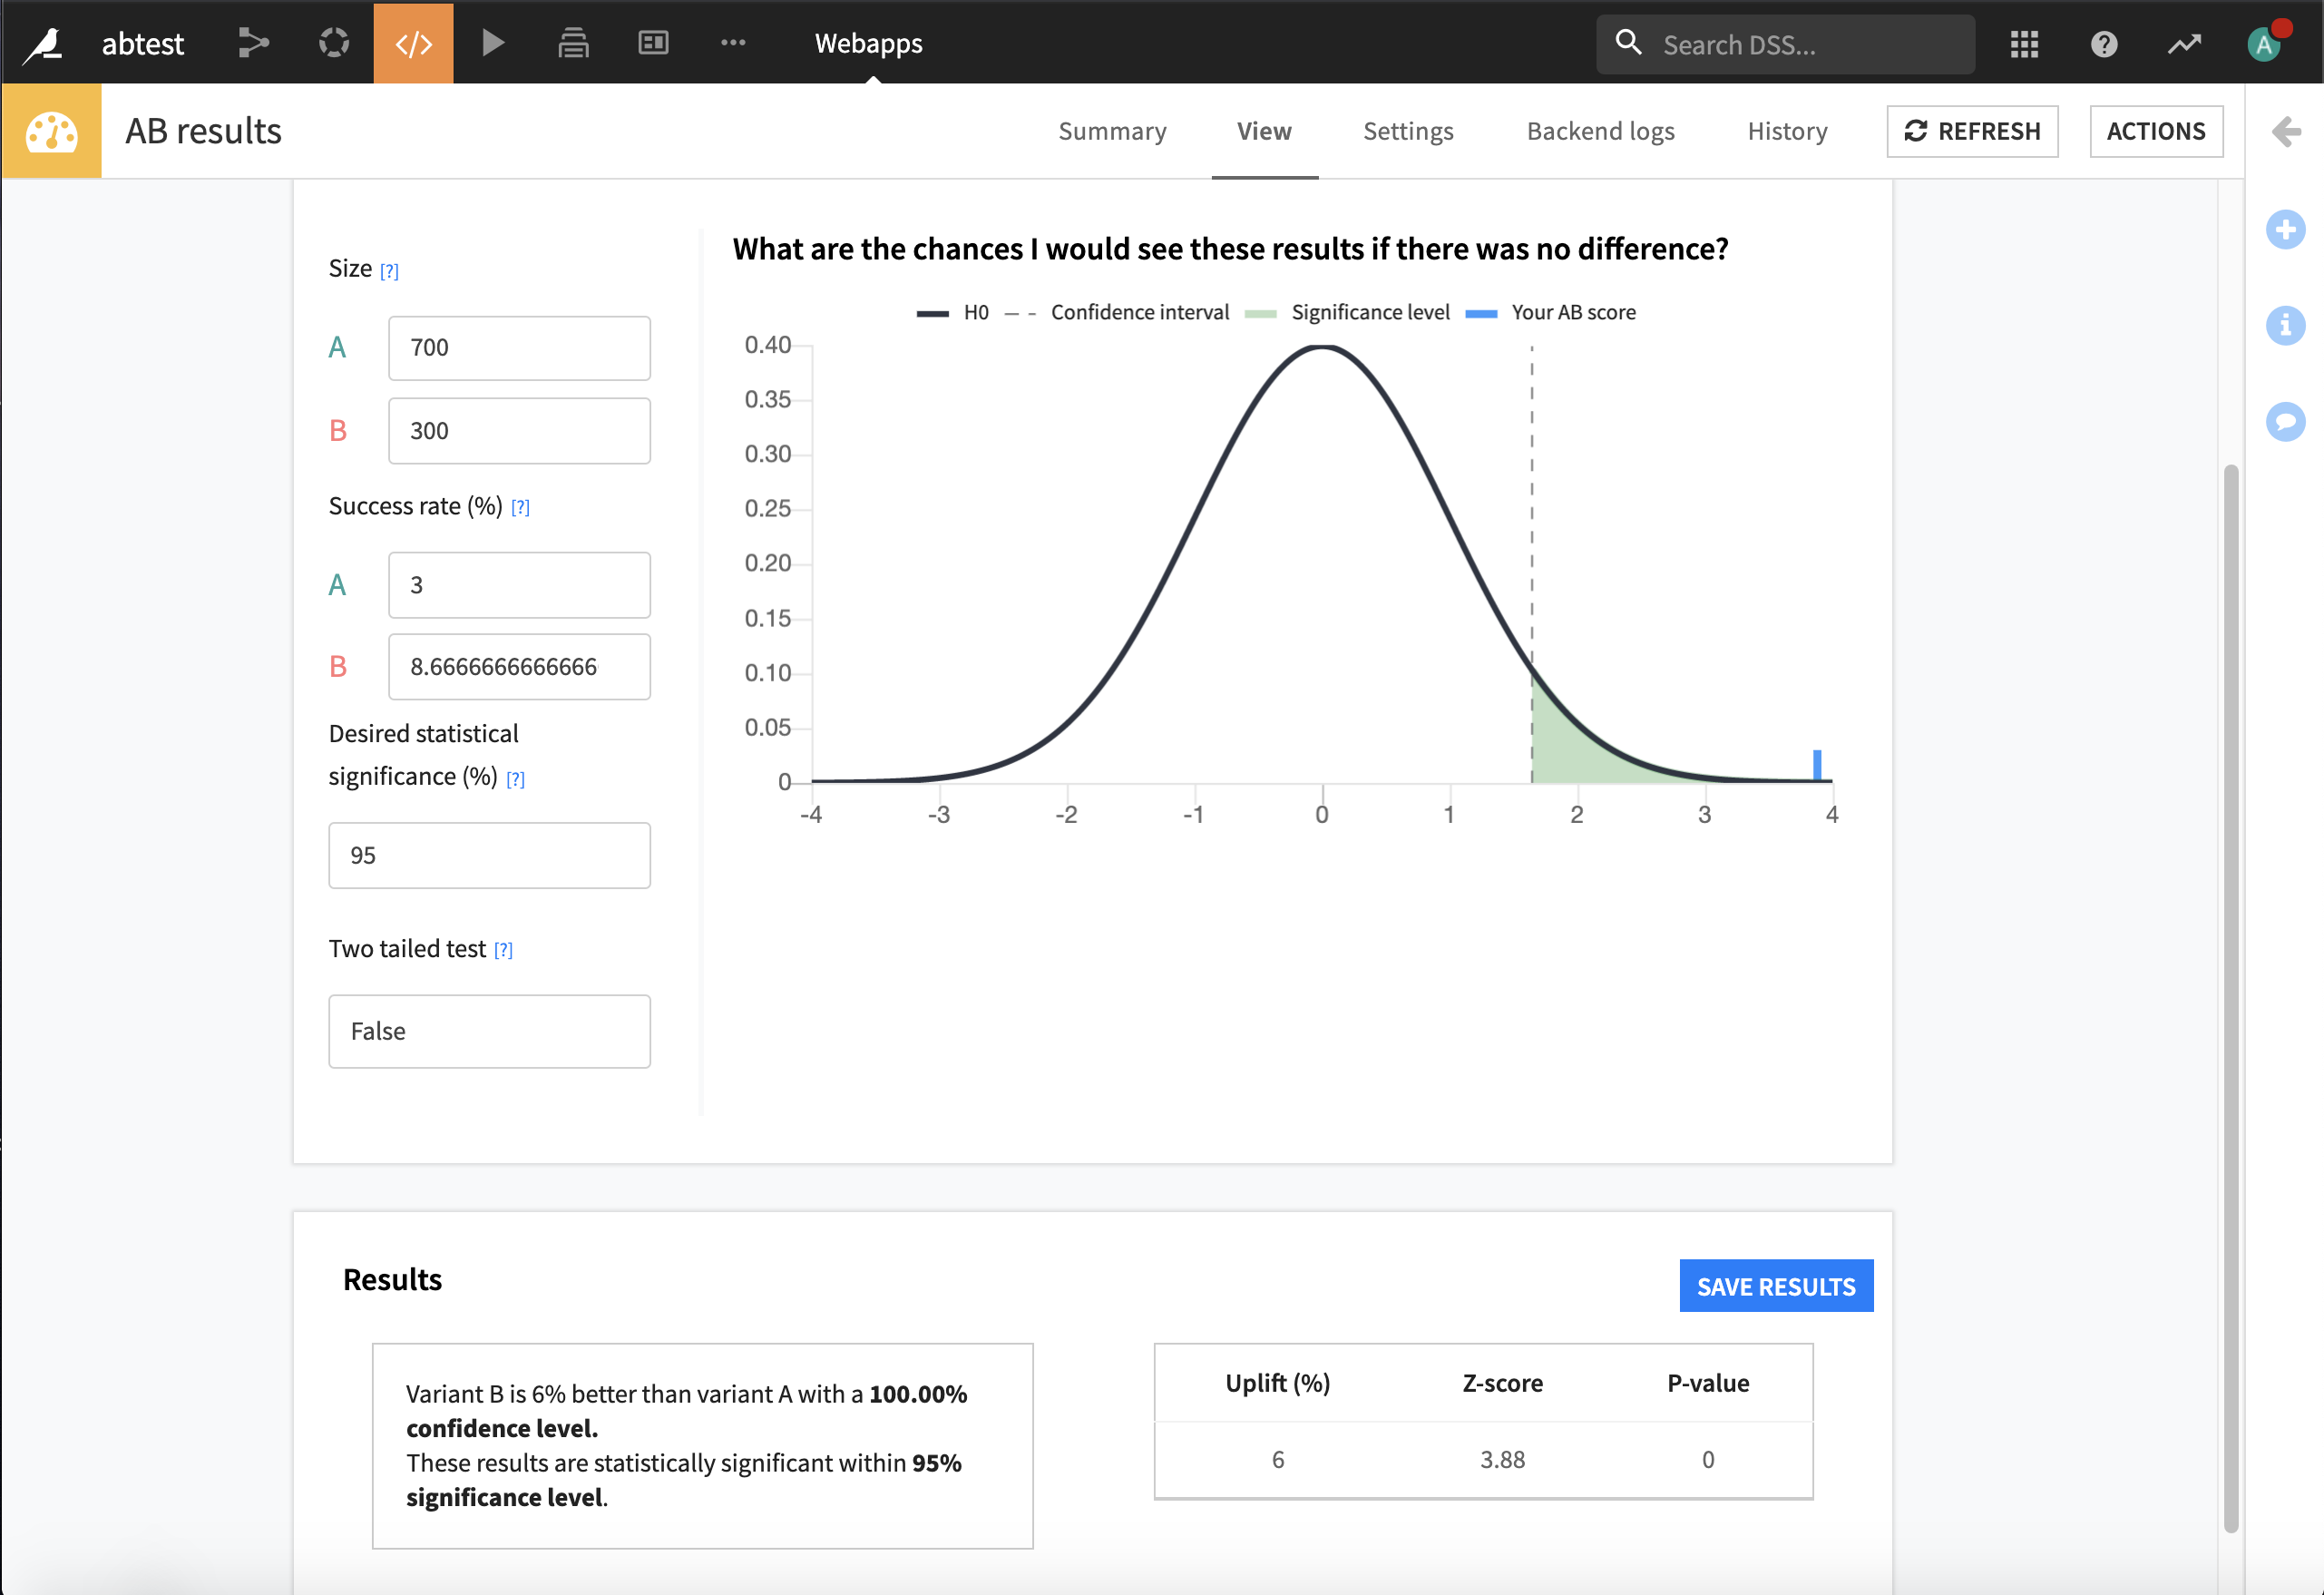
By comparing the success rates and group sizes, the webapp measures the potential uplift and the reliability level of the test. Technically, it computes the chances to observe the obtained results if there were no differences between the variants. If the chances are low, namely five or 10%, there is a clear winner! Not only is there an uplift, but the test is statistically relevant within our statistical guarantees. Even if the test is inconclusive, there is a silver lining. Knowing that a variation has a minor impact on performance is already a win. Victoria, who isn’t much of an early riser, won’t need to wake up earlier to send a campaign at 9 AM if 2 PM is just as good!
Alright, now we have seen how to perform one A/B test. Yet, what if Victoria wants to run multiple A/B tests and compare them? Dataiku is the perfect place to keep track of her experiments in a standardized way. With the webapps mentioned previously, she can save the parameters and the results of her experiments in Dataiku. Then, it’s straightforward to leverage this data in a visual analysis or a dashboard.
Key takeaways#
Victoria managed to run a reproducible A/B test and keep track of it. She learned some best practices that she will be able to apply to future campaigns. So it’s a clear win!
Your path to A/B testing is unique. It depends on your campaign types, your internal processes, and your underlying use case. After using the new A/B testing features on her campaigns, Victoria learned the following lessons:
Usually, the audience size is the main limitation. That’s why we recommend to overestimate the minimum sample size, especially when you are observing small differences.
Anything that can go wrong will go wrong. Always plan extra time for good measure.
A/B testing proves to be an efficient and versatile framework to compare marketing campaigns, websites, drugs, and machine learning models, for example. With the A/B test plugin, you can perform an A/B test from design to the analysis of the results.

