
Quick Start | Dataiku for finance data preparation#
Get started#
Are you a finance professional looking to streamline data cleaning and analysis in Dataiku? You’re in the right place!
Create an account#
To follow this tutorial, you need access to Dataiku 13.0 or later. If you don’t already have access, you can get started in one of two ways:
Follow the link above to start a 14-day free trial. See How-to | Begin a free trial from Dataiku for help if needed.
Install the free edition locally for your operating system.
Open Dataiku#
The first step is getting to the homepage of your Dataiku Design node.
Go to the Launchpad.
Within the Overview panel, click Open Instance in the Design node tile once your instance has powered up.
Important
If using a self-managed version of Dataiku, including the locally downloaded free edition on Mac or Windows, open the Dataiku Design node directly in your browser.
Once you are on the Design node homepage, you can create the tutorial project.
Create the project#
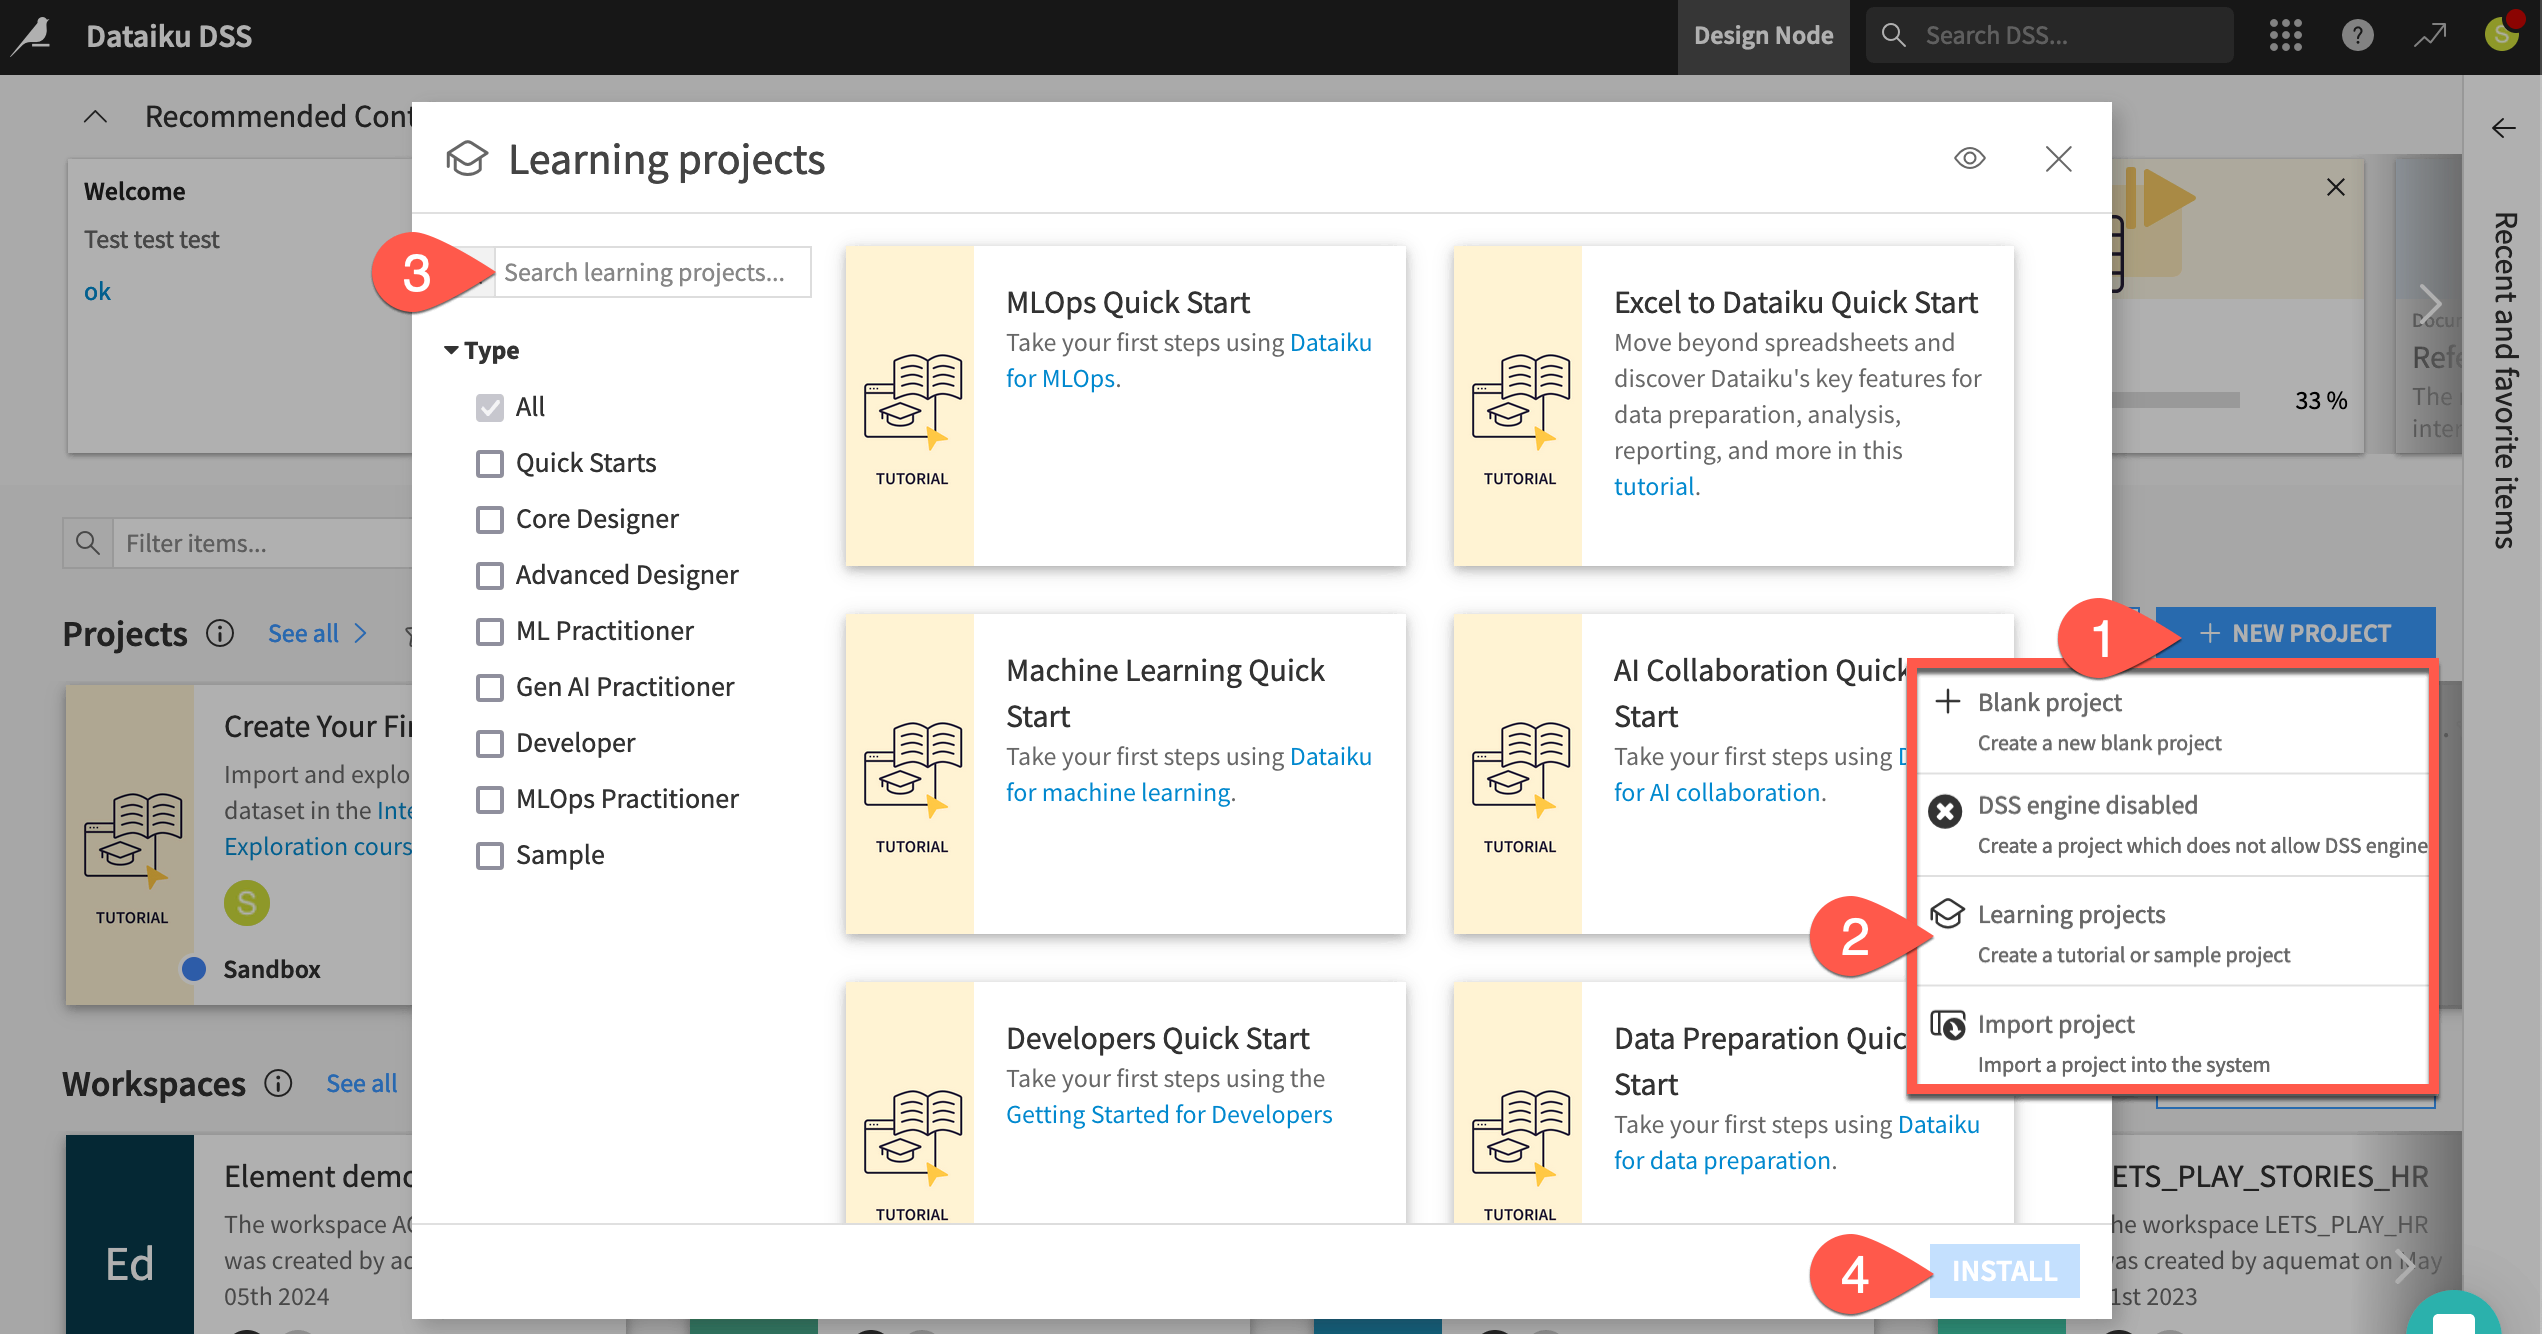
From the Dataiku Design homepage, click + New Project.
Select Learning projects.
Search for and select Finance Data Prep Quick Start.
If needed, change the folder into which the project will be installed, and click Create.
From the project homepage, click Go to Flow (or type
g+f).
Note
You can also download the starter project from this website and import it as a ZIP file.
Objectives#
Before starting, take a moment to review the goals of this Quick Start.
In this tutorial, you will:
Create a Dataiku project and import multi-sheet Excel data.
Clean and prepare data using visual recipes.
Use data quality rules to ensure data validation.
Interactively explore a dataset.
Transform your data into an analysis-ready format.
Consolidate your Flow.
Tip
To check your work, you can review the completed version of this project in the Dataiku Gallery. This project reflects the final state of the Flow after completing all the steps in this Quick Start.
Use case summary#
This Quick Start tackles a common finance workflow: preparing revenue and expense data for analysis. Rather than manually manipulating spreadsheets, you’ll build a scalable, repeatable workflow in Dataiku.
You’ll work from a multi-sheet Excel file containing planned and actual financial figures across multiple expense and revenue categories.
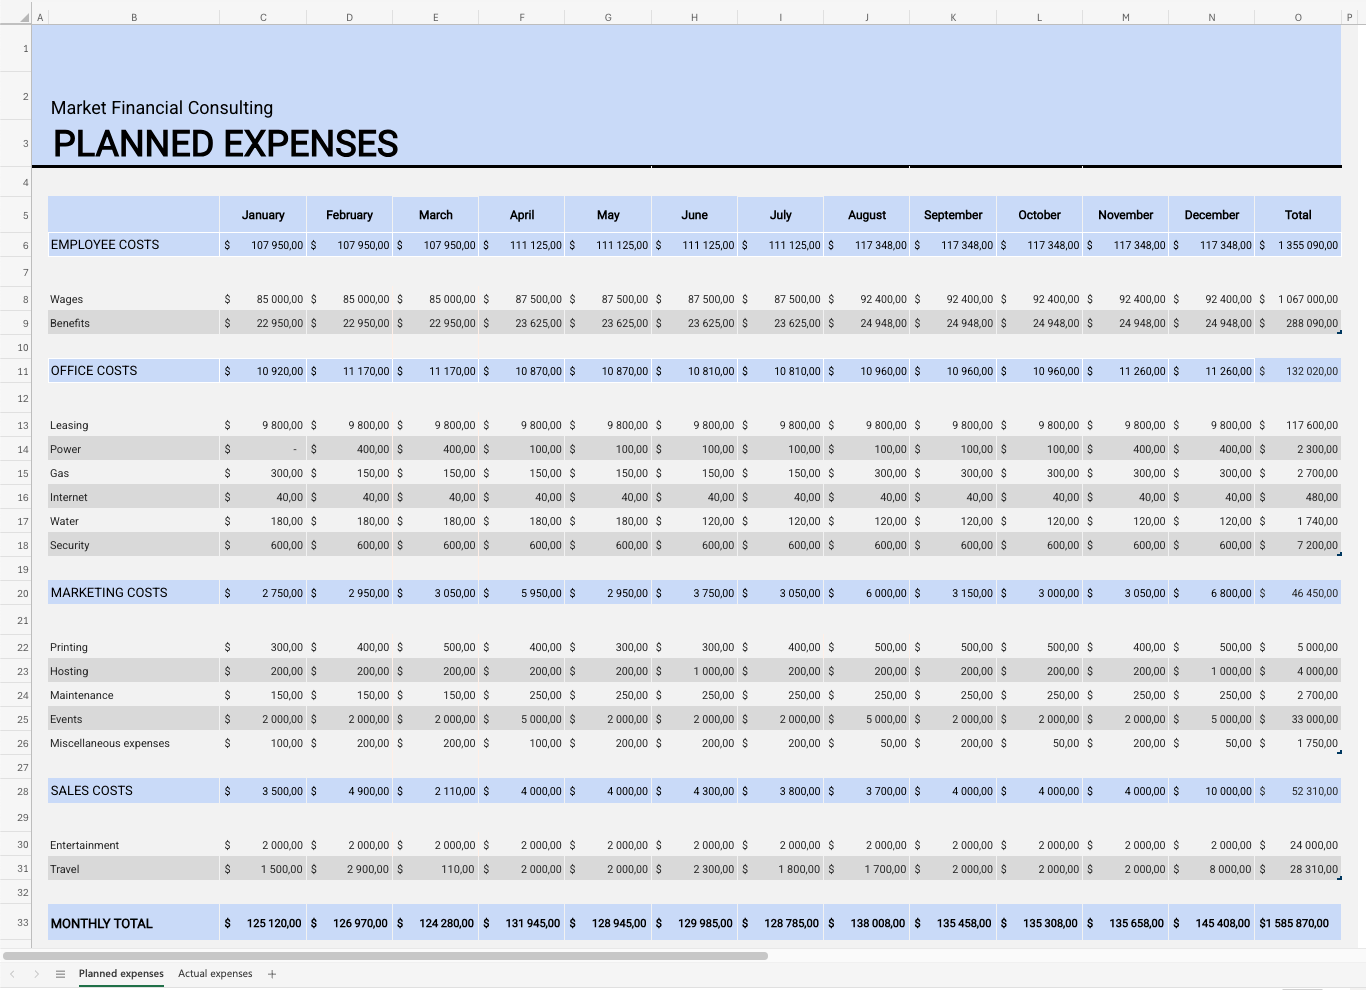
While this format is convenient for humans to read, it creates challenges for automated analysis. Typical issues include:
styled or merged headers instead of explicit column names
empty spacer columns and formatting-only cells
wide, cross-tab layouts that complicate comparison and aggregation
These inconsistencies make the data harder to load, clean, and analyze efficiently.
Using Dataiku’s visual tools, you’ll standardize the data into a clean, analysis-ready format—without writing code. Along the way, you’ll apply data validation rules to ensure data consistency. By the end, you’ll have a clean dataset that can be updated with new data and a reusable workflow that supports ongoing financial reporting.
Import and access source data#
To begin working in Dataiku, you need to bring your data into the Flow. In this section, you’ll import the multi-sheet Excel file using the classic file upload method and create multiple Datasets—one per sheet.
Import an Excel workbook with multiple sheets#
First, start by importing the Excel workbook to work with, expenses_budget.xlsx.
Download the Excel file expenses_budget.xlsx.
From the Flow, click + Add Item.
Choose Upload from the dropdown menu.
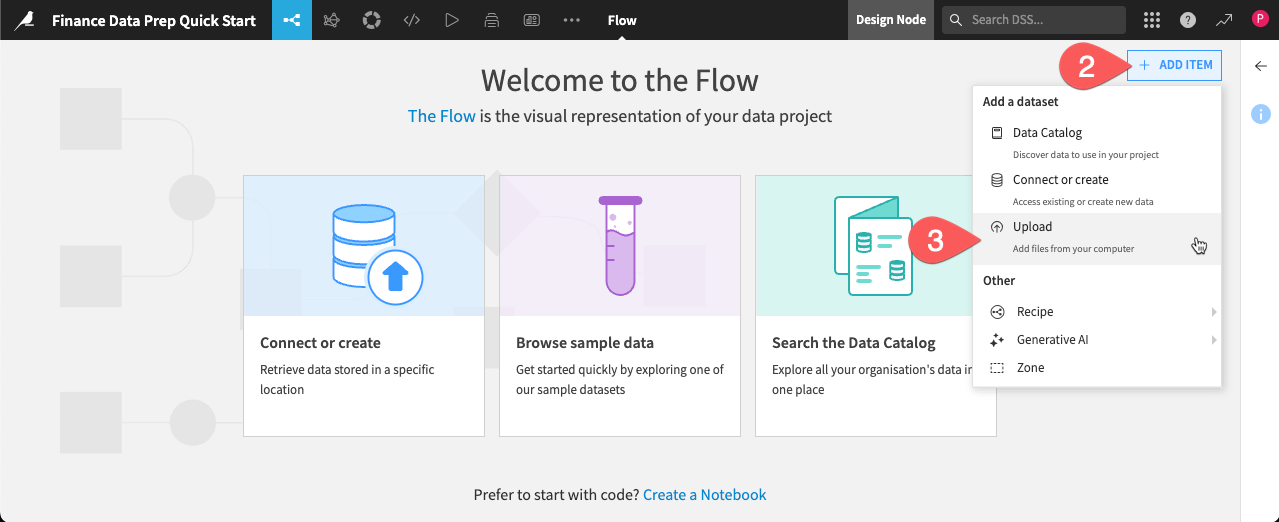
This takes you to the New uploaded files dataset page. Dataiku can connect to files in a number of different storage options, and you can upload files such as Excel or CSV files directly from your computer.
Click Select Files.
Navigate to the expenses_budget.xlsx file on your computer, and either double-click the file name or click Open on the dialogue box.
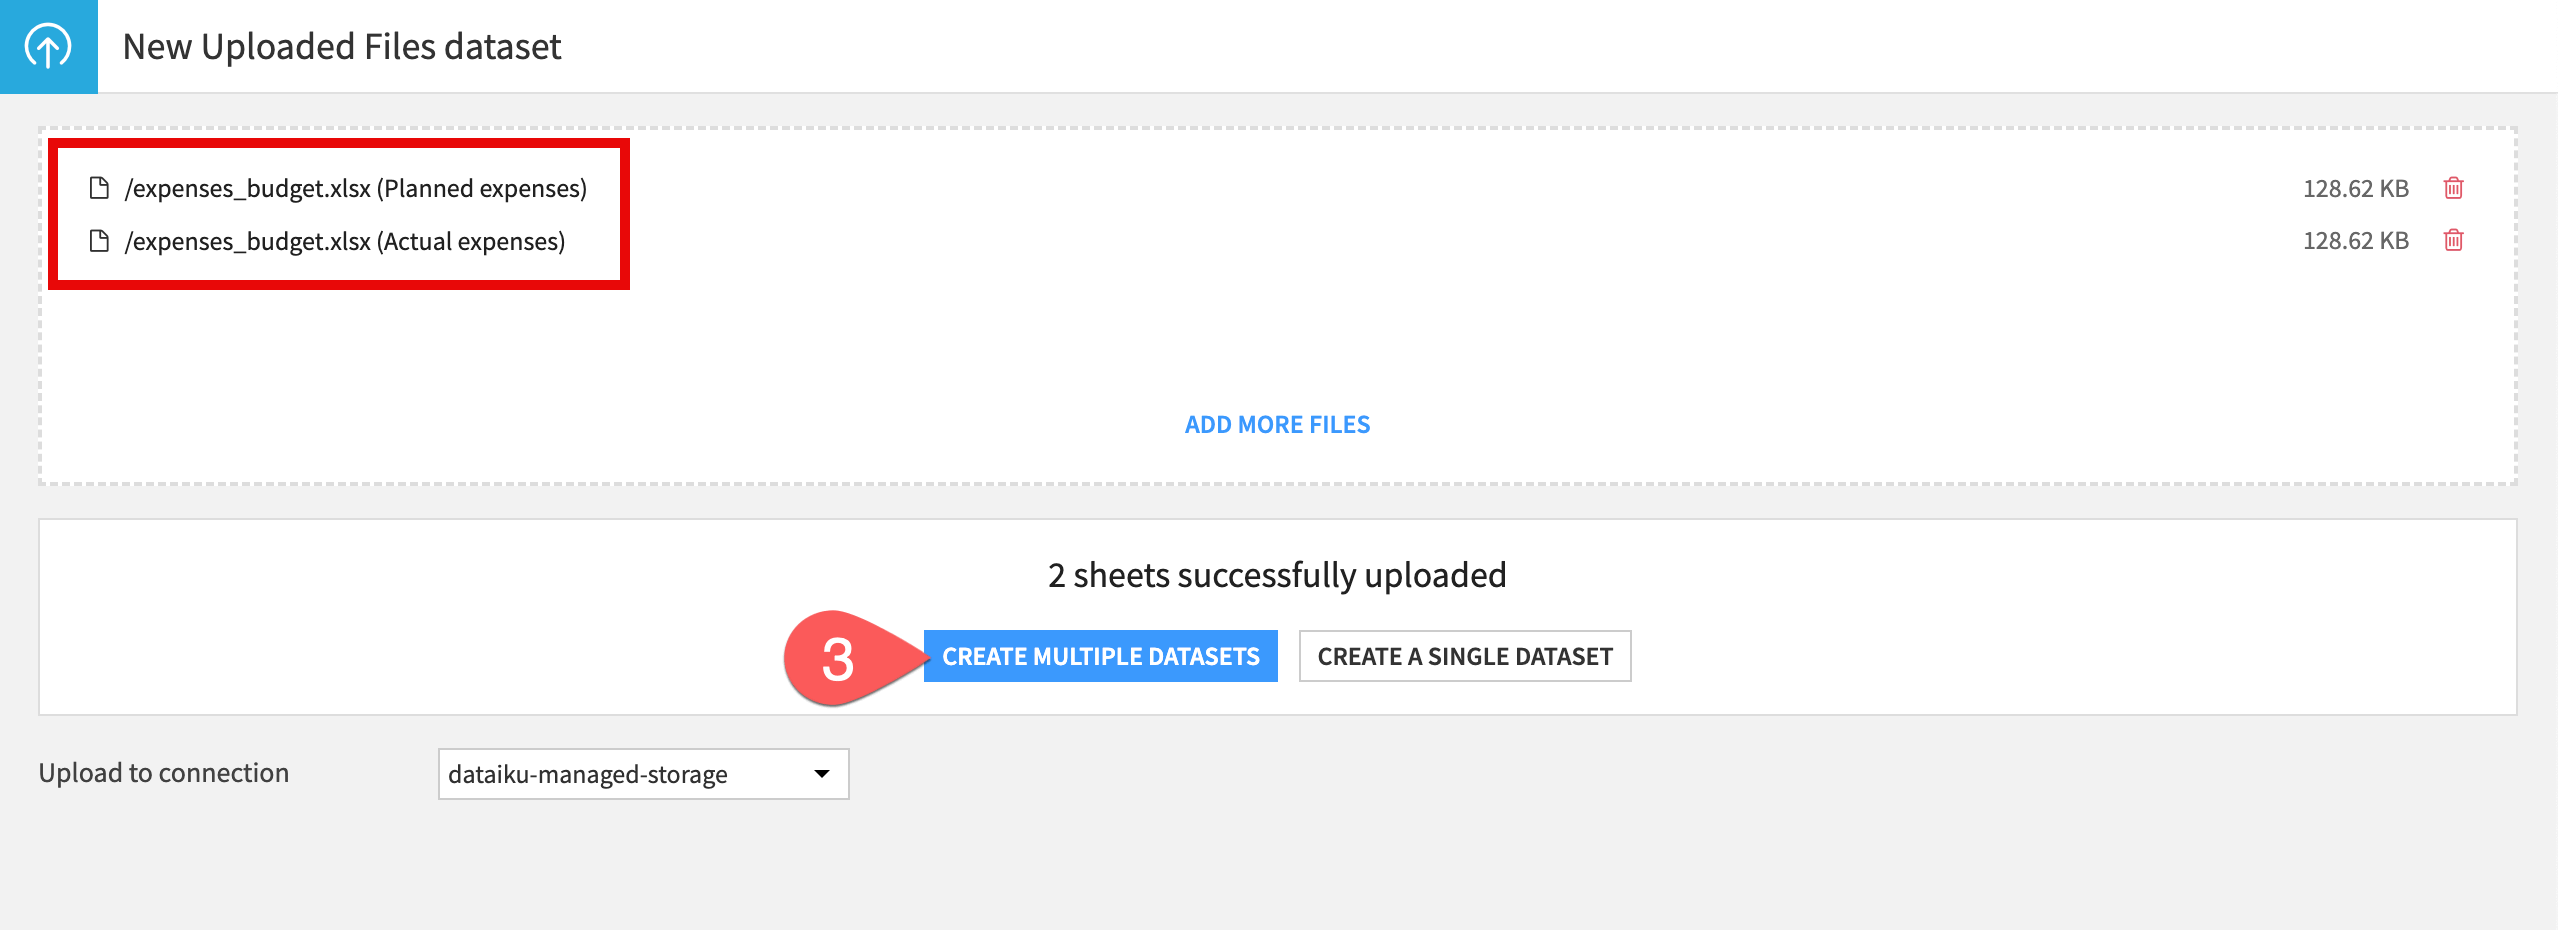
Dataiku detects two sheets in this file, one for Actual expenses and one for Planned expenses, and suggests creating a separate dataset for each. Click Create Multiple Datasets.
Dataiku shows a preview of your first data sheet, along with the data types and first few rows for each column. Note that Dataiku has automatically configured various settings for reading purposes.
In the top right of the page, click Create And Next. It brings you to the second sheet dataset creation.
Click Create again in the top right.
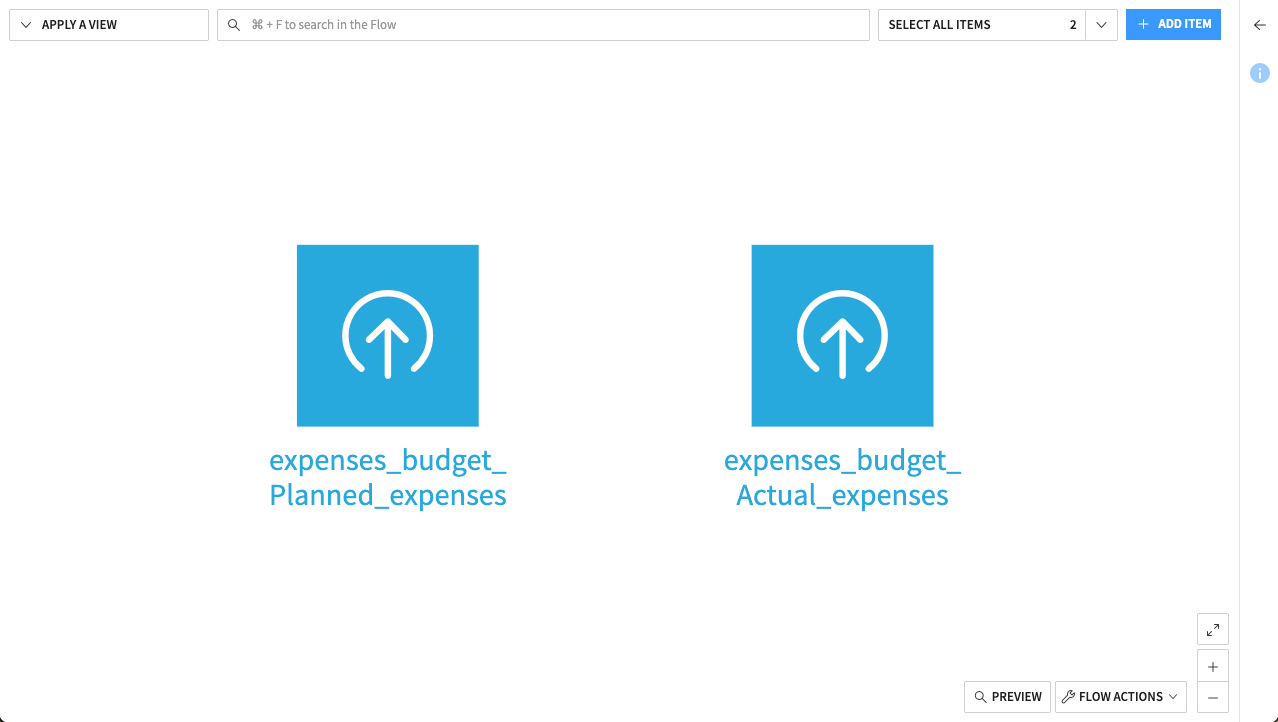
You now have two raw datasets in your Flow.
Tip
You can import a multi-sheet Excel workbook into a single dataset, combining the rows from all sheets into one table. This only works if all sheets have the exact same structure (same columns in the same order). To see how this works, check out the Quick Start | Excel to Dataiku.
Explore the raw data#
Before cleaning the data, it’s essential to understand its structure and potential quality issues.
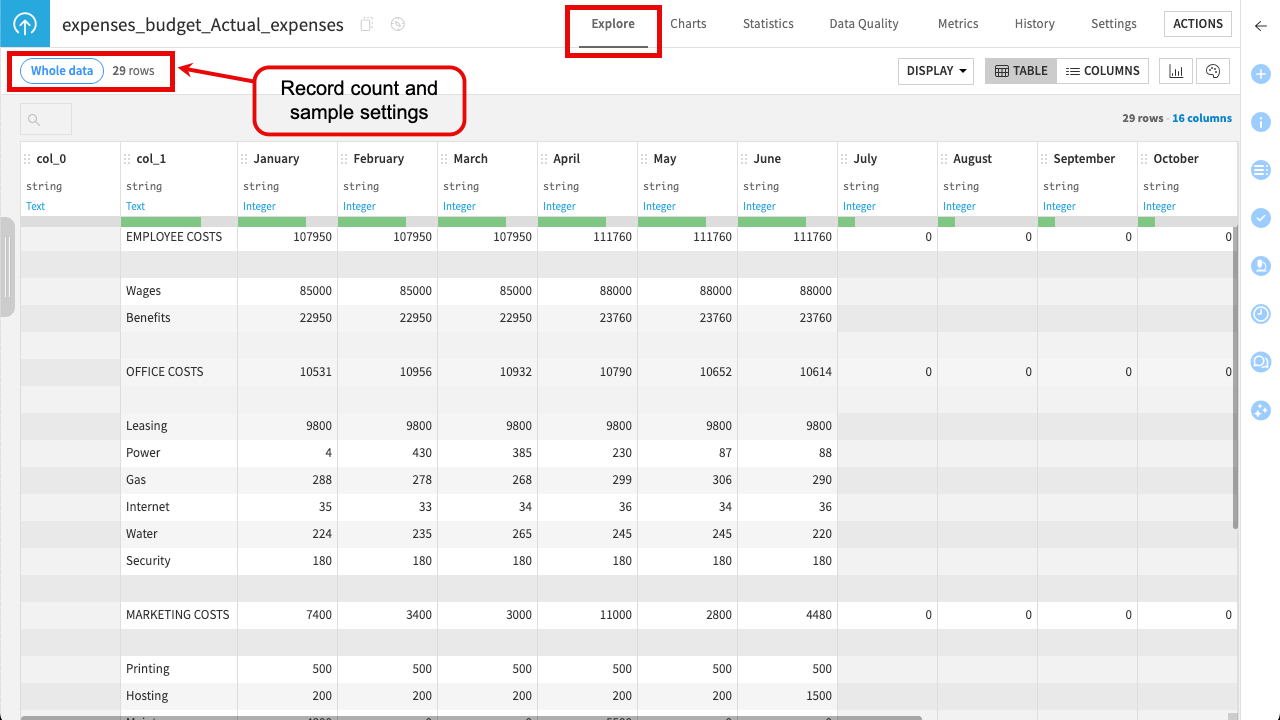
The default view for a dataset in Dataiku is the Explore tab. While it looks similar to a spreadsheet, it offers additional tools that make it easy to explore and assess the quality of your data. From here, you can quickly assess data quality, sort and filter values, and analyze any column.
Double-click the expenses_budget_Actual_expenses dataset to open it.
Examine the columns and rows. You’ll immediately notice that the raw data isn’t yet ready for analysis:
Columns have default names (like col_0, col_1) because the spreadsheet’s visual headers are offset or merged, preventing Dataiku from identifying them automatically.
Some columns and rows are blank, originally used only for visual spacing in the spreadsheet.
The data is stored in a “wide” format—readable for humans, but not optimal for aggregation or analysis.
Note
The Explore tab displays only a sample of your dataset (10,000 rows by default) for performance. In real-world financial files, which can be much larger, some values might not appear in the sample. If needed, you can change this by clicking the Sample / Whole data toggle in the top-left corner. See Concept | Sampling on datasets for more details.
At this stage, we’re not addressing these formatting issues. The Explore tab is meant for inspecting and understanding your data.
Clean data#
Now that you’ve inspected the data and identified issues, you’re ready to clean it.
In Dataiku, the Prepare recipe is the main tool for cleaning and restructuring data without writing code. This is where you can perform many of the same cleaning steps as you do in Excel—such as find and replace, IF functions, or custom formulas—but with the added benefit of tracked, repeatable, and editable steps.
Create a Prepare recipe#
You’ll now create a Prepare recipe and start applying cleaning steps using Dataiku’s processor library, which includes around 100 built-in data functions. As you work, you can preview the results directly in the recipe. Once you’re satisfied with the transformations, you’ll run the recipe to generate a new cleaned dataset.
From the Explore tab, click on Actions near the top right to bring up the right panel.
From the menu of visual recipes, select Prepare.
In the New data preparation recipe dialog, name the Output dataset
Actual_Expenses_clean.Click Create Recipe.

This brings you to the Prepare recipe Script page, where you’ll add all the cleaning steps.
Remove unused columns#
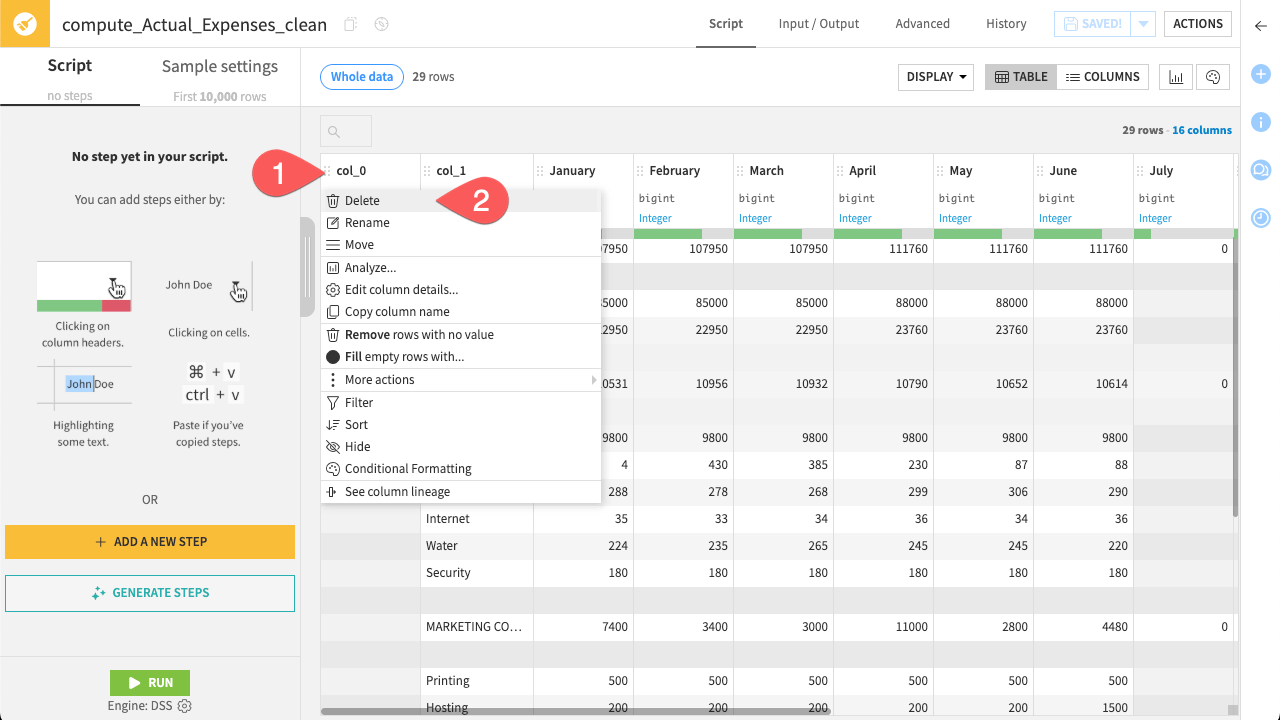
The raw data includes columns that are completely empty or used only for indentation in the Excel report. Remove them.
Click on the column name col_0.
In the dropdown menu select Delete.
Repeat this procedure for the second empty column: col_15.
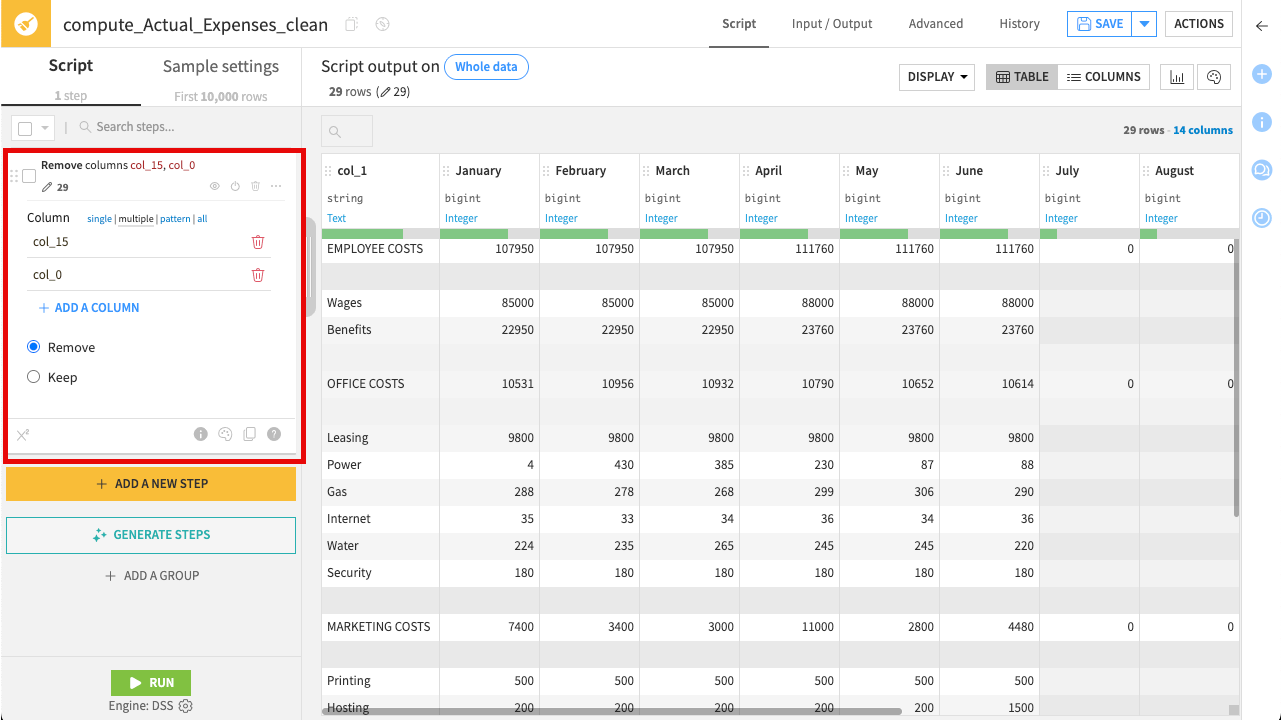
Nice job! You’ve successfully added the step Remove columns ‘col_15’, ‘col_0’ to your Prepare recipe. Notice the step now appears in the script on the left.
Tip
In the Prepare recipe, column headers also contain other proposed steps. Check out the options available in some other columns.
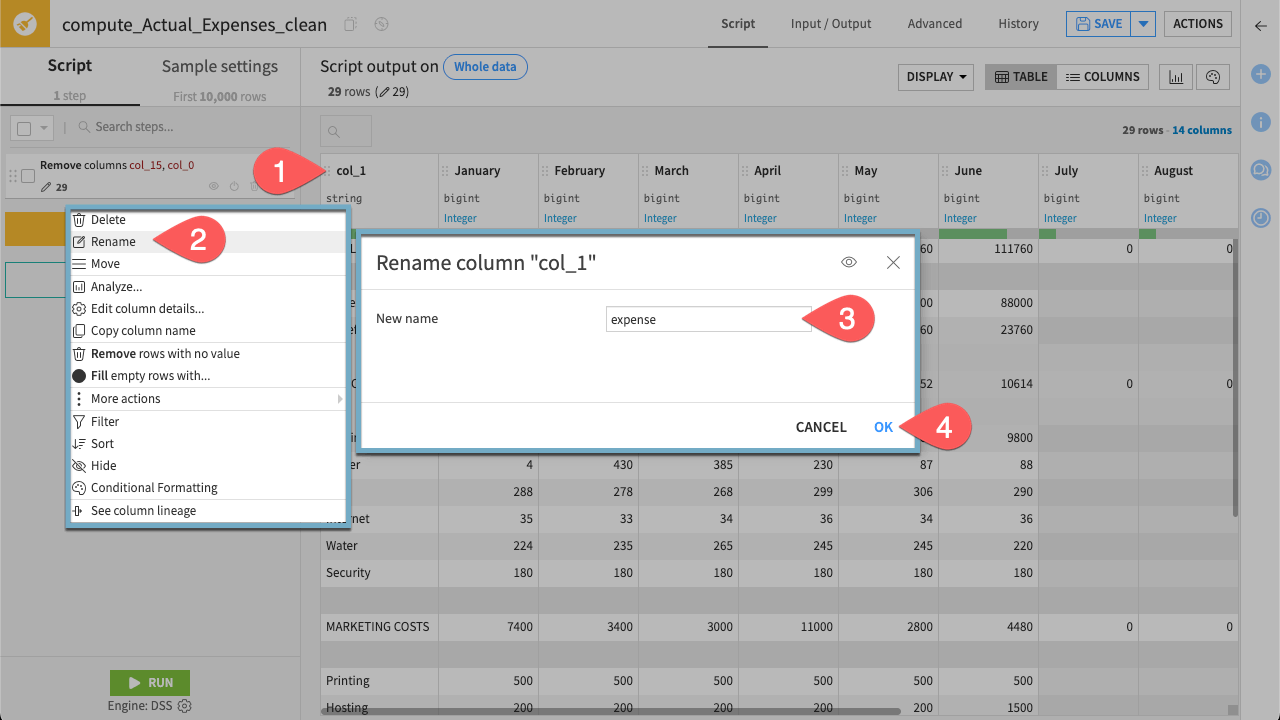
Edit column name#
The current column names (such as col_1) are generic and not informative. To make the dataset easier to understand and work with, rename col_1 to something meaningful—for example, expense.
Click on the column name col_1.
In the dropdown menu select Rename.
Rename the column
expense.Click OK.
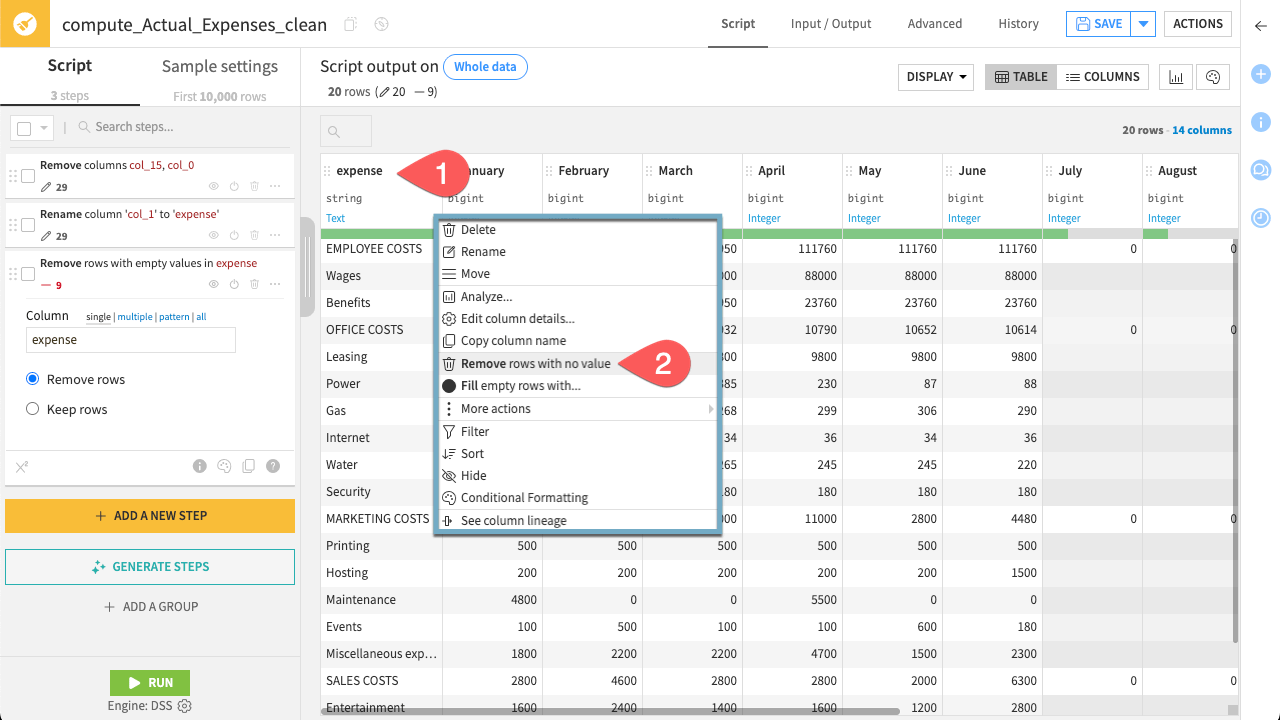
Filter rows#
The dataset still needs some cleaning. For example, it contains empty rows to remove.
Click the header of the expense column.
Select Remove rows with no value. This immediately removes rows where this column has no value.
Tip
You can see exactly which rows are being removed by toggling the View Impact button (![]() ) within the step settings.
This highlights the rows matching your filter in the data preview, ensuring you don’t delete valid data.
) within the step settings.
This highlights the rows matching your filter in the data preview, ensuring you don’t delete valid data.
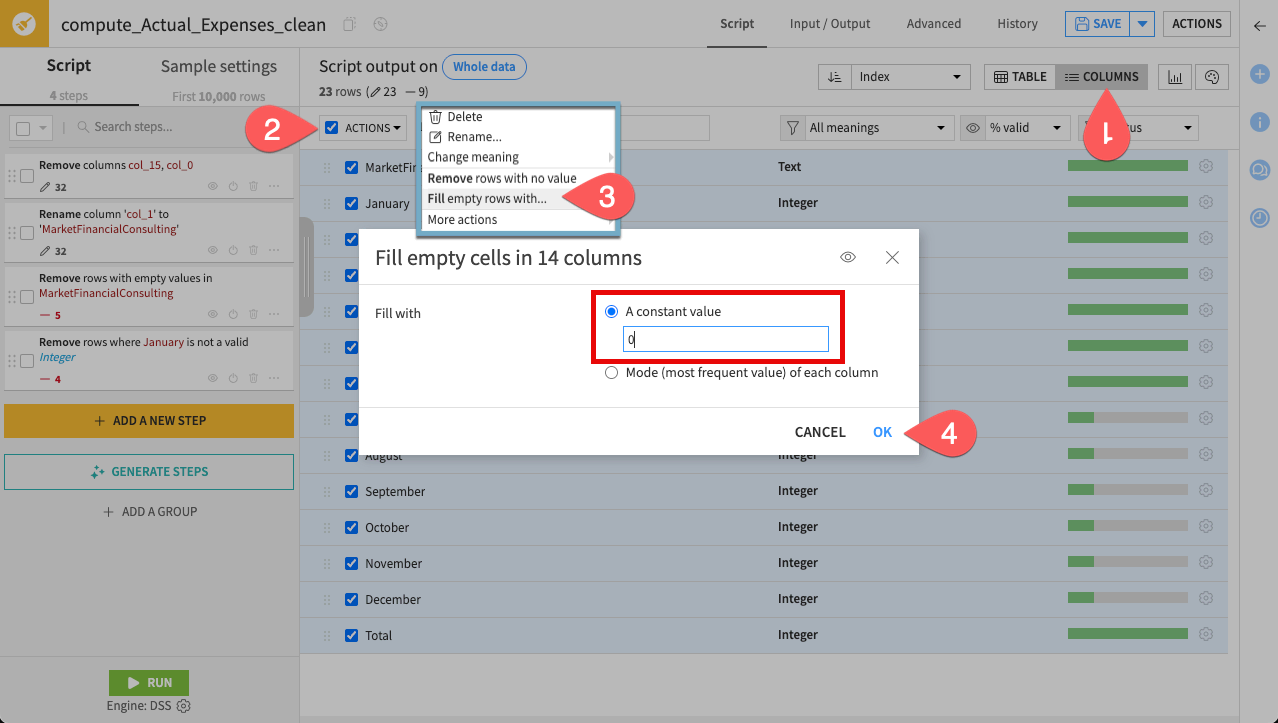
Fill empty cells#
Finally, handle the missing values. In financial data, blank cells often represent zero expenses, but technically an empty cell isn’t the same as the number 0.
To ensure calculations behave correctly later, replace these empty cells with actual zeros.
To do this efficiently for all columns at once, use the Columns view.
Click Columns in the top bar of the recipe editor.
Select all the columns.
In the Actions dropdown, select Fill empty rows with.
Enter
0and click OK.
Your cleaning script is complete! Before running the recipe, verify the results in the data grid.
Click Table in the top bar of the recipe editor to return to the grid view.
Scroll through the monthly columns to confirm that empty cells have been replaced by 0.
In the bottom left corner, click Run.
When the job finishes, click Explore dataset Actual_Expenses_clean.
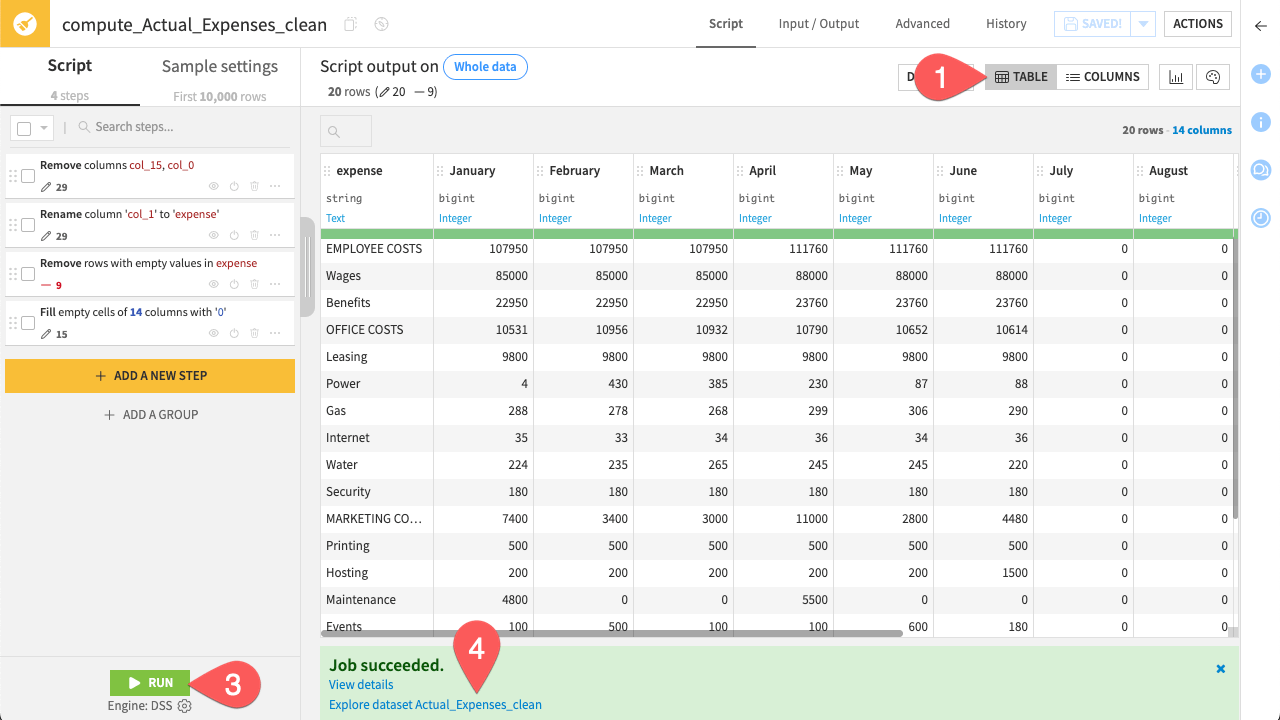
You now have a standardized, clean dataset ready for the next stage of preparation.
Prepare data#
Now that the data is clean, you need to structure it and verify its integrity. To keep the workflow modular and organized, you’ll perform these new preparation steps in a separate Prepare recipe.
In the Actions sidebar, click the Prepare icon.
Name the Output dataset
Actual_Expenses_category.Click Create Recipe.
Compute new columns#
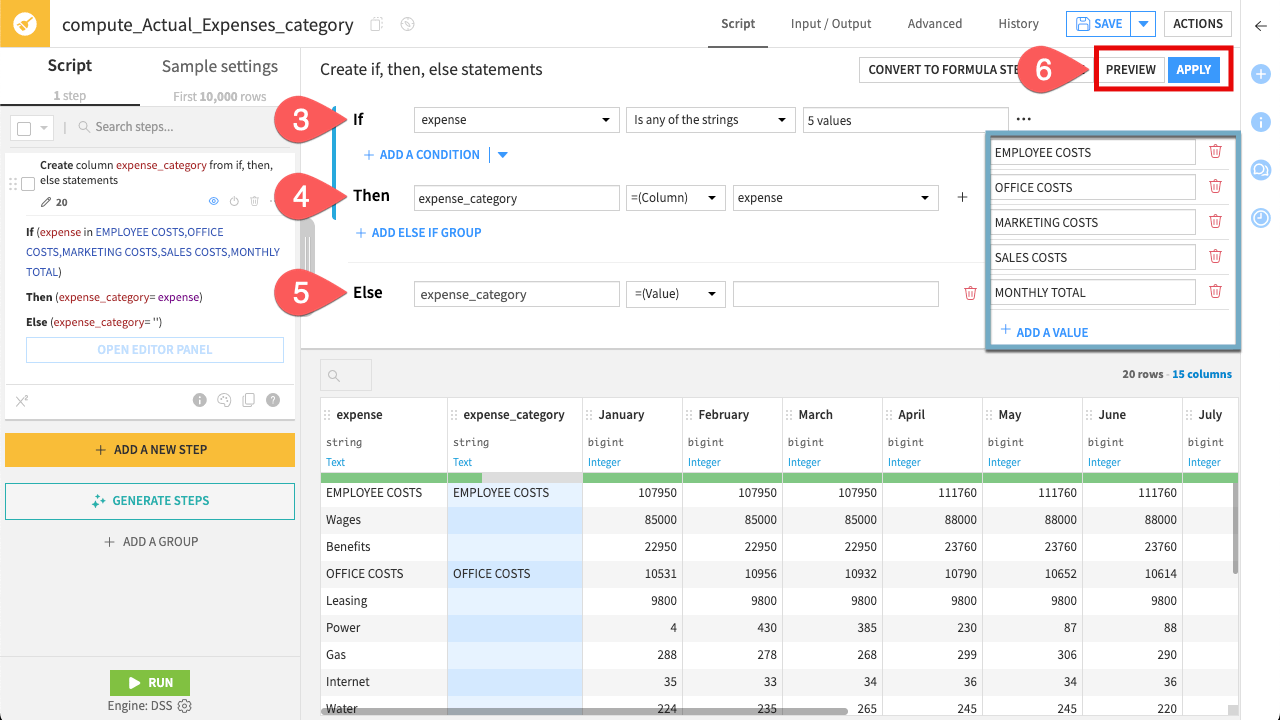
The dataset is currently a flat list, but for business analysis you need to group line items under a high-level column, expense_category. To do so, use the Create if, then, else processor.
On the left side of the screen, click + Add A New Step. This brings up the processor library.
Search for and select the processor Create if, then, else statements.
- In the If block:
Set the column to expense.
Choose the operator Is any of the strings, and enter the category headers:
EMPLOYEE COSTS,OFFICE COSTS,MARKETING COSTS,SALES COSTS, andMONTHLY TOTAL.
- In the Then block:
Type
expense_categoryas the output column name.Change the assignment dropdown to =(Column), and select expense as the source column.
- In the Else block (click + Add Else if not visible):
Type
expense_categoryas the output column name.Leave the assignment dropdown as =(Value) and keep the text box empty.
Click Preview to check the results. When satisfied, click Apply.
Note
The logic is straightforward: if a row contains a category header (such as “EMPLOYEE COSTS”), Dataiku copies that label into the new expense_category column. Other rows remain blank. This prepares the dataset for future grouping or aggregation in downstream analyses.
Now that you have extracted the category headers, fill in the gaps so every row belongs to a category.
Click + Add A New Step. Search for and select the processor for Fill empty cells with previous/next value.
Click + Add A Column, and select
expense_category.Ensure the option Fill with previous value is checked.
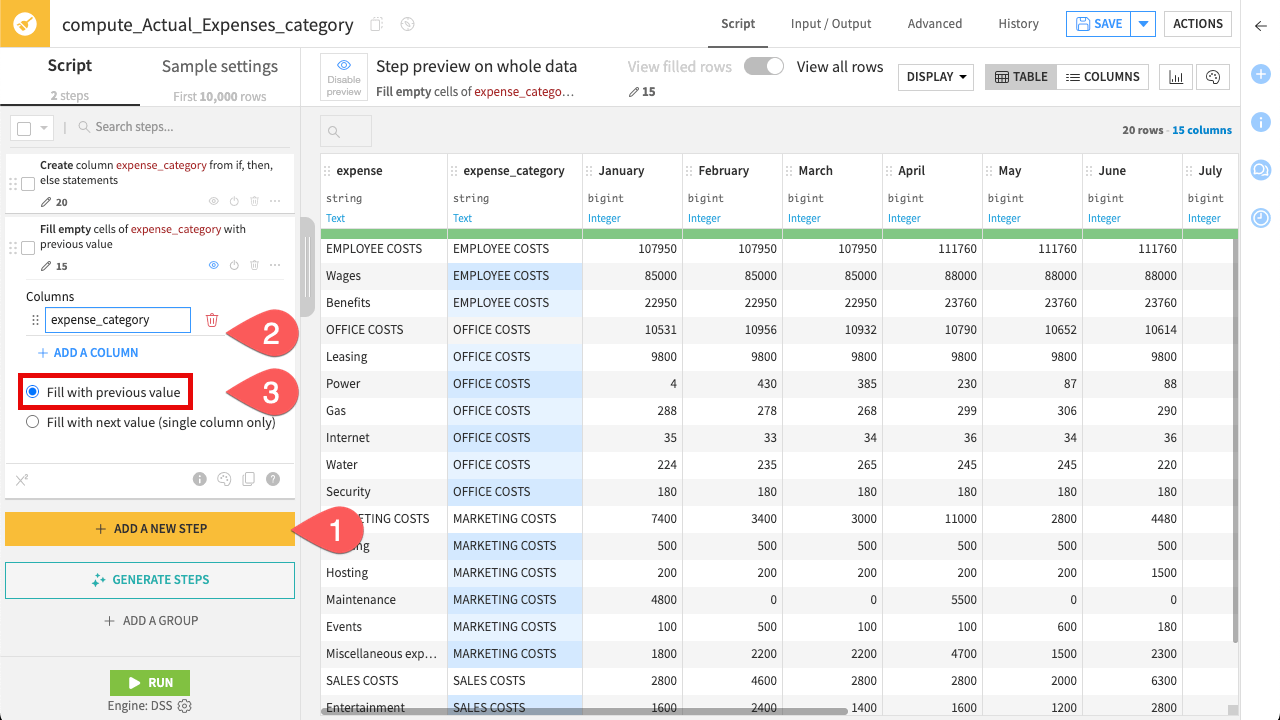
This “fills down” the category name until it hits the next category, effectively creating expense categories for your analysis.
Important
The Fill empty cells with previous/next value step relies on the order of the rows. Since this data comes from an uploaded Excel file, the order is preserved. However, be cautious when using this step with SQL datasets (such as Snowflake), as row order is not always guaranteed unless explicitly sorted.
Perform columns validation#
Before relying on this data for analysis, it’s important to check that the numbers are internally consistent.
The Excel file includes a Total column—but does it actually match the sum of the monthly values? To verify this, you’ll use the Formula processor.
If you’re familiar with Excel formulas, you’ll find Dataiku formulas very similar. They let you perform calculations, manipulate strings, and run logical checks directly in your preparation steps.
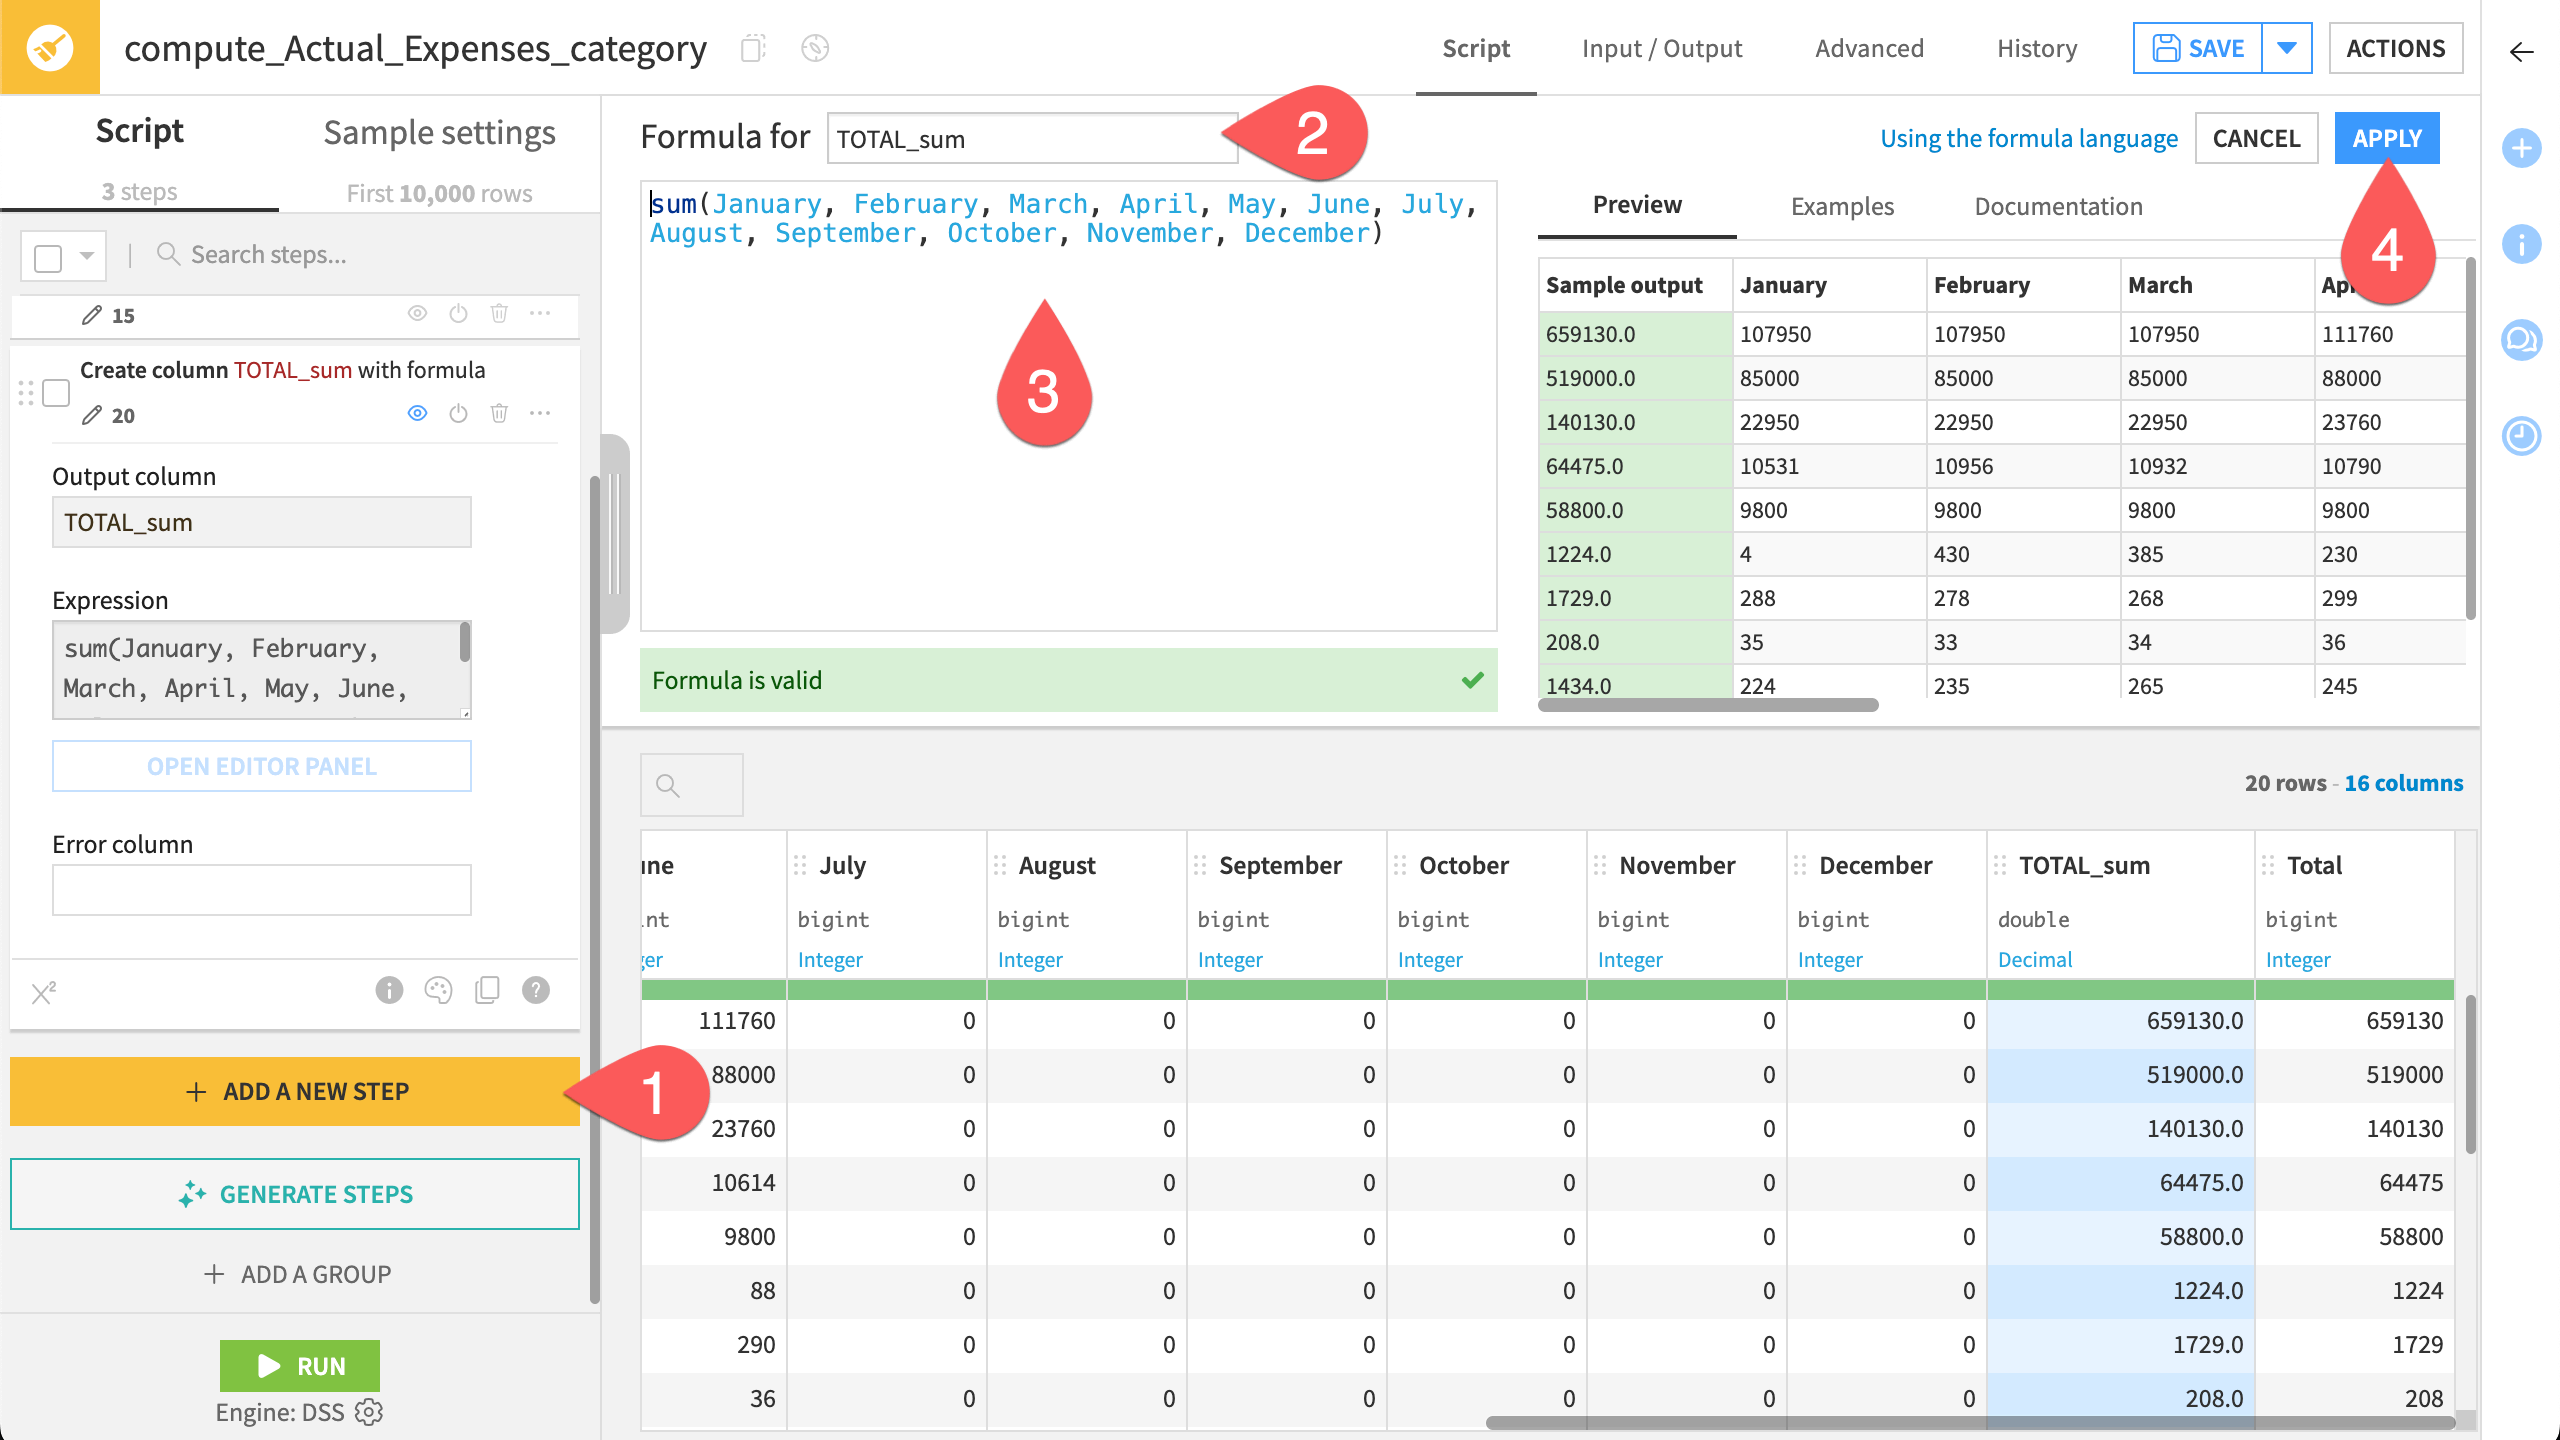
Start by calculating the sum of the monthly values.
Click + Add a New Step. Search for and select the processor Formula.
Name the output column
TOTAL_sum.In the Editor Panel, copy and paste the following formula:
sum(January, February, March, April, May, June, July, August, September, October, November, December)
Note
The sum() function returns the total of the listed values while automatically skipping any non-numeric elements. This ensures the calculation remains robust even if the input data contains unexpected text or empty strings.
Click Apply.
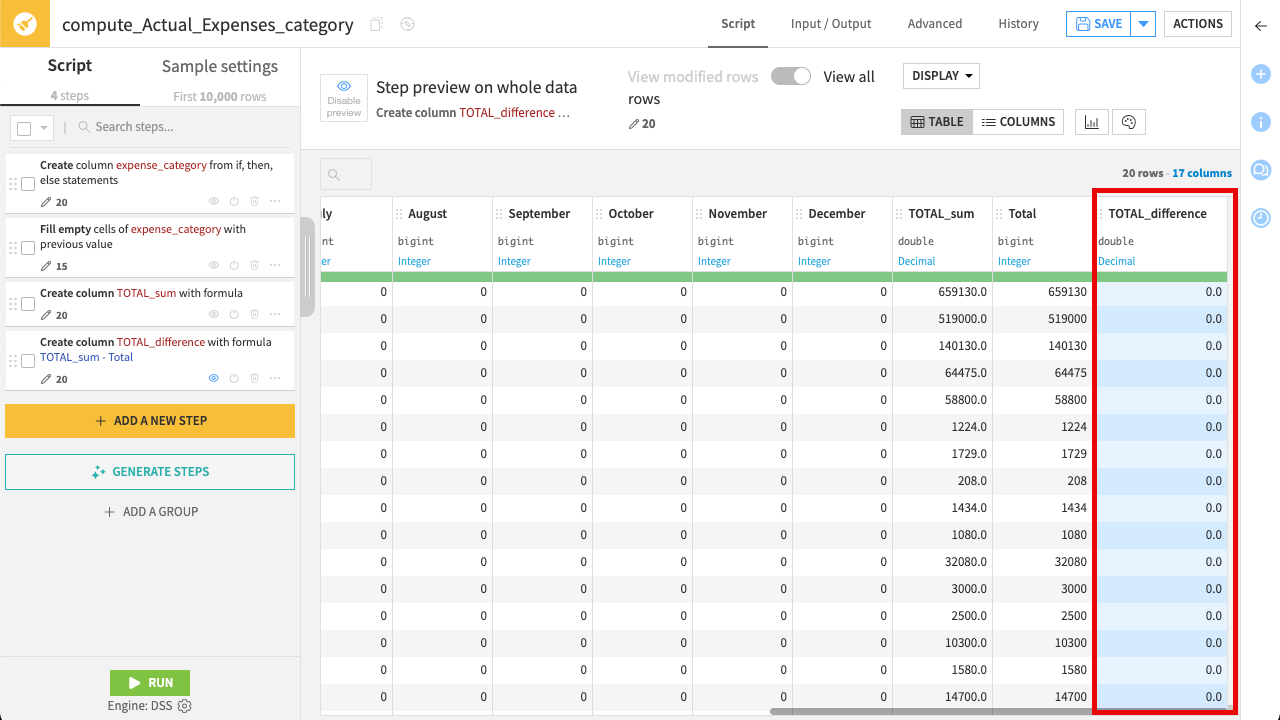
Now, compare the totals you computed with the original totals from the file.
Add another Formula step.
Name the output column
TOTAL_difference.Use the expression:
TOTAL_sum - Total
Check the results in the Preview and click Apply.
If the data is consistent, the TOTAL_difference column should contain only 0. If you see any non-zero values, it indicates a discrepancy in the source file.
Tip
For repetitive cleaning tasks or complex logic, you can also use Generate steps (if AI services have been enabled by your administrator) to describe your goal in natural language and have Dataiku suggest the appropriate processors.
You have defined the logic to structure and validate the data. Now, run the recipe to apply these transformations.
In the top right corner, click Save (or
Cmd/Ctrl+S).In the bottom left corner, click Run.
When the job finishes, click Explore dataset Actual_Expenses_category.
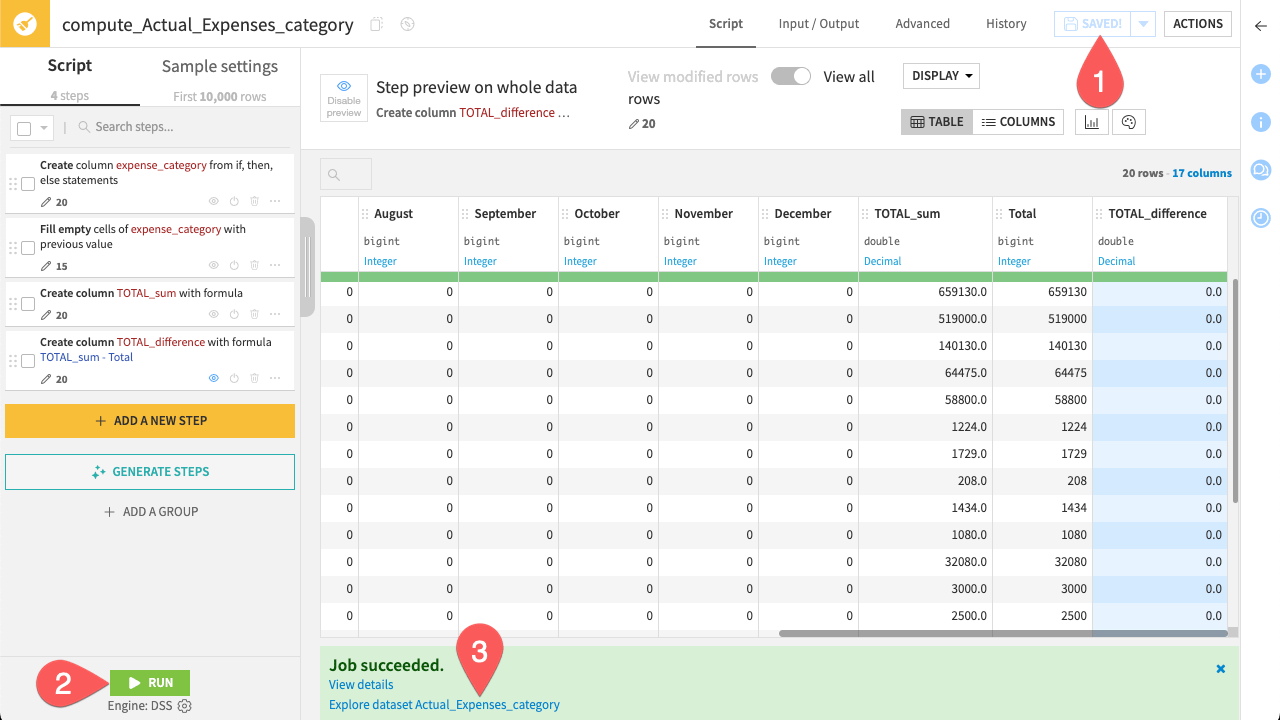
You should now see a fully structured dataset where every row has an expense_category, and your TOTAL_difference column confirms that the data is valid.
Check data quality#
In the previous step, you visually verified that the data was consistent. However, in a real workflow, you can’t manually inspect every row every time the data updates.
You’ll now add Data quality rules to automate this verification. These rules allow you to define valid ranges or conditions for your data.
Add data quality rules#
Create a rule that fails if the column TOTAL_difference is anything other than 0.
Navigate to the Data Quality tab of the Actual_Expenses_category dataset.
Click Create Rules.
Search for and select the rule Column values in set.
Select the column TOTAL_difference and add the value
0.0as Approved values.Note the rule name that has been auto generated. You can click on the pencil icon to overwrite it if you choose.
Click Run Test to test it, and confirm the green OK status.
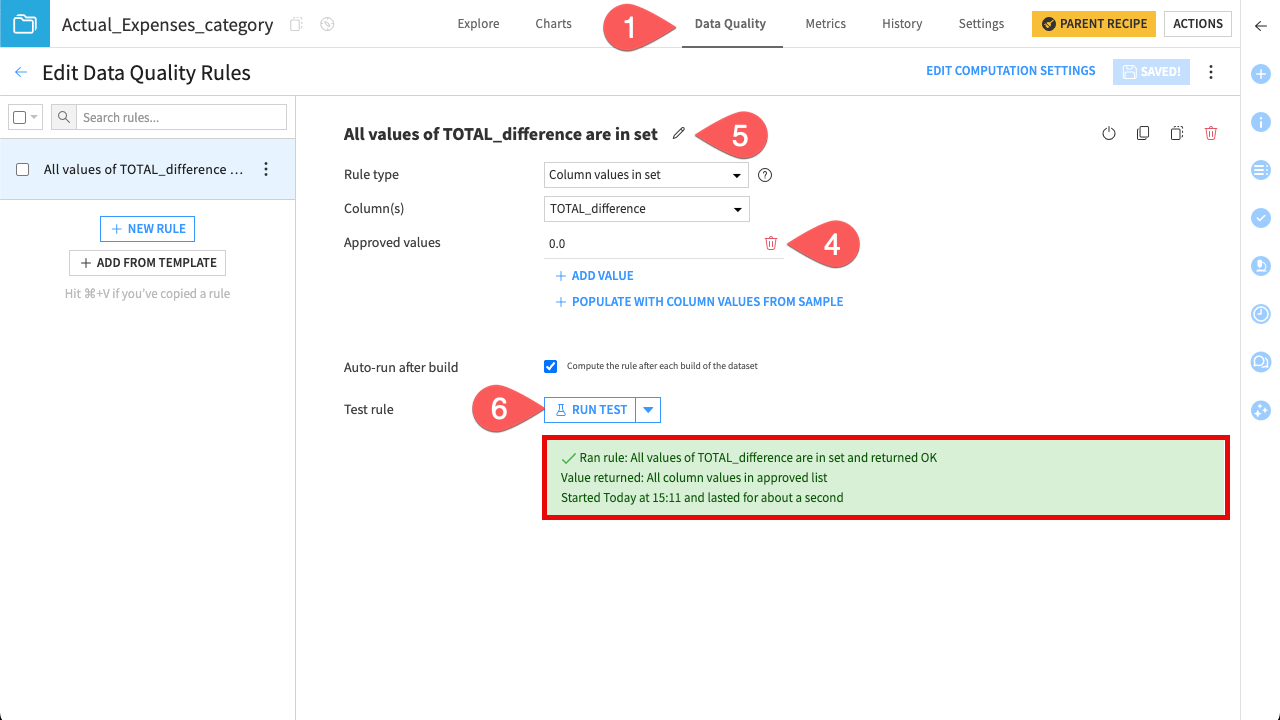
If a future update introduces a discrepancy, this check will turn red and prevent the error from propagating.
Note
The Data Quality tab contains a wide selection of built-in rule types. See the Data Quality Rules page in the reference documentation for an exhaustive list.
Explore the prepared data#
Finally, take a quick look at the dataset to visually confirm the results of your validation logic. In Dataiku, you can do this with just a few clicks using the Analyze feature.
Navigate to the Explore tab.
Click the TOTAL_difference column and select Analyze.
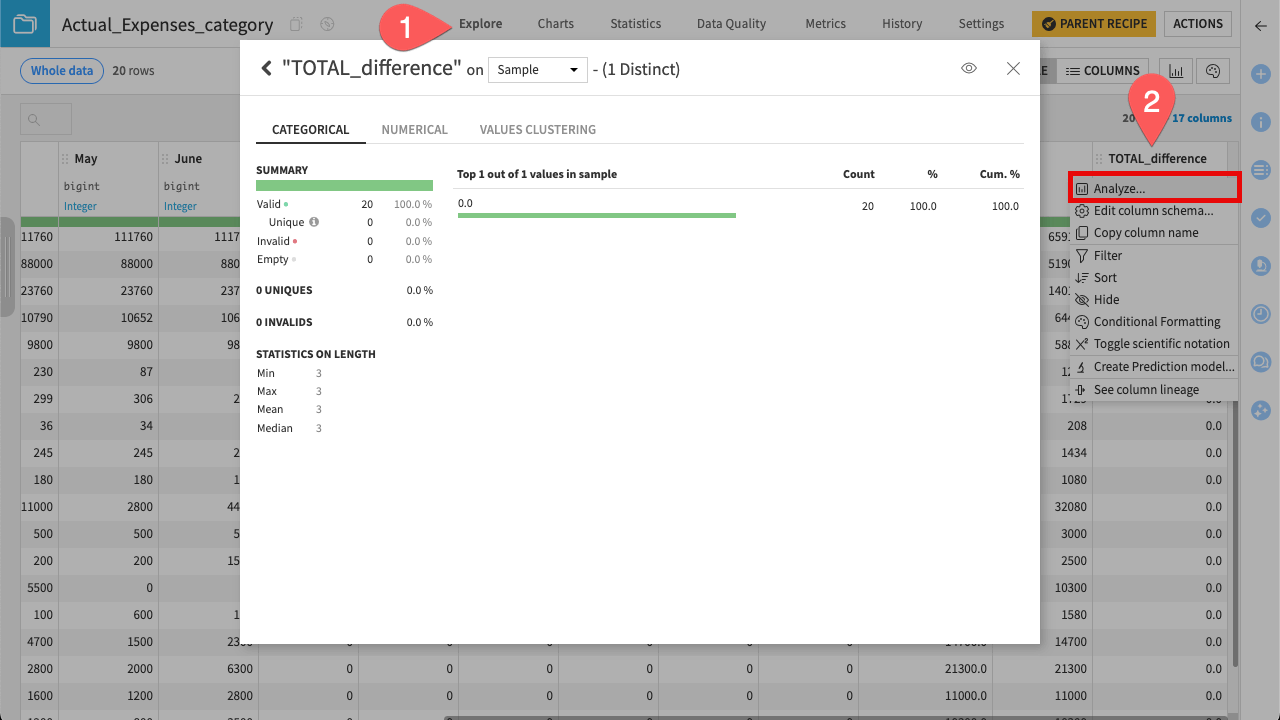
You should see that 100% of the values are 0. Your actual expenses data is now clean, structured, and validated.
Transform data for further analysis#
The dataset currently has 12 separate columns for months (wide format). For future analysis, we’ll convert it to a long format, combining all month columns into a single column and their corresponding values into another column.
Note
Spreadsheets often use wide format because it’s easier for humans to read. Analytics tools, however, work more efficiently with long format. By representing each monthly expense as its own row, it becomes much easier to perform analysis such as filtering by date or generating charts automatically.
This transformation will be performed in a separate Prepare recipe.
In the Actions sidebar, click the Prepare icon.
Name the Output dataset
Actual_Expenses_longand click Create Recipe.
Turn data from wide to long format#
Use the Fold processor to restructure the table.
Click + Add a New Step.
Search for and select the processor Fold multiple columns.
In the Columns List field, add all the month columns plus the column Total.
Set the Column for fold name to
Month.Set the Column for fold value to
Value.Make sure you check Remove folded columns.
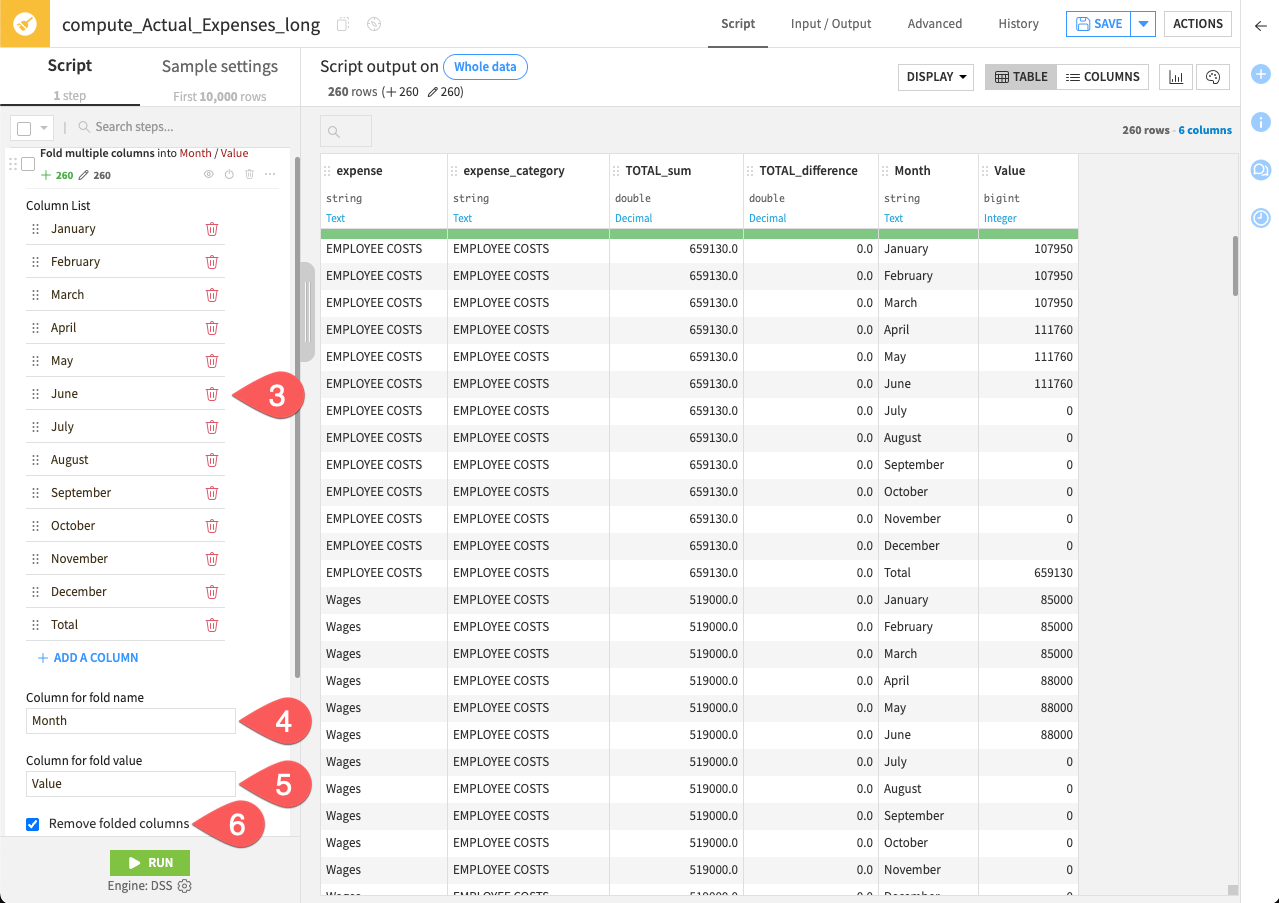
By checking the preview, you’ll see that the dataset has become much longer. Instead of one row per expense item, you now have 12 rows–one for each month.
You no longer need the validation columns TOTAL_sum and TOTAL_difference created in the previous recipe. Remove them and run the entire recipe.
Click the column TOTAL_sum and click Delete.
Repeat the procedure on the column TOTAL_difference.
In the top right corner, click Save (or
Cmd/Ctrl+S).In the bottom left corner, click Run.
When the job finishes, click Explore dataset Actual_Expenses_long.
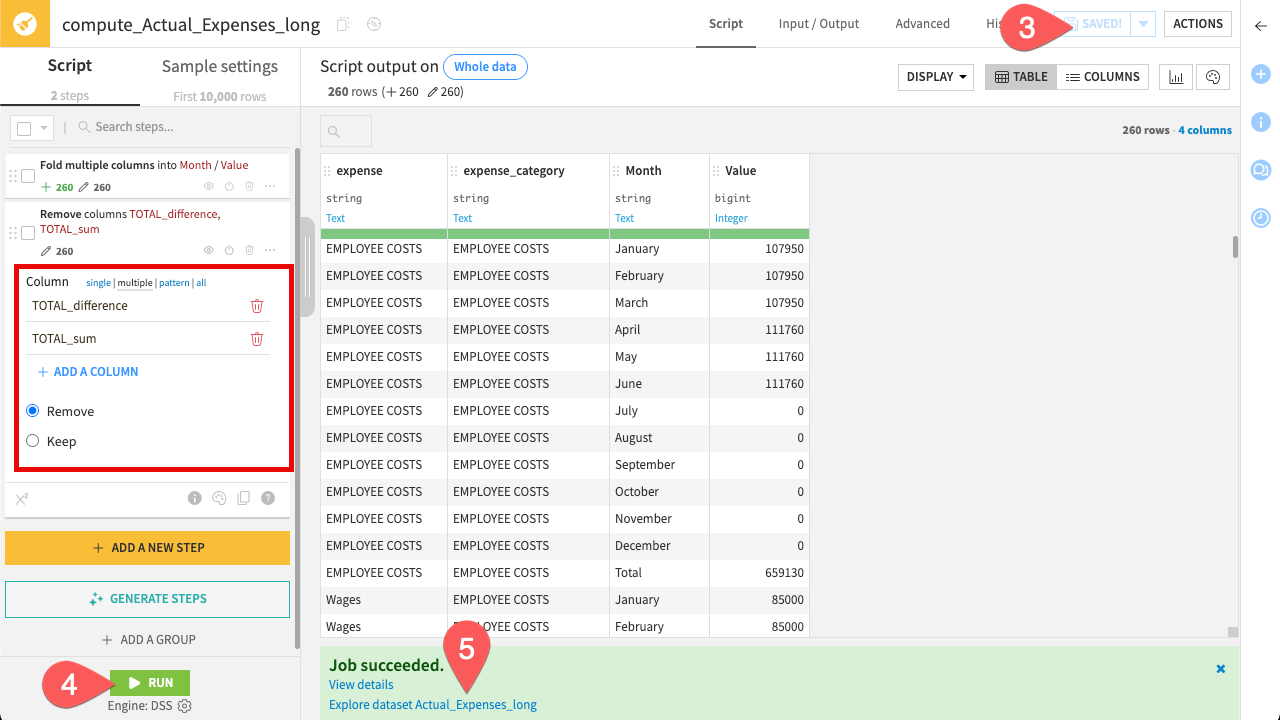
You should now see a tidy dataset with only the necessary columns.
Reuse preparation steps#
You have successfully processed the Actual expenses sheet through three stages: cleaning, preparing, and reshaping. Now, we’ll apply the same pipeline to the Planned expenses data, which has the same structure.
Rather than configuring each recipe from scratch, you can simply copy the steps from your existing recipes.
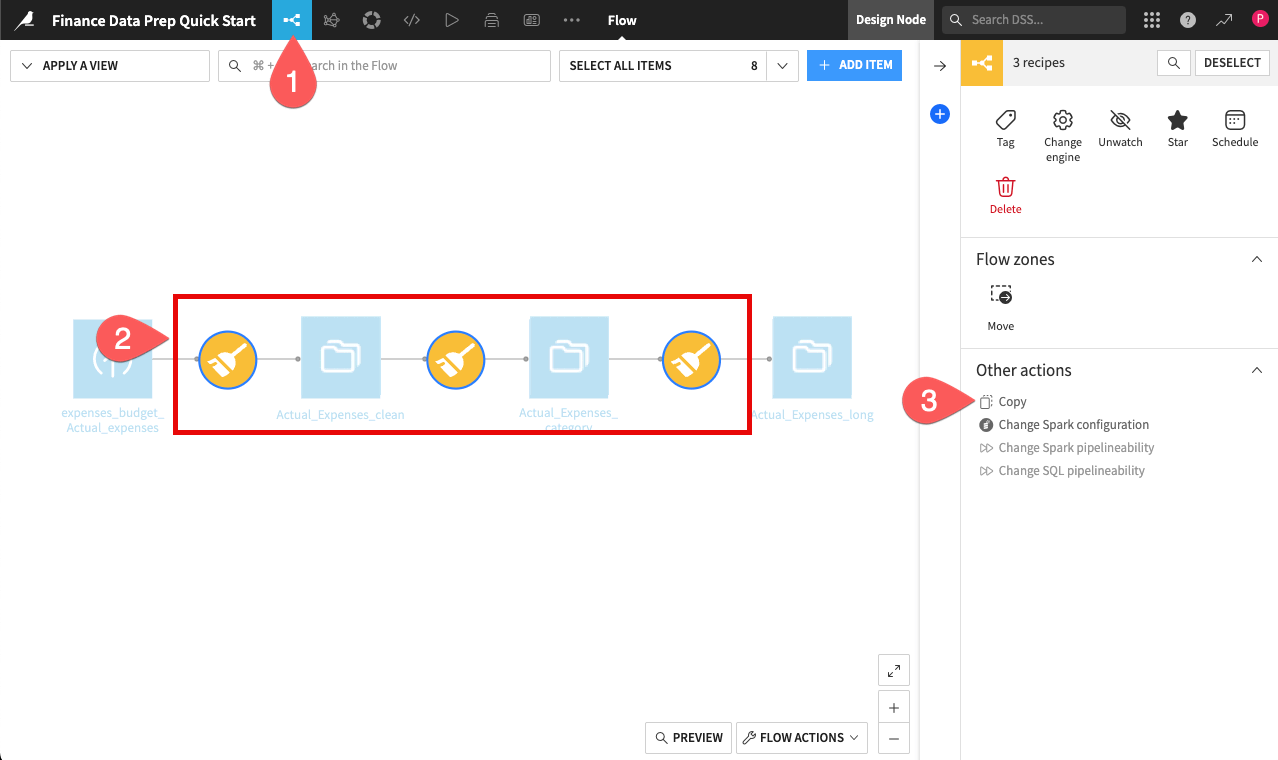
Return to the Flow. You can do this by clicking on the Flow (
 ) menu on the left of the top navigation bar, or by using the keyboard shortcut
 g+f.Hold
Cmd/Ctrland click the three recipes you created to select them.In the Actions panel on the right (
 ), click Copy.
To keep your Flow organized, rename the new output datasets so they don’t conflict with your original Actual data.
In the copy preview, click Copy To… to open the full configuration dialog.
Under the Renaming section, update the destination names to reflect the new branch by changing the outputs to
Planned_Expenses_category,Planned_Expenses_longandPlanned_Expenses_clean.Click Copy.

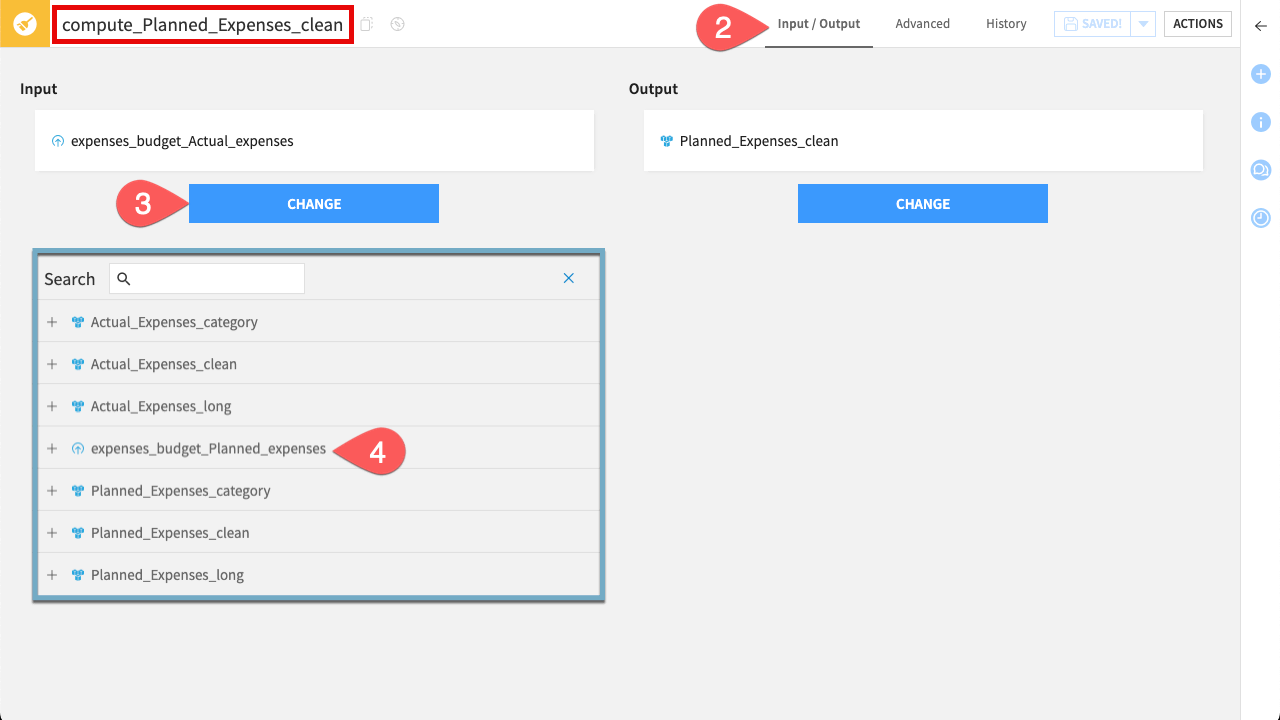
The duplicated recipes are currently still pointing to the actual expenses data. You need to redirect the start of this new branch to the planned expenses dataset.
Open the first new recipe: compute_Planned_Expenses_clean.
Navigate to the Input / Output tab.
Under the Input section, click Change.
Select the expenses_budget_Planned_expenses dataset.
Finally, build the entire branch to generate your new data.
Click Run in the bottom-left corner.
In the run dialog, select Run downstream. This ensures that once the current recipe finishes, Dataiku automatically triggers all subsequent recipes to complete the branch.
Click Run.
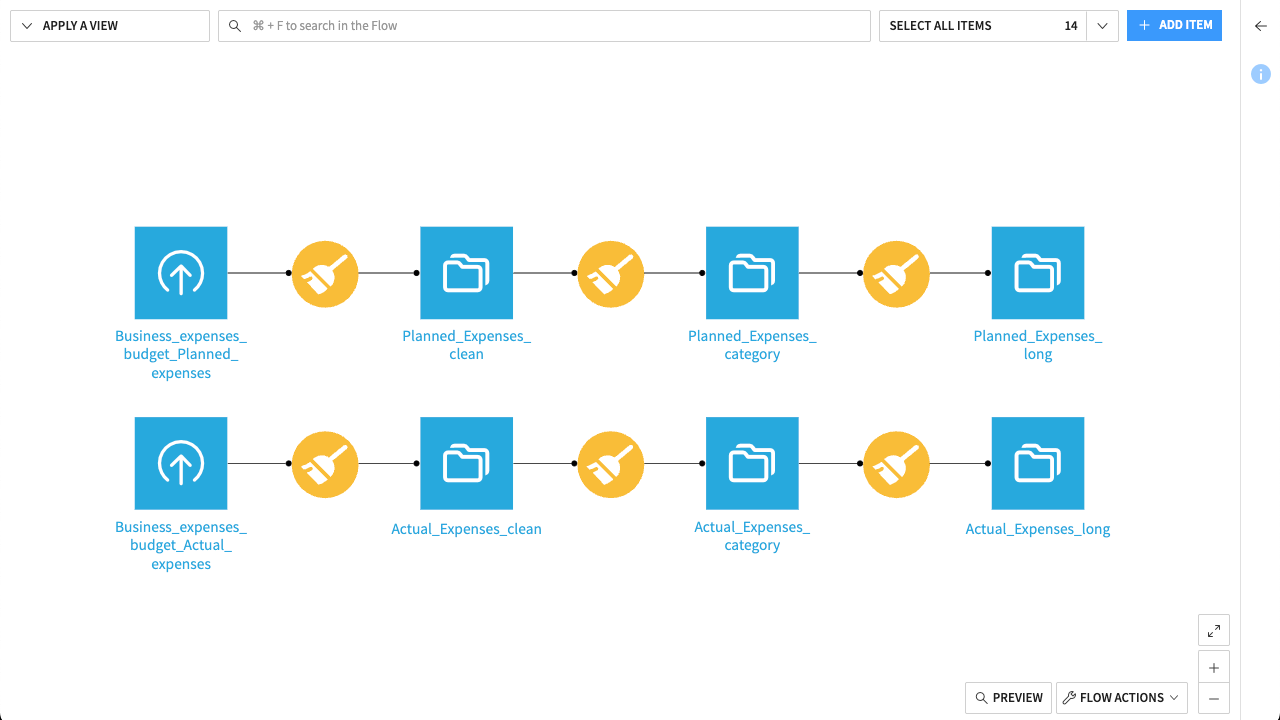
Once finished, your Flow should show two parallel branches—one for actual expenses and one for planned expenses—both leading to standardized long-format datasets.
Combine data#
To compare the actual and planned expenses effectively, you can stack them into a single dataset. To do so, use the Stack recipe (Dataiku’s version of a “Union” or “Append”).
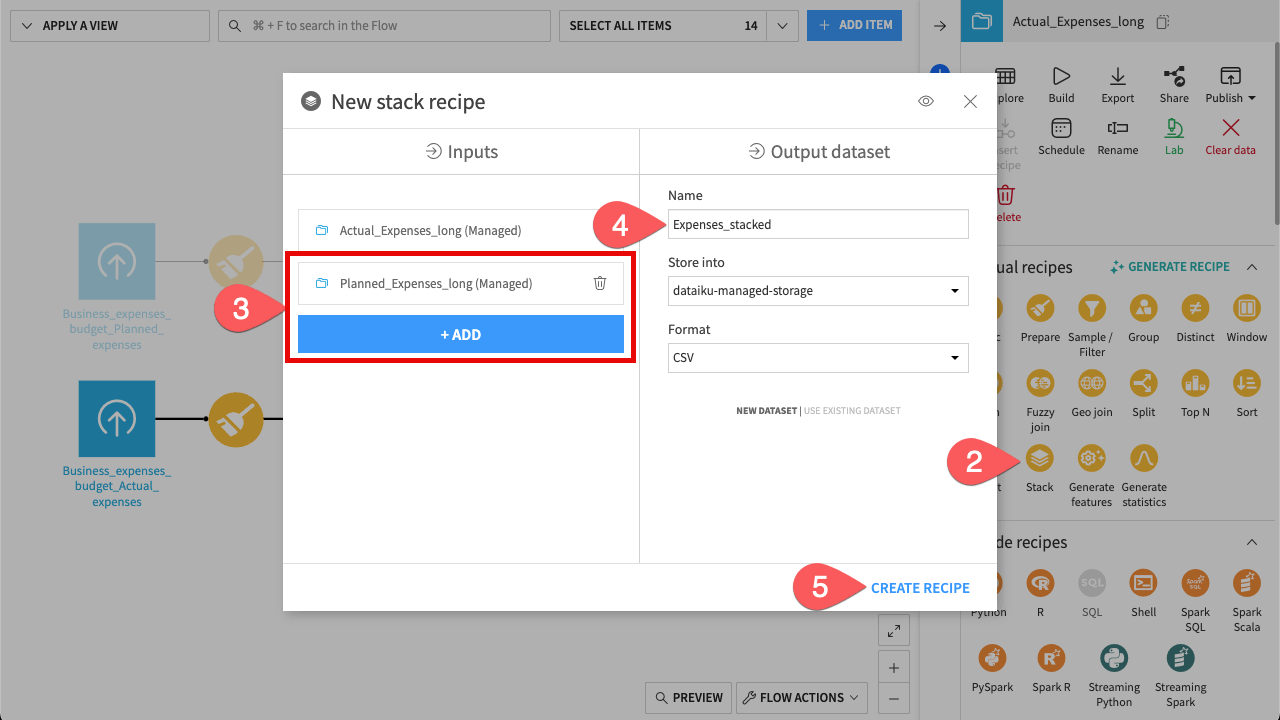
From the Flow, select the Actual_Expenses_long dataset.
In the Actions (
) sidebar, click the Stack icon.In the Inputs section, click + Add and select Planned_Expenses_long.
Name the Output dataset
Expenses_stacked.Click Create Recipe. You’ll see to the configuration page of the Stack recipe.
Since you’re combining two identical lists, it’s important to distinguish which rows are actual expenses and which are planned expenses. The Stack recipe can automatically generate this new column.
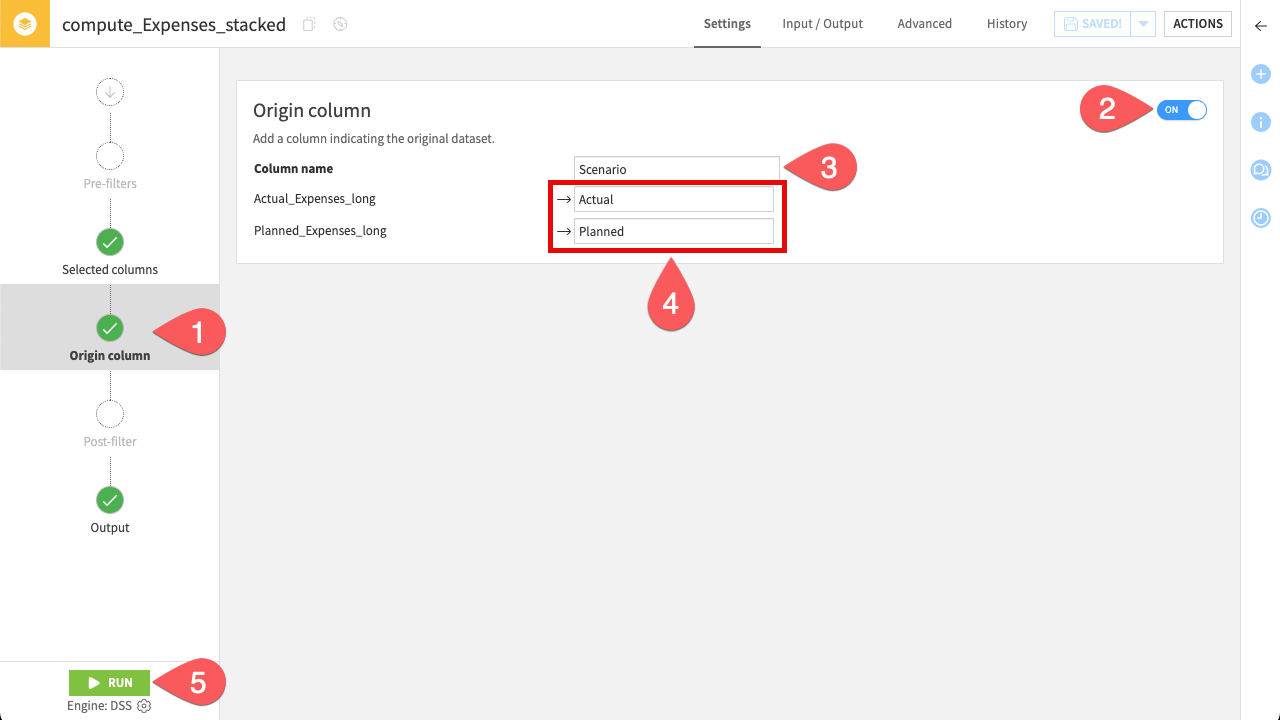
Go to the Origin column step on the left.
Toggle Origin column to ON.
Rename the Column name to
Scenario.Change the value to
Actualfor the first dataset, andPlannedfor the second dataset. These define the values that will populate the new column.Click Run.
When the job finishes, explore the output dataset. You’ll see both actual and planned expenses combined into a single dataset, with each row clearly distinguished by the new Scenario column.
Here is what your completed Flow should look like:
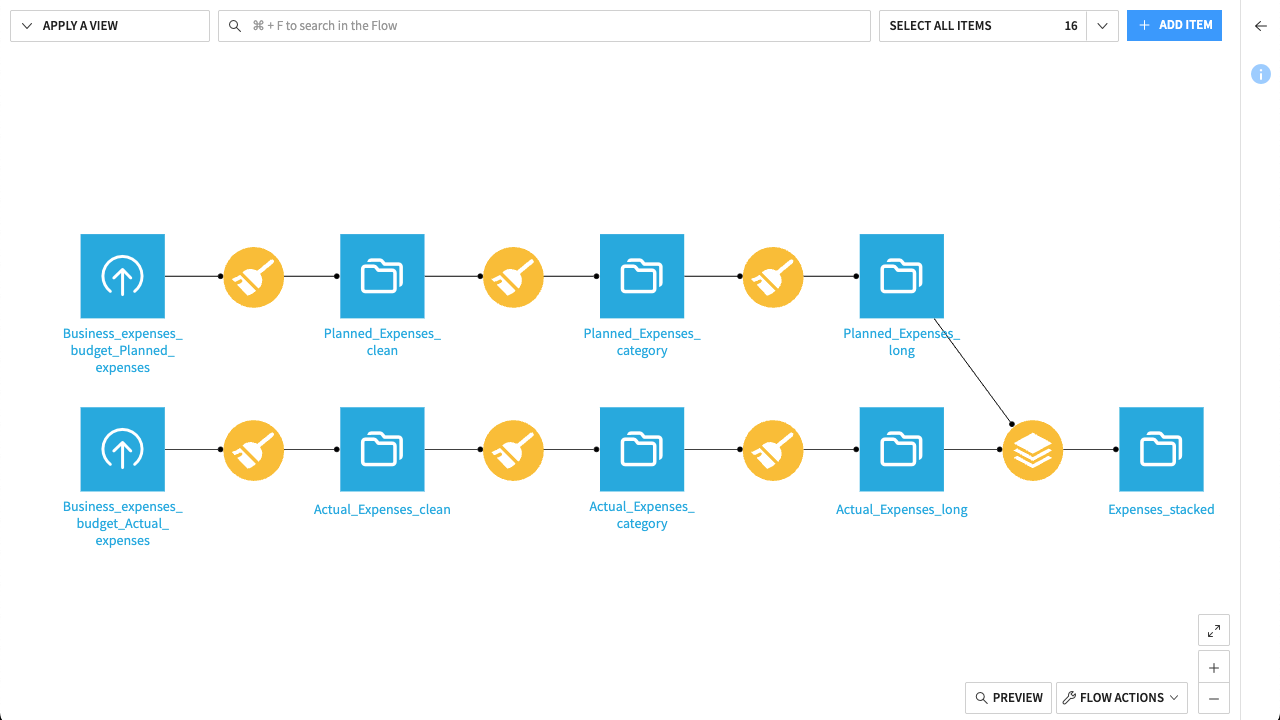
Your data is now in the perfect shape for financial analysis. Because you transformed it into a long format, you could now build dynamic dashboards and perform various types of analyses in the future—such as tracking monthly trends, comparing actual and planned expenses, or generating category-level summaries.
Important
In this tutorial, you manually uploaded an Excel file and processed specific sheets. While effective for a one-time analysis, you might want to automate this for recurring monthly reporting.
For production pipelines, avoid manual file uploads. We recommend using the Excel Sheet Importer plugin combined with a SQL connection like SharePoint or OneDrive. This combination allows you to:
Automatically import all sheets from a workbook at once (handling dynamic sheet names).
Trigger the Flow automatically whenever a new file is dropped into your SharePoint folder.
Next steps#
Congratulations! You’ve taken your first steps toward preparing financial data with Dataiku.
Mastering these data preparation fundamentals unlocks powerful capabilities for finance teams. While this Quick Start focused on the basics, the skills you’ve just learned enable you to tackle advanced use cases such as:
Smart reconciliation: Joining tables where IDs or names don’t match perfectly (fixing the common ‘VLOOKUP #N/A’ Excel issues).
Automated reporting: Automating the pulling in and validation of input data to refresh monthly reports in one click, ending the manual copy-paste cycle.
You’re now ready to begin the Core Designer learning path and challenge yourself to earn the Core Designer certificate.
If you’d like to check your work, you can download the completed version of this quick start from the Dataiku Gallery.
Additionally, keep an eye out for an extended version of this project, coming soon to the Gallery. This advanced version will demonstrate how to further automate your workflow using the Excel Sheet Importer plugin. This plugin is designed to automate your data pipelines by dynamically importing sheets from your workbooks—allowing you to build workflows that automatically adapt to new or changing Excel files without manual intervention.