
Concept | Unified Monitoring#
You may already be using the Deployer to move projects and API services into production environments. However, the Deployer also includes a third component for monitoring. You can access this component from the Deployer’s homepage and selecting Monitoring.
Once there, the Unified Monitoring page provides dashboards and tools for monitoring the health of activity across your instance and MLOps ecosystem more broadly.
Surfacing deployments and endpoints#
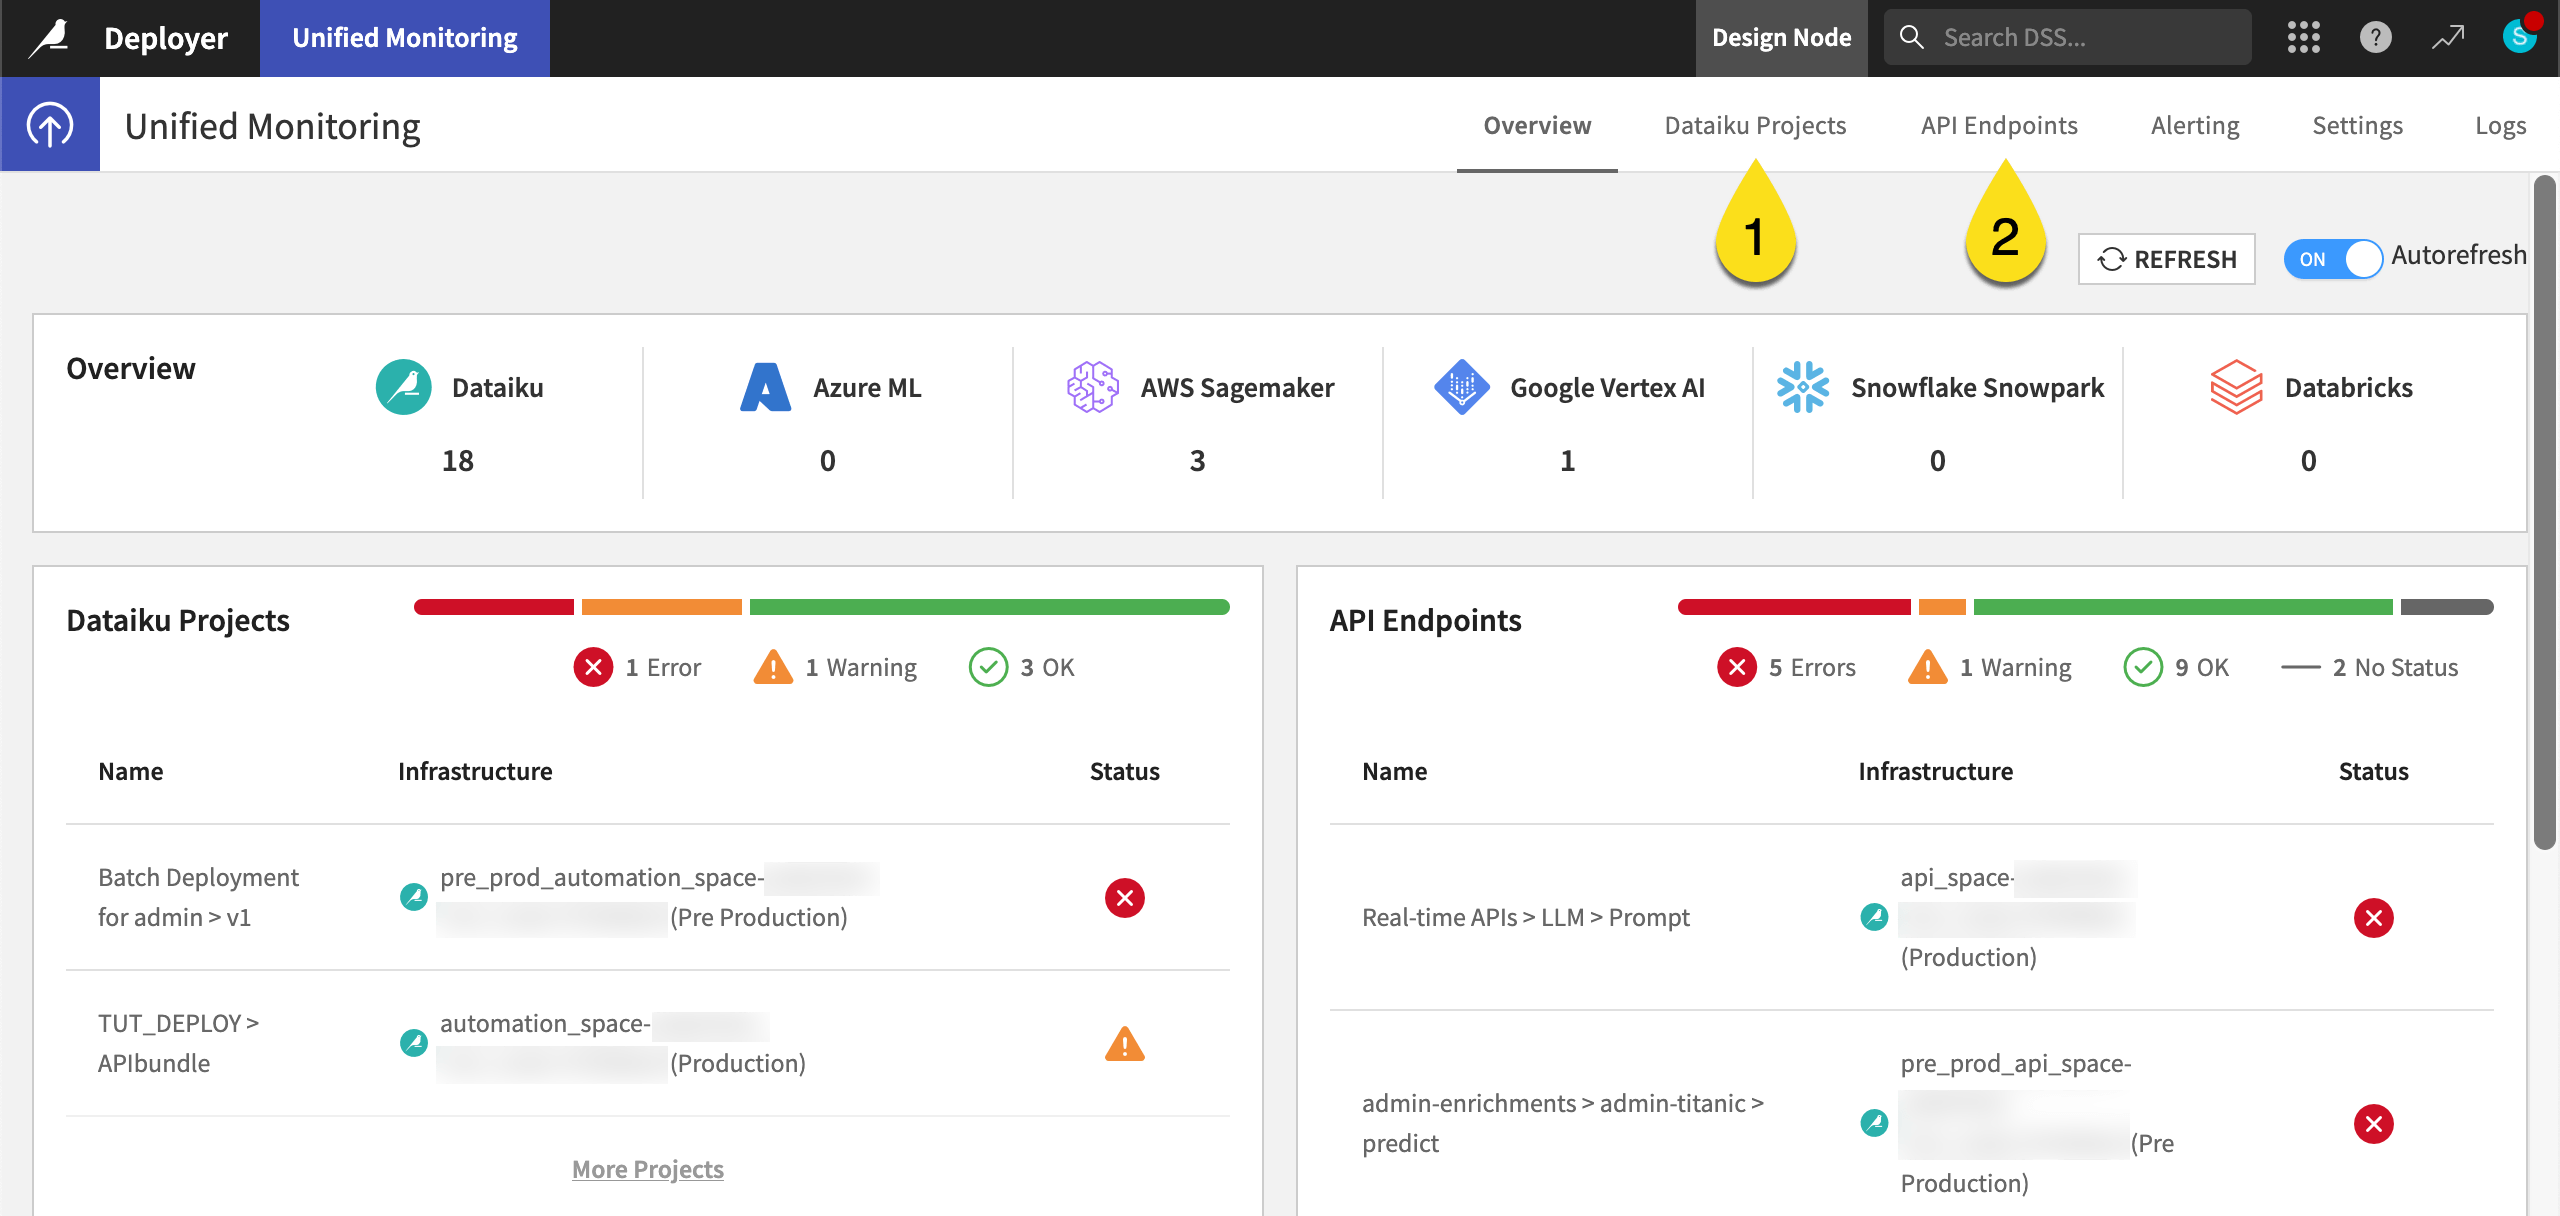
In addition to an Overview tab, the Unified Monitoring page surfaces deployment activity in two separate tabs: Dataiku Projects and API Endpoints.
The Dataiku Projects tab surfaces project bundles deployed on an Automation node.
The API Endpoints tab surfaces two types of endpoints:
The first type is endpoints of API services. This includes endpoints deployed to an infrastructure defined in the Deployer itself, but it also includes endpoints deployed to third-party infrastructures, such as Azure ML, Amazon SageMaker, Google Vertex AI, Snowflake Snowpark, or Databricks.
The second is external endpoints, which are those deployed to third-party infrastructures but which Dataiku doesn’t manage.
Tip
By default, the Unified Monitoring page surfaces all infrastructures on the Deployer. An administrator can use the Settings tab to select which infrastructures to monitor.
Interpreting monitoring statuses#
These two tabs of the Unified Monitoring page report a variety of statuses that indicate the health of a deployment in a particular area. The questions below can guide your understanding of how to move each of these statuses into the OK range.
Status |
Meaning |
|---|---|
Global |
What’s the most severe status from any of the other statuses? |
Deployment |
Is the deployment itself healthy? For example, it might report a warning if the active bundle on the Automation project doesn’t match the configured bundle or an error if the Deployer can’t reach the Automation node. |
Models |
Does the latest build of any model evaluation store return an error or warning? See the reference documentation on Understanding Model Status for details. |
Execution |
Does the latest run of any scenario return an error or warning? |
Data |
Does the latest computation of any data quality rule return an error or warning? |
Governance |
Does the deployment meet all requirements set by the Govern node? |
Important
These statuses aren’t computed in real-time. The default Synchronization interval is five minutes.
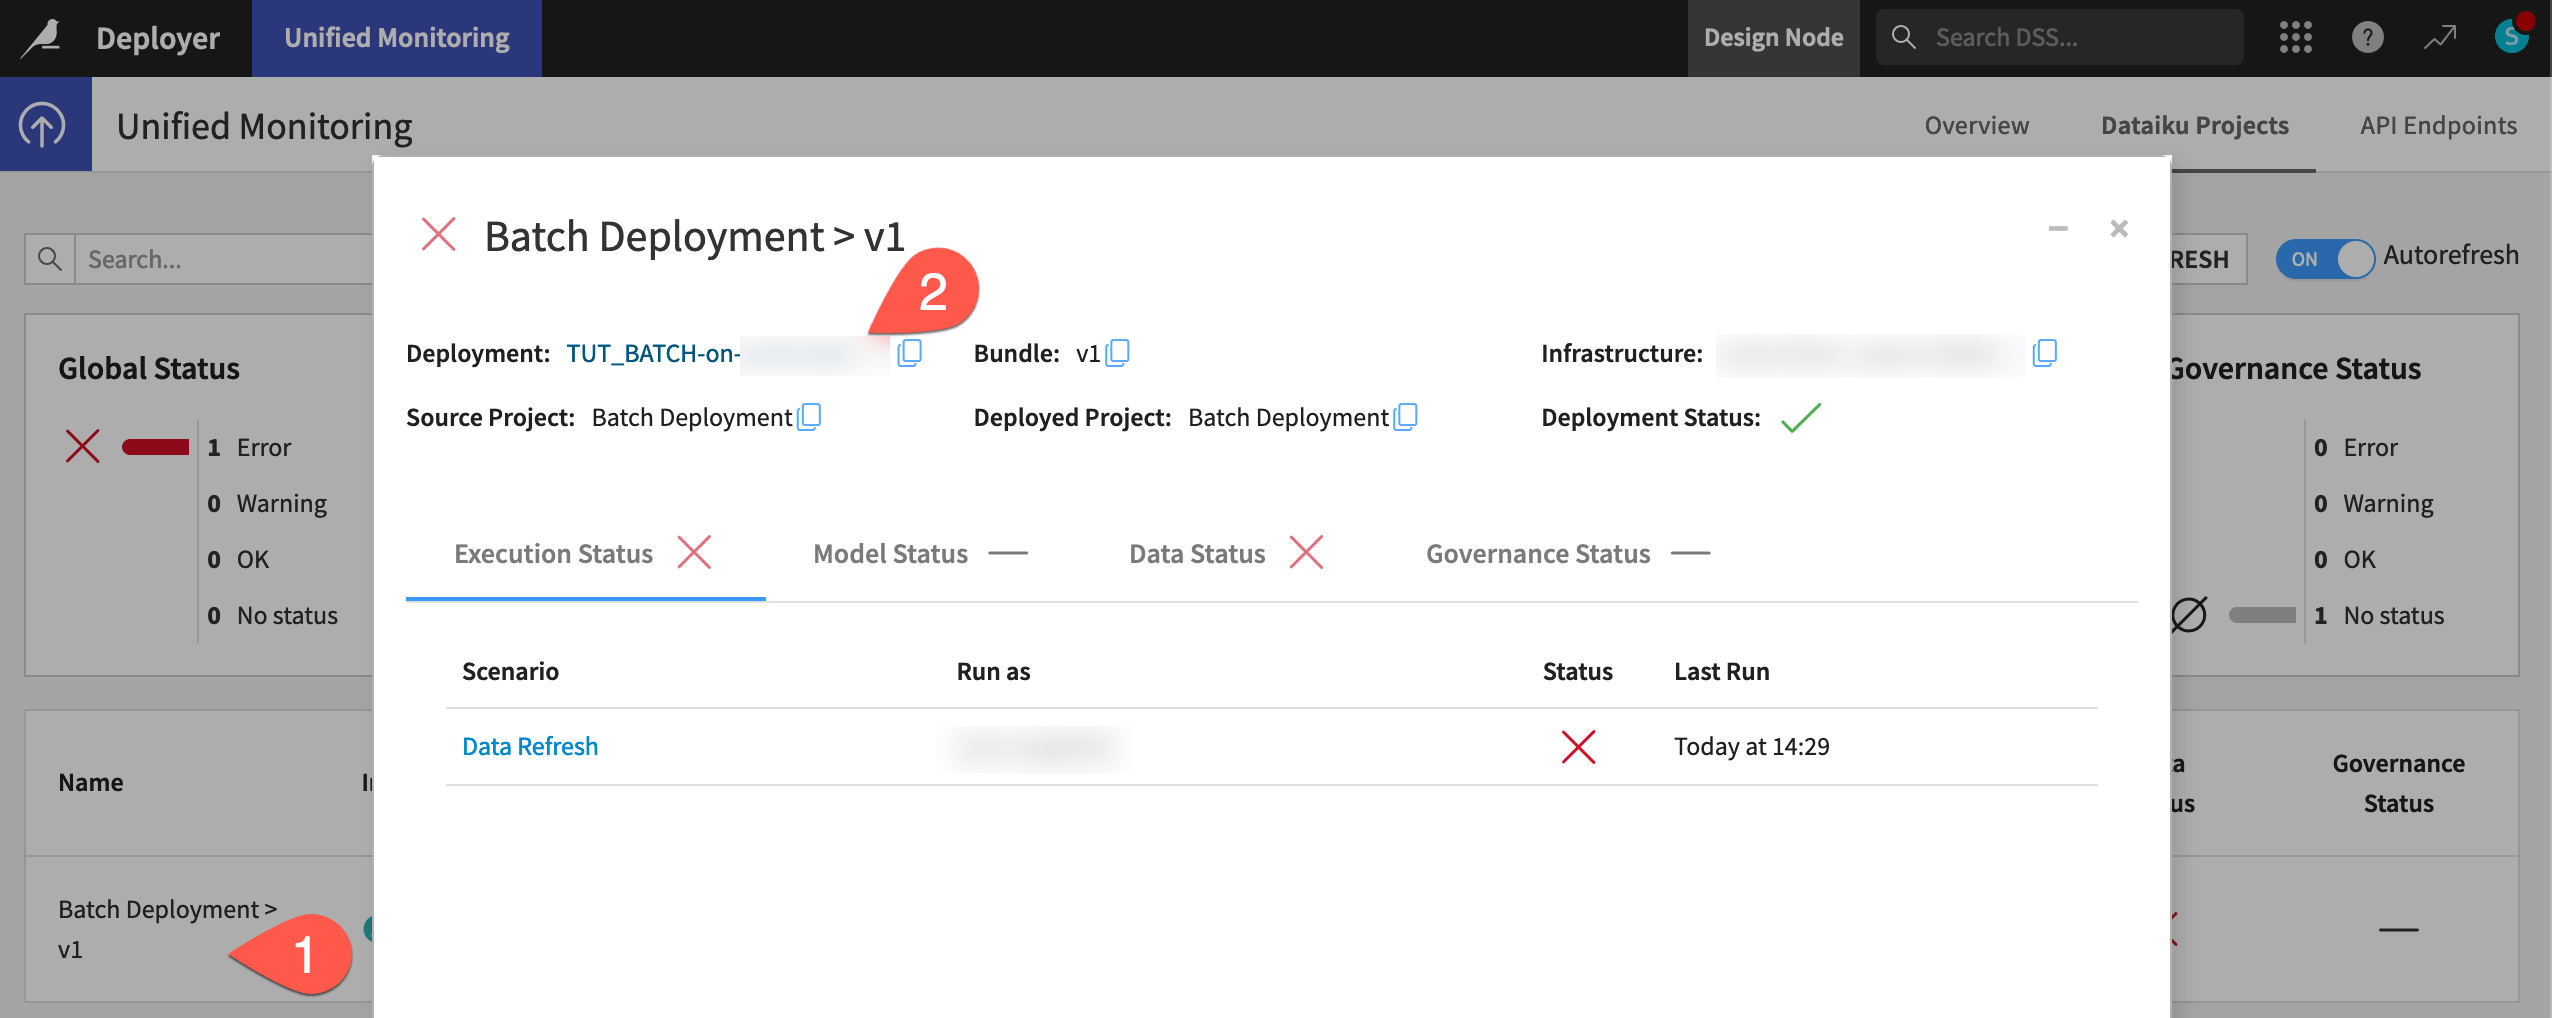
Inspecting deployments#
Clicking on a deployment in the Overview, Dataiku Projects, or API Endpoints tabs reveals more information that can lead you to the offending culprit. For example, this might be the failure of a scenario, a data quality rule, a model evaluation store check, etc.
Taking action on monitoring statuses#
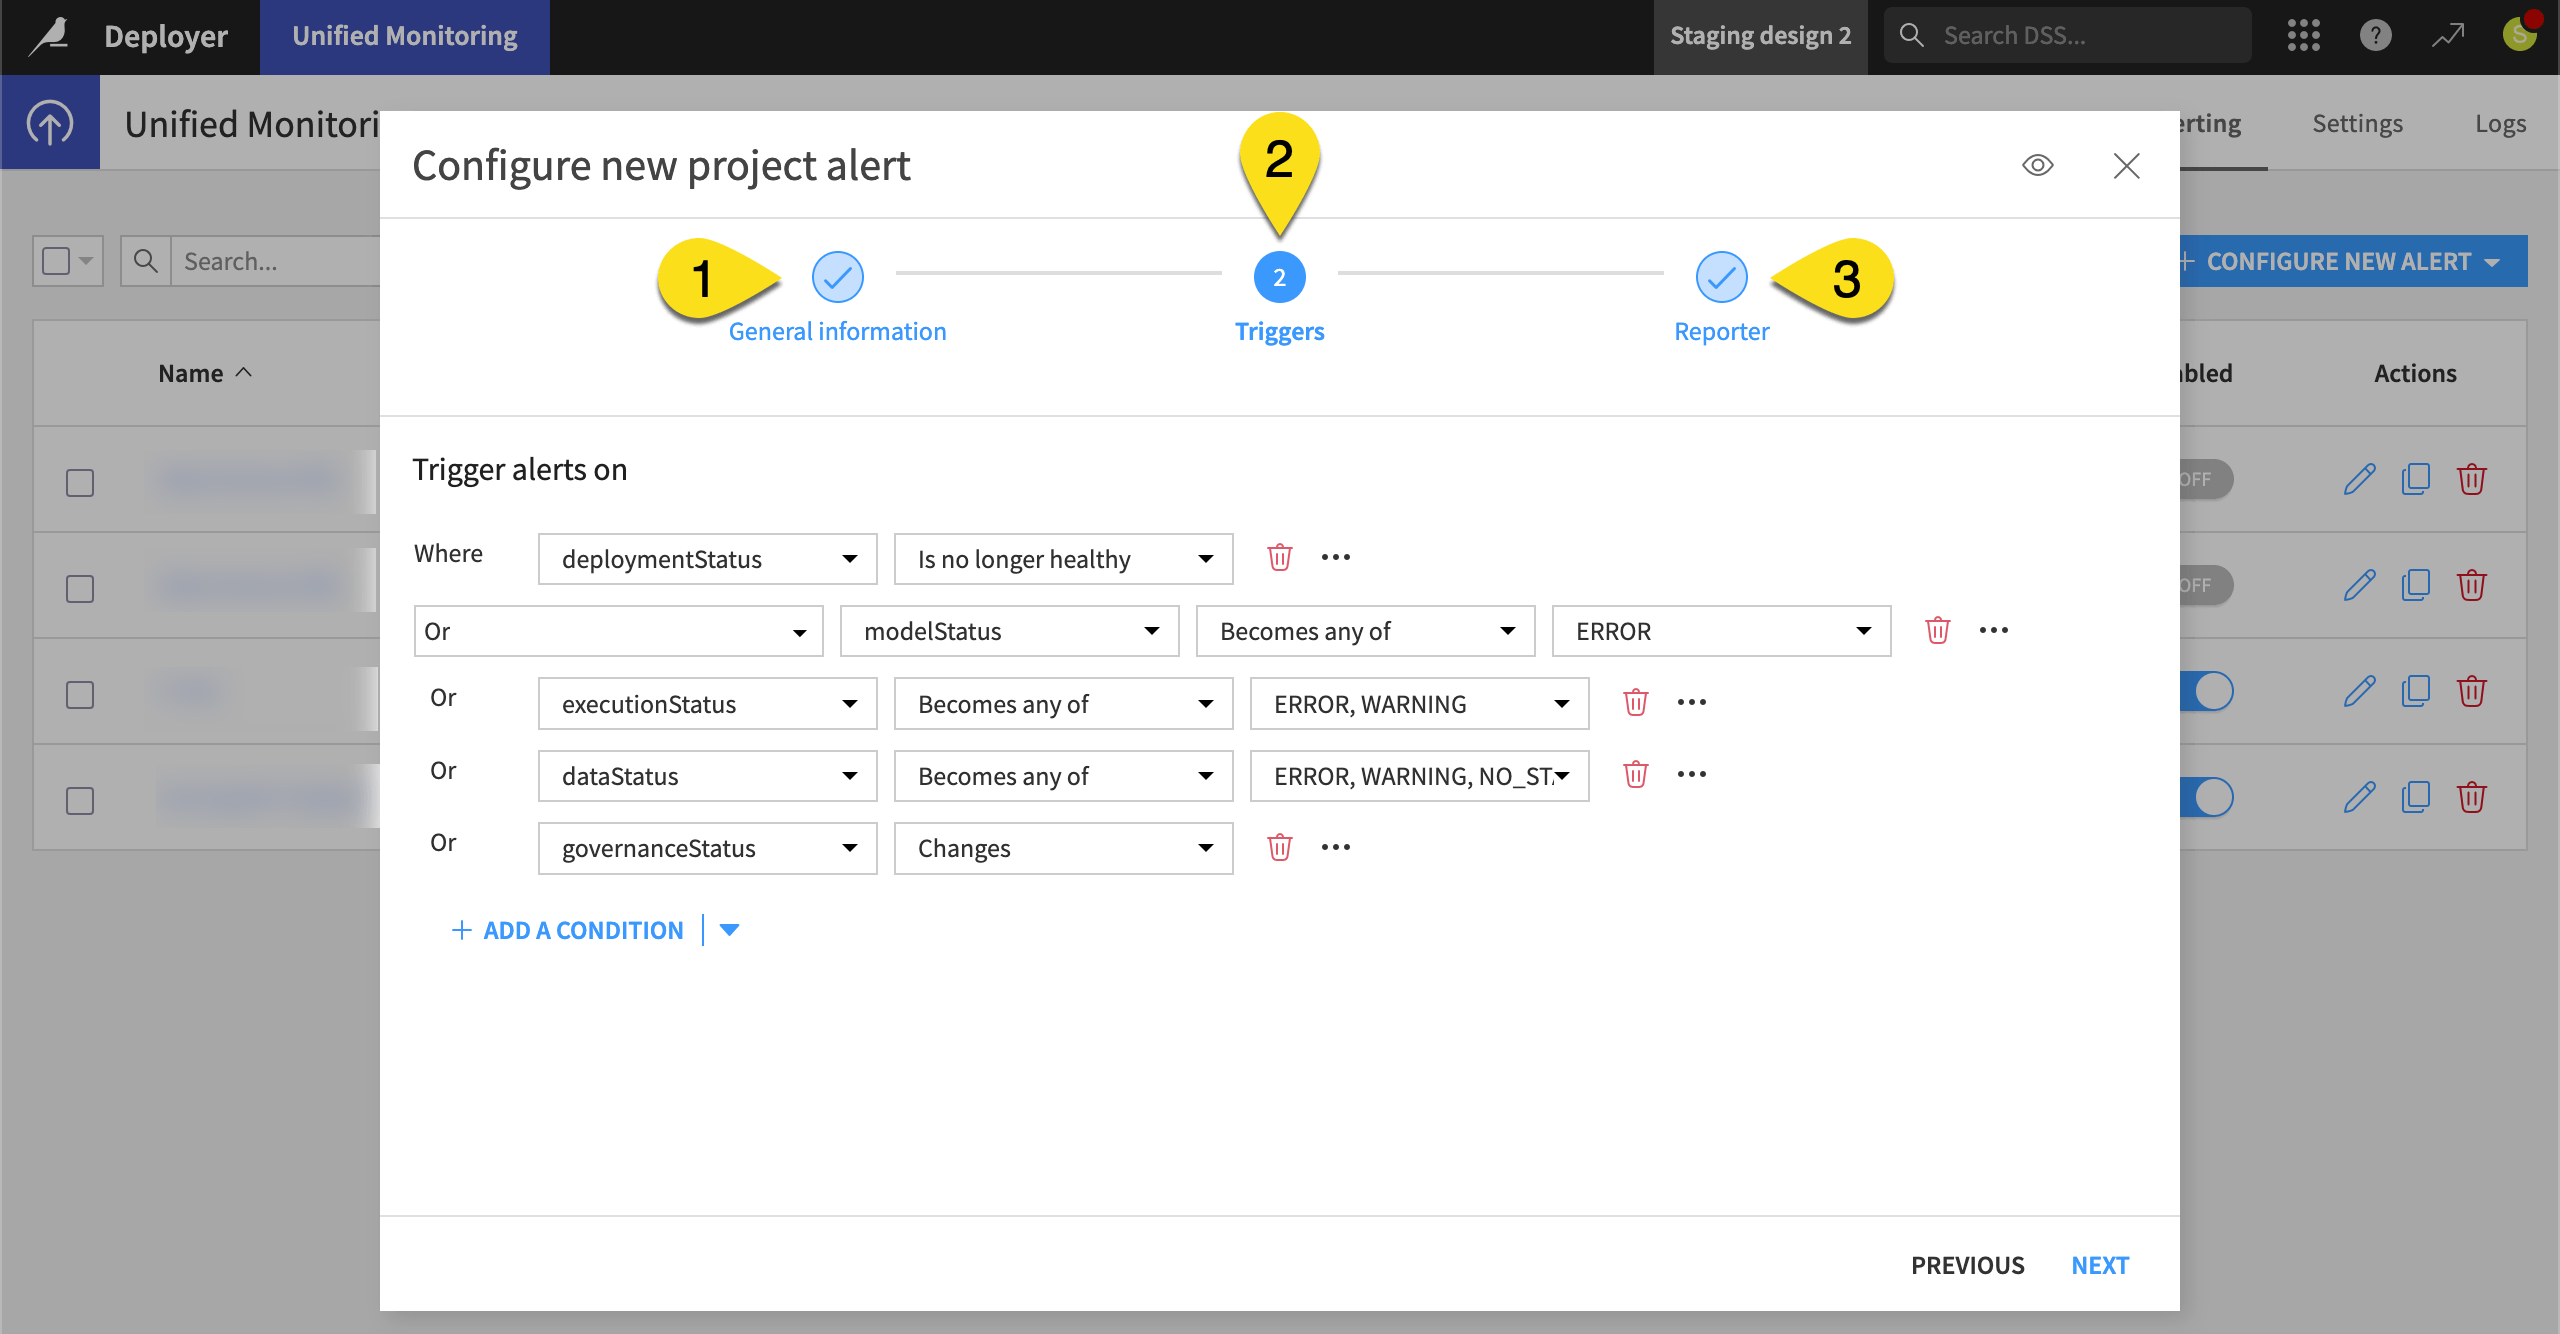
Using these monitoring statuses, admins can configure alerts to deliver actionable information to the relevant users.
In the Alerting tab of the Unified Monitoring page, admins can configure these alerts in three steps.
Define a scope. Admins must decide whether to configure the alert on a project, an endpoint, or an external endpoint, and to which infrastructure the alert should apply.
Define a trigger. Admins must decide the event that should send the alert. For example, whether any of the statuses change or become a certain value.
Define a reporter. Similar to those found in scenarios, admins must attach a reporter using a messaging channel.
Watch a featurette on alerting capabilities

See also
Admins designing alerts should see the reference documentation on Unified Monitoring Alerting to learn more.