Tutorial | API endpoint monitoring#
Get started#
After deploying an API service, the next logical step is to set up a monitoring system. By centralizing the logs from the API node, you can start monitoring the responses of endpoints. Let’s see how you can do this in Dataiku!
Objectives#
In this tutorial, you will:
Store API endpoint prediction logs into an usable data storage.
Use these logs to build a feedback loop monitoring data drift.
Prerequisites#
Dataiku 13.2 or later to use the streamlined method shown here. Users on older versions can use a manual method.
A Full Designer user profile on the Dataiku for AI/ML or Enterprise AI packages.
An active deployment of an API service including a prediction endpoint. If you don’t already have this, see Tutorial | Deploy an API service to a production environment to create one.
Dataiku 12.0 or later.
A Full Designer user profile on the Dataiku for AI/ML or Enterprise AI packages.
An active deployment of an API service including a prediction endpoint. If you don’t already have this, see Tutorial | Deploy an API service to a production environment to create one.
A correctly-configured Event server:
A person with administrator permissions on an instance of Dataiku can follow the reference documentation to set up The DSS Event Server on a Design or Automation node.
After setting up the Event server, the admin should follow the reference documentation on Configuration for API nodes.
Create the project#
You can complete this tutorial with any project that includes an active API deployment including a prediction endpoint. For demonstration, you’ll reuse the project created in Tutorial | Deploy an API service to a production environment.
Locate API audit logs#
You can use the audit logs of the API node for several different use cases:
Understand the user base of the API service through information such as the IP address and timestamp for each query.
Check the health of the API, for instance, by monitoring its response time.
Monitor the API predictions for data drift (shown in this tutorial).
Implement an ML feedback loop. In the case of a machine learning model trained on a few data points, you can use the queries sent to the API, after manual relabelling, to retrain the original model with more data.
The first step is finding where the audit logs of the API node are stored.
As explained in Audit trail on Dataiku Cloud, these logs will be in an S3 connection called customer-audit-log.
Self-managed instances use the Event server. For users who aren’t also instance administrators, the Event server operates in the background.
The Event server is a Dataiku component that allows for the monitoring of API nodes. API nodes can send event logs to the Event server, and in turn, the Event server will take care of sorting and storing the logs in an accessible place.
In more detail, the Event server centralizes all queries that the API node receives and the responses an API service returns. The Event server then makes these logs available as a dataset that one can use in a Dataiku project.
Send test queries to the API endpoint#
The next step is to confirm that the API endpoint is an active deployment.
Send at least one test query from the Run and Test tab of the API deployment or submit Sample code in a terminal.
If these tests fail, return to Tutorial | Deploy an API service to a production environment for guidance on deploying an API service.
Create a monitoring feedback loop#
Your goal is to import the logs from these queries into the Design node for analysis, and in particular, use them to monitor the model’s predictions.
Return to the API service on the Design node project.
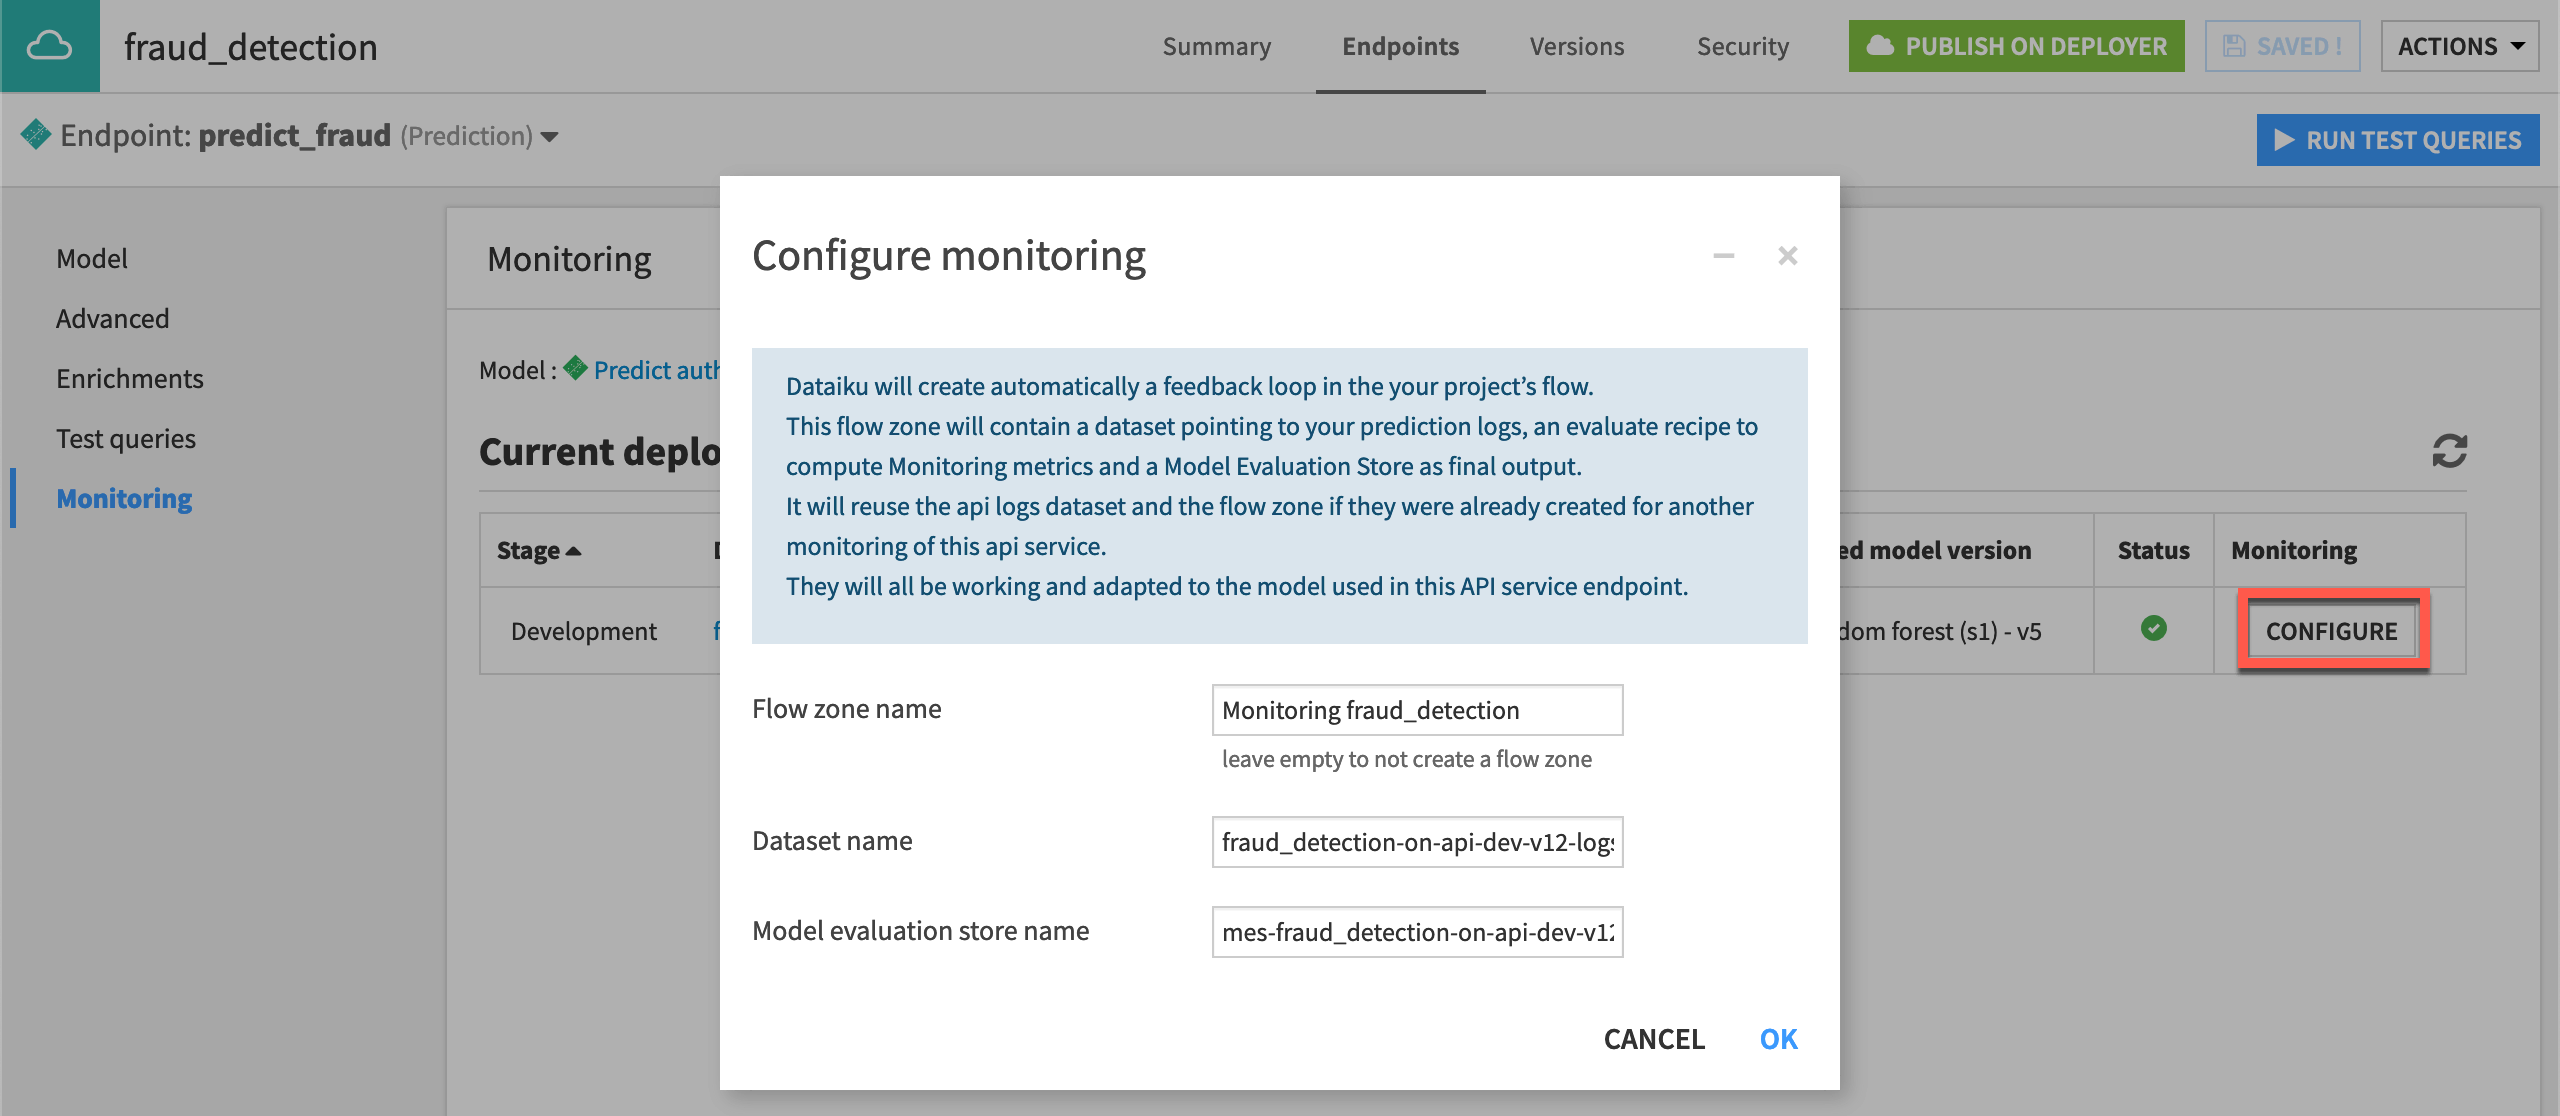
For the prediction endpoint inside this service, navigate to the Monitoring panel, where you should see details of current deployments.
Click Configure to set up the monitoring loop.
Click OK.

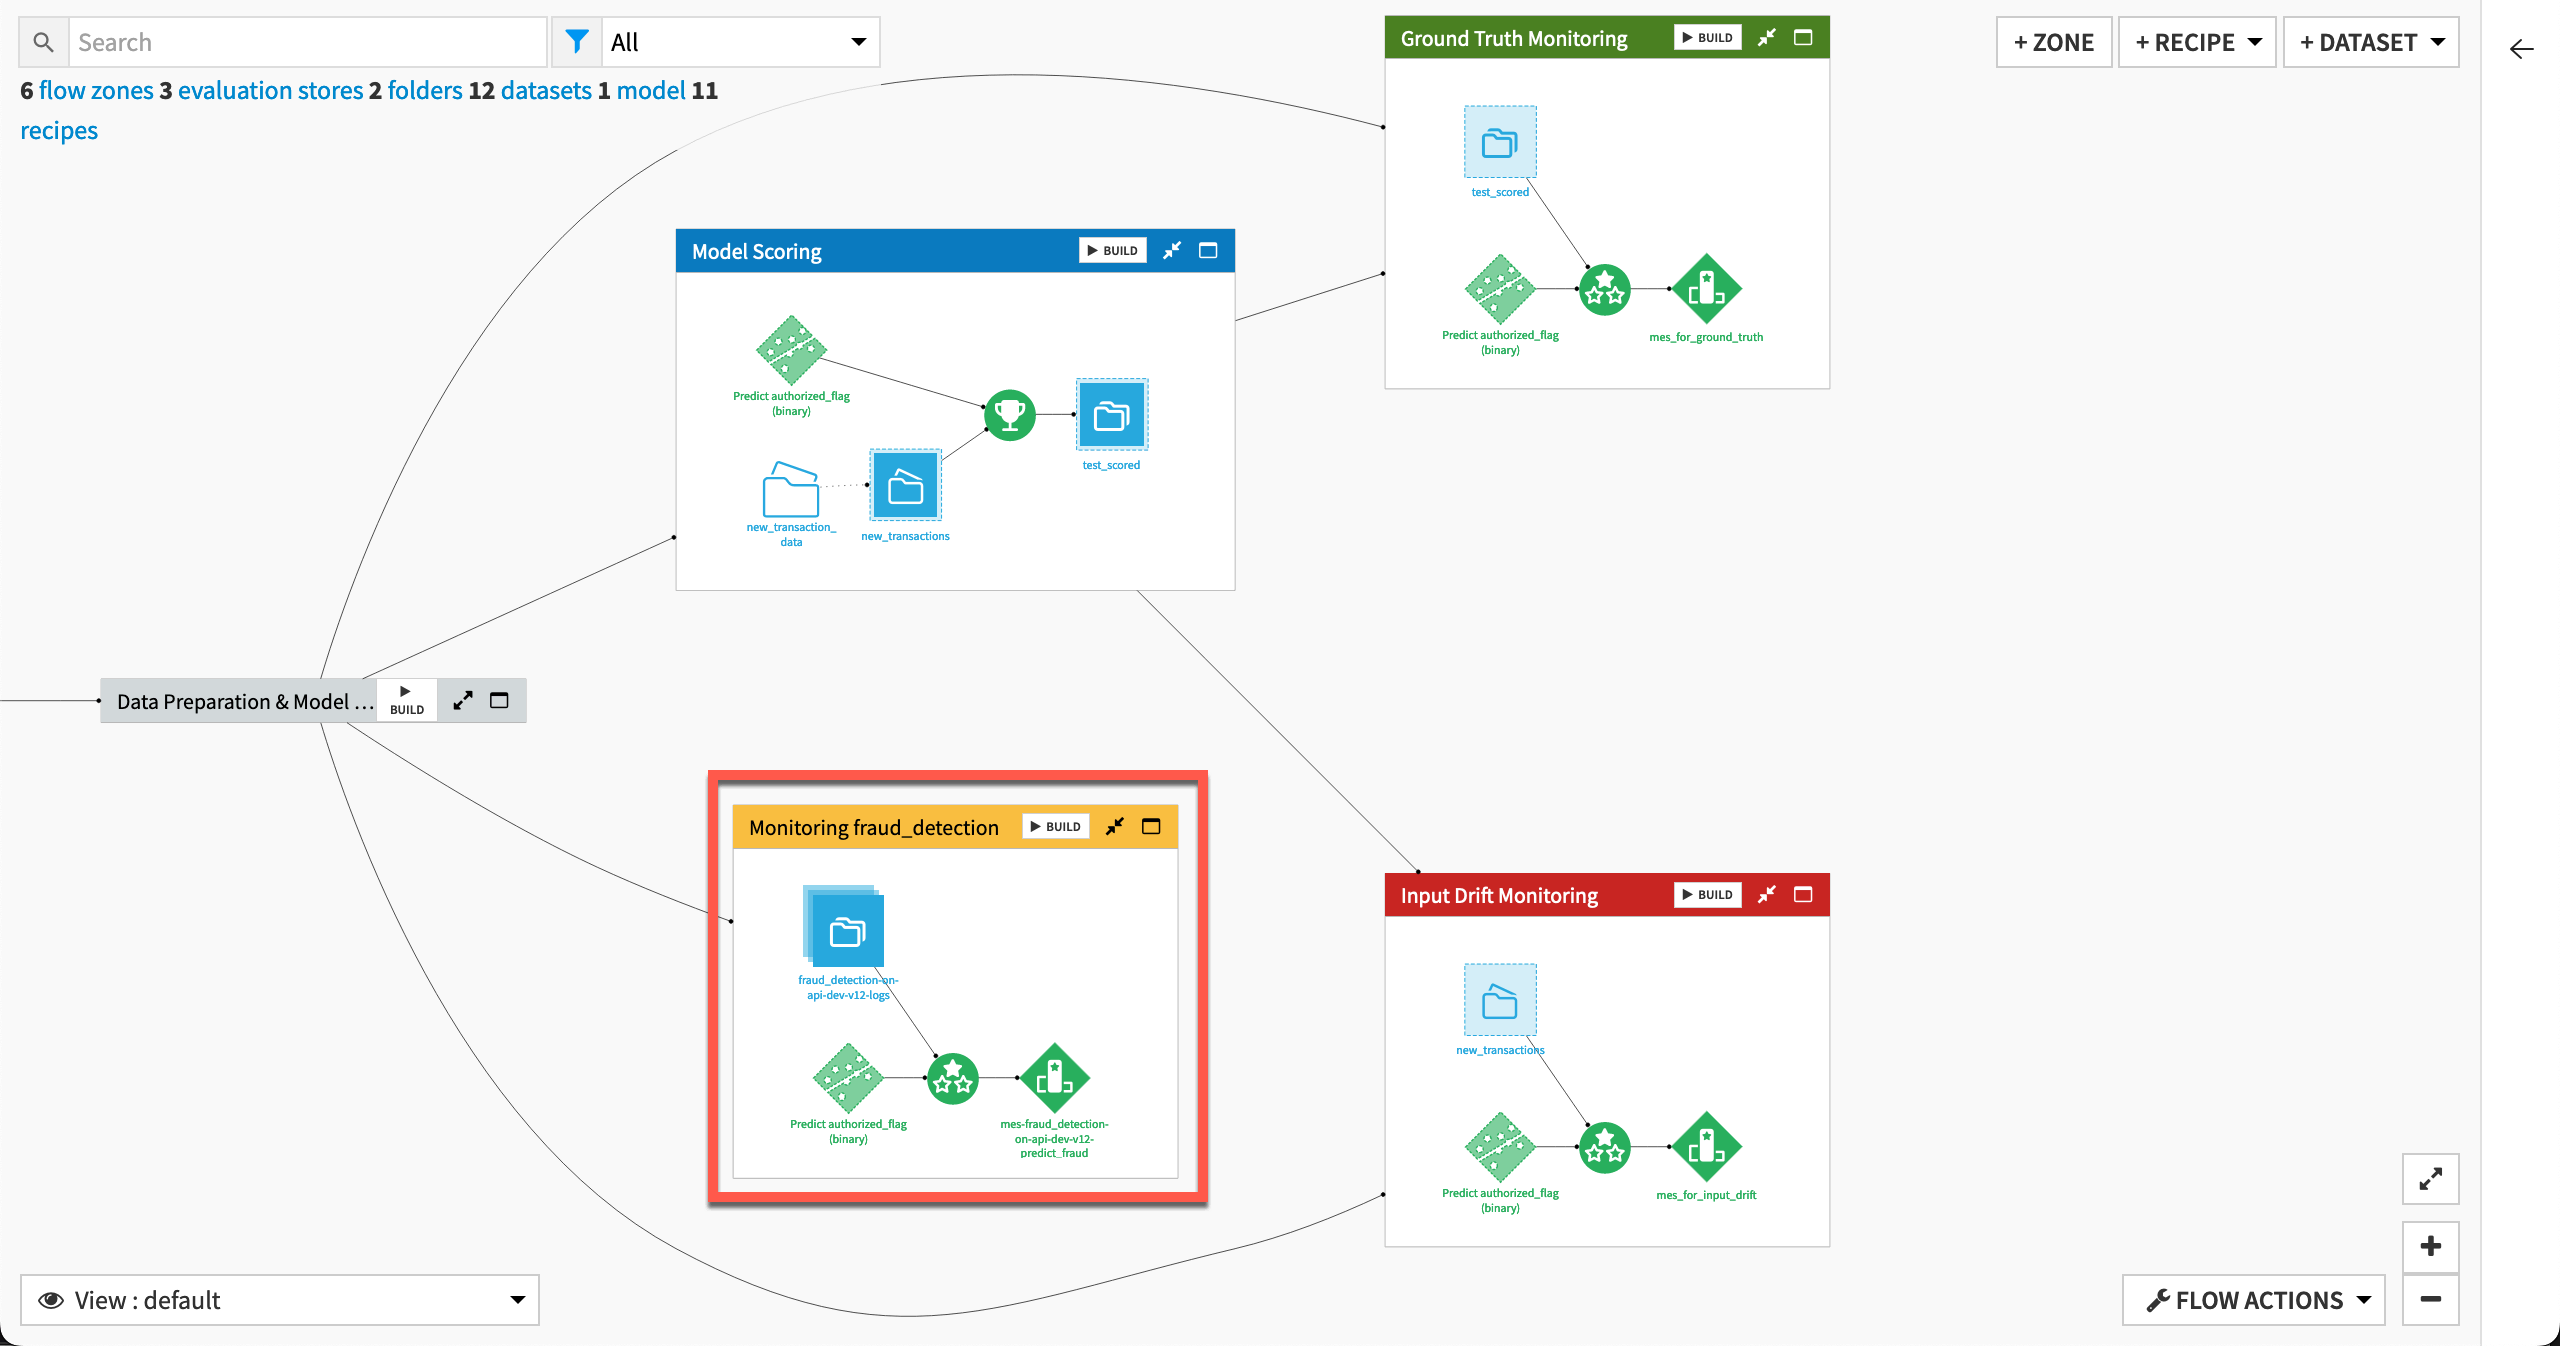
Return to the Flow.
If using Dataiku Cloud, move the API log data and the model evaluation store to a new Flow zone named
API Endpoint Monitoring.
Missing the Monitoring panel in the API service?
If you don’t have a Monitoring panel in your API service, you have an older version of Dataiku. Still, you can achieve the same outcome in a manual way.
Import API logs into the Design node
If using Dataiku Cloud, follow Audit trail on Dataiku Cloud. You’ll find the logs under + Add Item > Connect or create > Amazon S3 and the connection customer-audit-log.
If using a self-managed instance, follow the instructions below:
If you have admin access, navigate to Administration > Settings > Event Server, and find the requested values below for the target destination. Otherwise, you’ll need to ask your admin.
In the Flow, click + Add Item > Connect or create > Files in folder.
Under Read from, choose the connection set as the destination target for the Event server.
Click Browse and choose the path associated within the above connection.
Select api-node-query, and then the name of the API deployment, which by default follows the syntax
PROJECTKEY-on-INFRASTRUCTURE.Click OK, and then Create to import this dataset of API logs.
Set up the API Endpoint Monitoring Flow zone
Use this log dataset as the input to an Evaluate recipe that will monitor data drift.
Select the log dataset from the Flow, and click Move to a Flow zone from the Actions tab of the right panel.
Click New Zone. Provide the name
API Endpoint Monitoring, and click Confirm.Select the log dataset in the new Flow zone, and choose the Evaluate recipe from the Actions tab.
Add the prediction model as the second input.
Set
mes_for_api_monitoringas the Evaluation store output.Click Create Recipe.
Let’s review what this action did. The Flow now contains a new zone dedicated to monitoring this API deployment, including three objects:
API log data, partitioned by day (stored in the connection detailed above)
An Evaluate recipe with the API log data and saved model as inputs
A model evaluation store as output to the Evaluate recipe

Inspect the API log data#
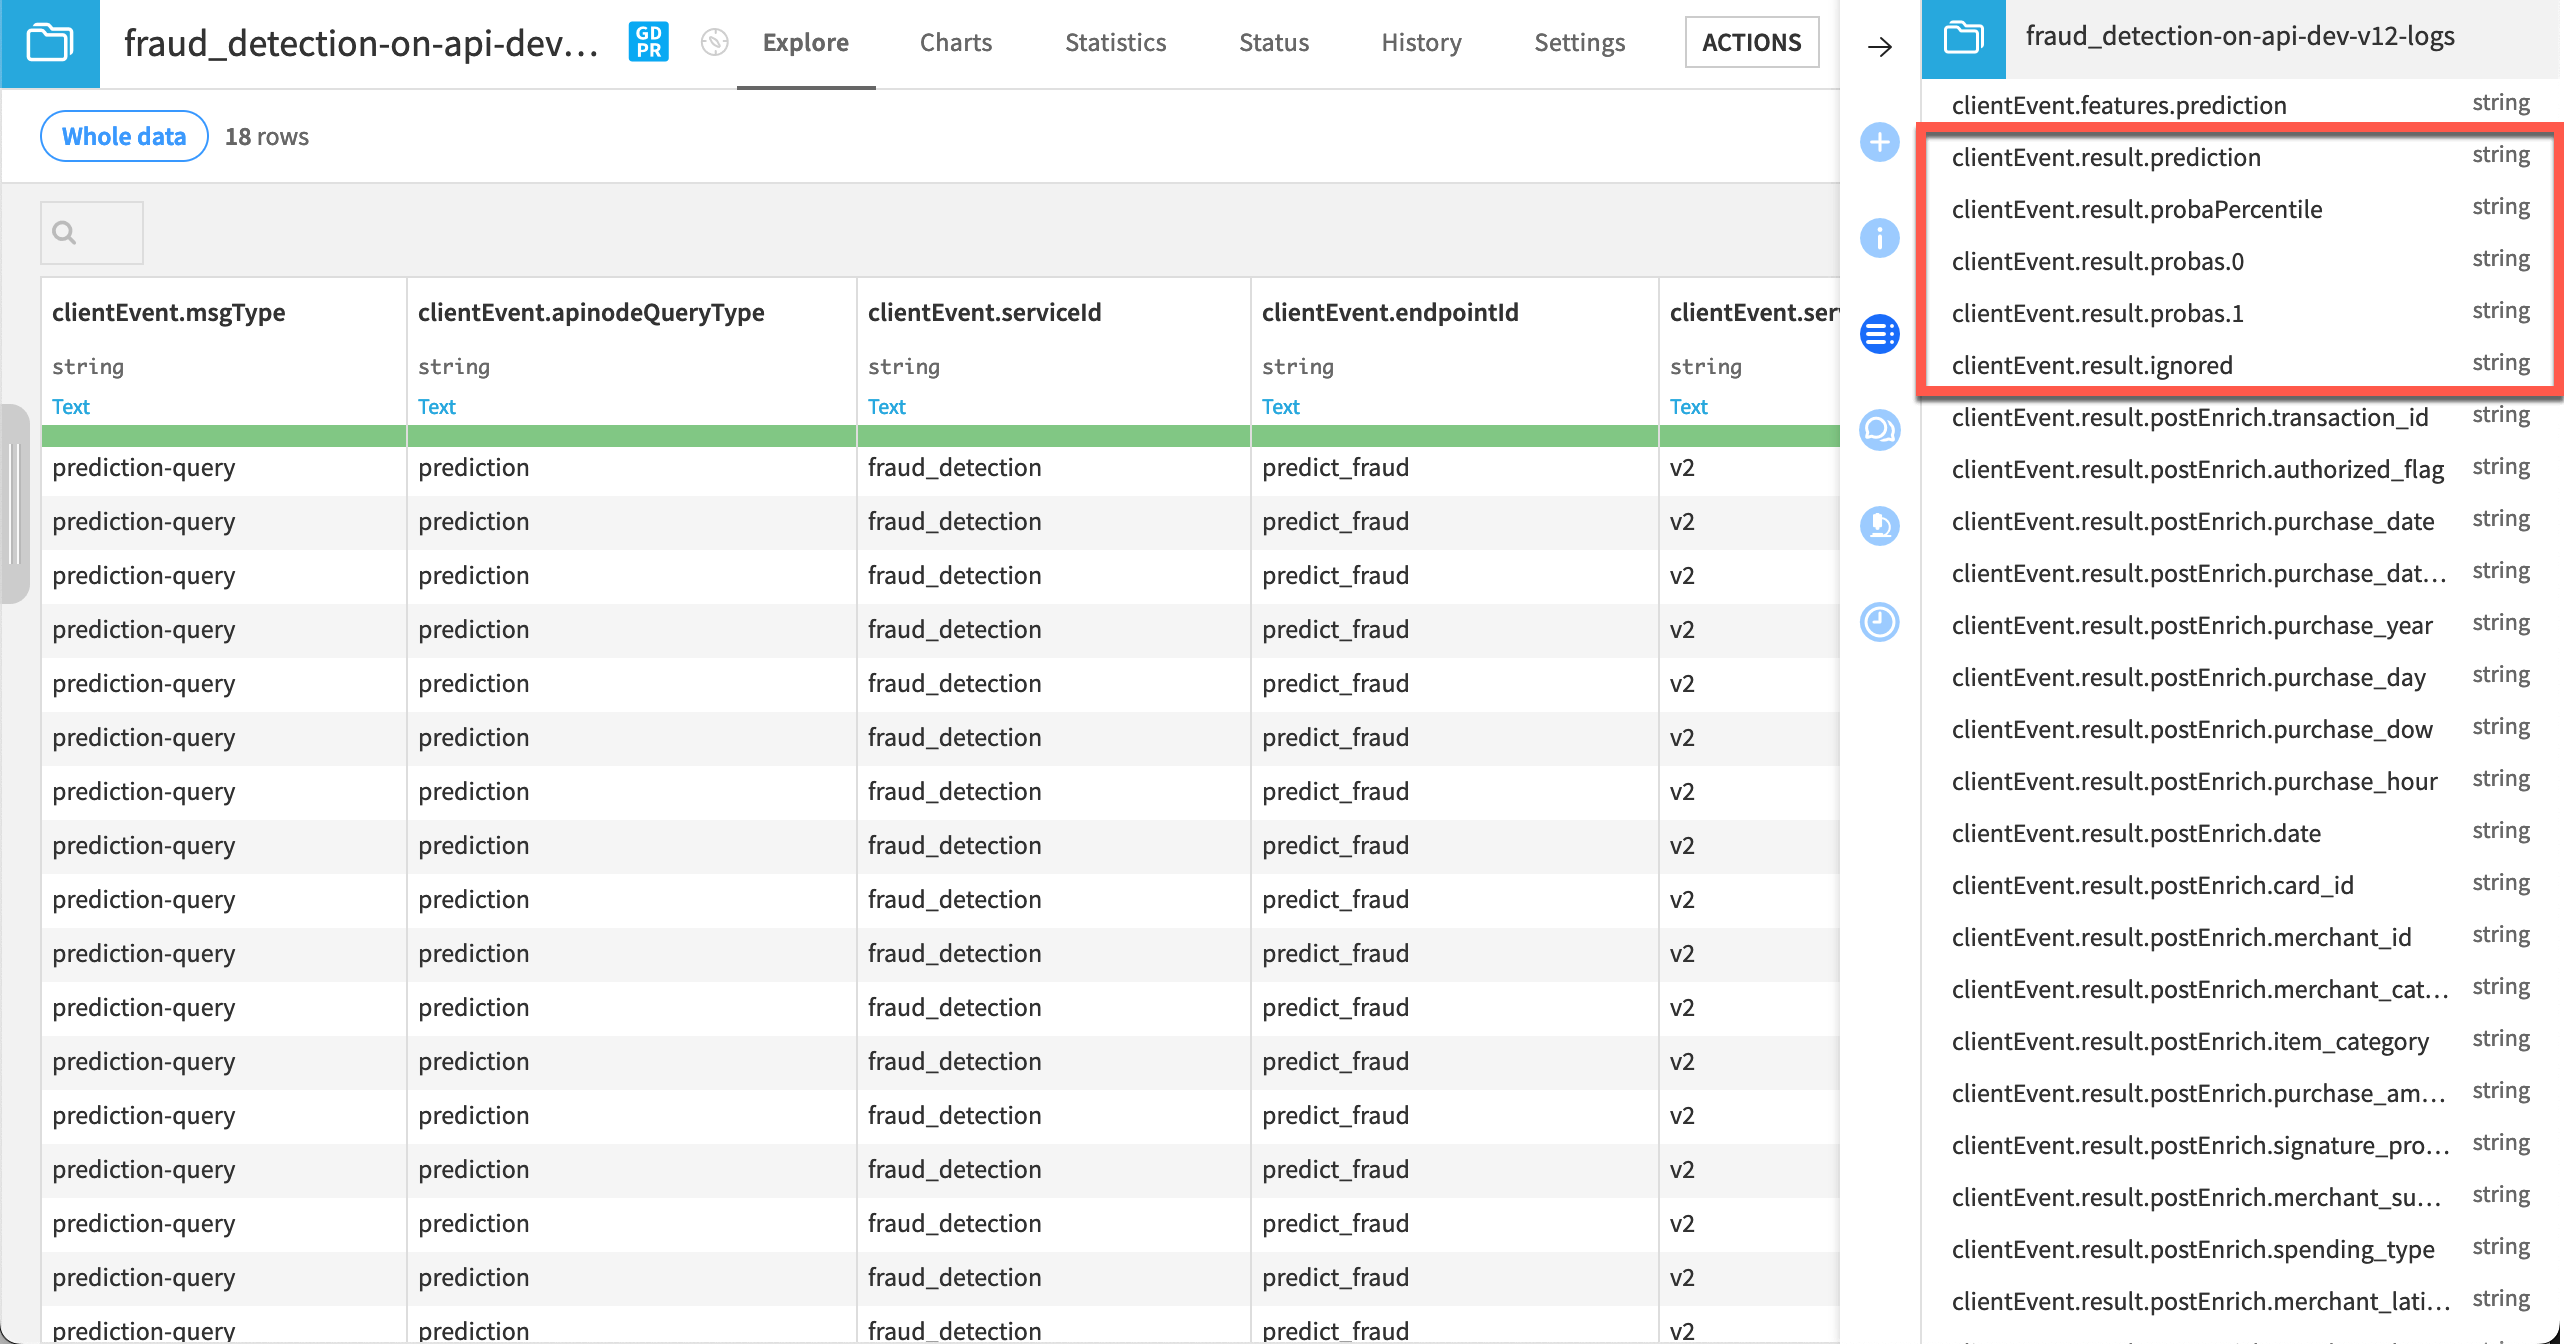
Each row of the API log data corresponds to one actual prediction request answered by the model.
The exact columns may vary depending on the type of endpoint. This tutorial uses a prediction model, but it won’t be exactly the same for an enrichment or a custom Python endpoint.
Scrolling through the columns, you’ll find:
Basic information like the ID of the service, endpoint, its generation, deployment infrastructure, and model version.
Timing details.
All requested features.
The prediction results.
Additional information like IP address and the server timestamp.

Tip
Return to the sample queries you submitted to the endpoint and confirm for yourself that these are the same queries. In this example, in addition to queries from Tutorial | Deploy an API service to a production environment, the dataset also has queries from Tutorial | Model monitoring in different contexts.
Inspect the Evaluate recipe#
Before running it, take a moment to compare this particular Evaluate recipe to the others you would have seen in Tutorial | Model monitoring with a model evaluation store.
In the Evaluation dataset tile of the Settings tab, note the presence of an option to Handle dataset as API node logs. Even though the API node data has a different schema than the input data to the other Evaluate recipes, Dataiku is able to automatically recognize API node logs and ingest it without additional configuration.
The Model tile also has additional options to filter rows on model version and deployment ID. This setting matches model versions between the active model version in the Flow and the model version used when scoring the rows retrieved from the API node.

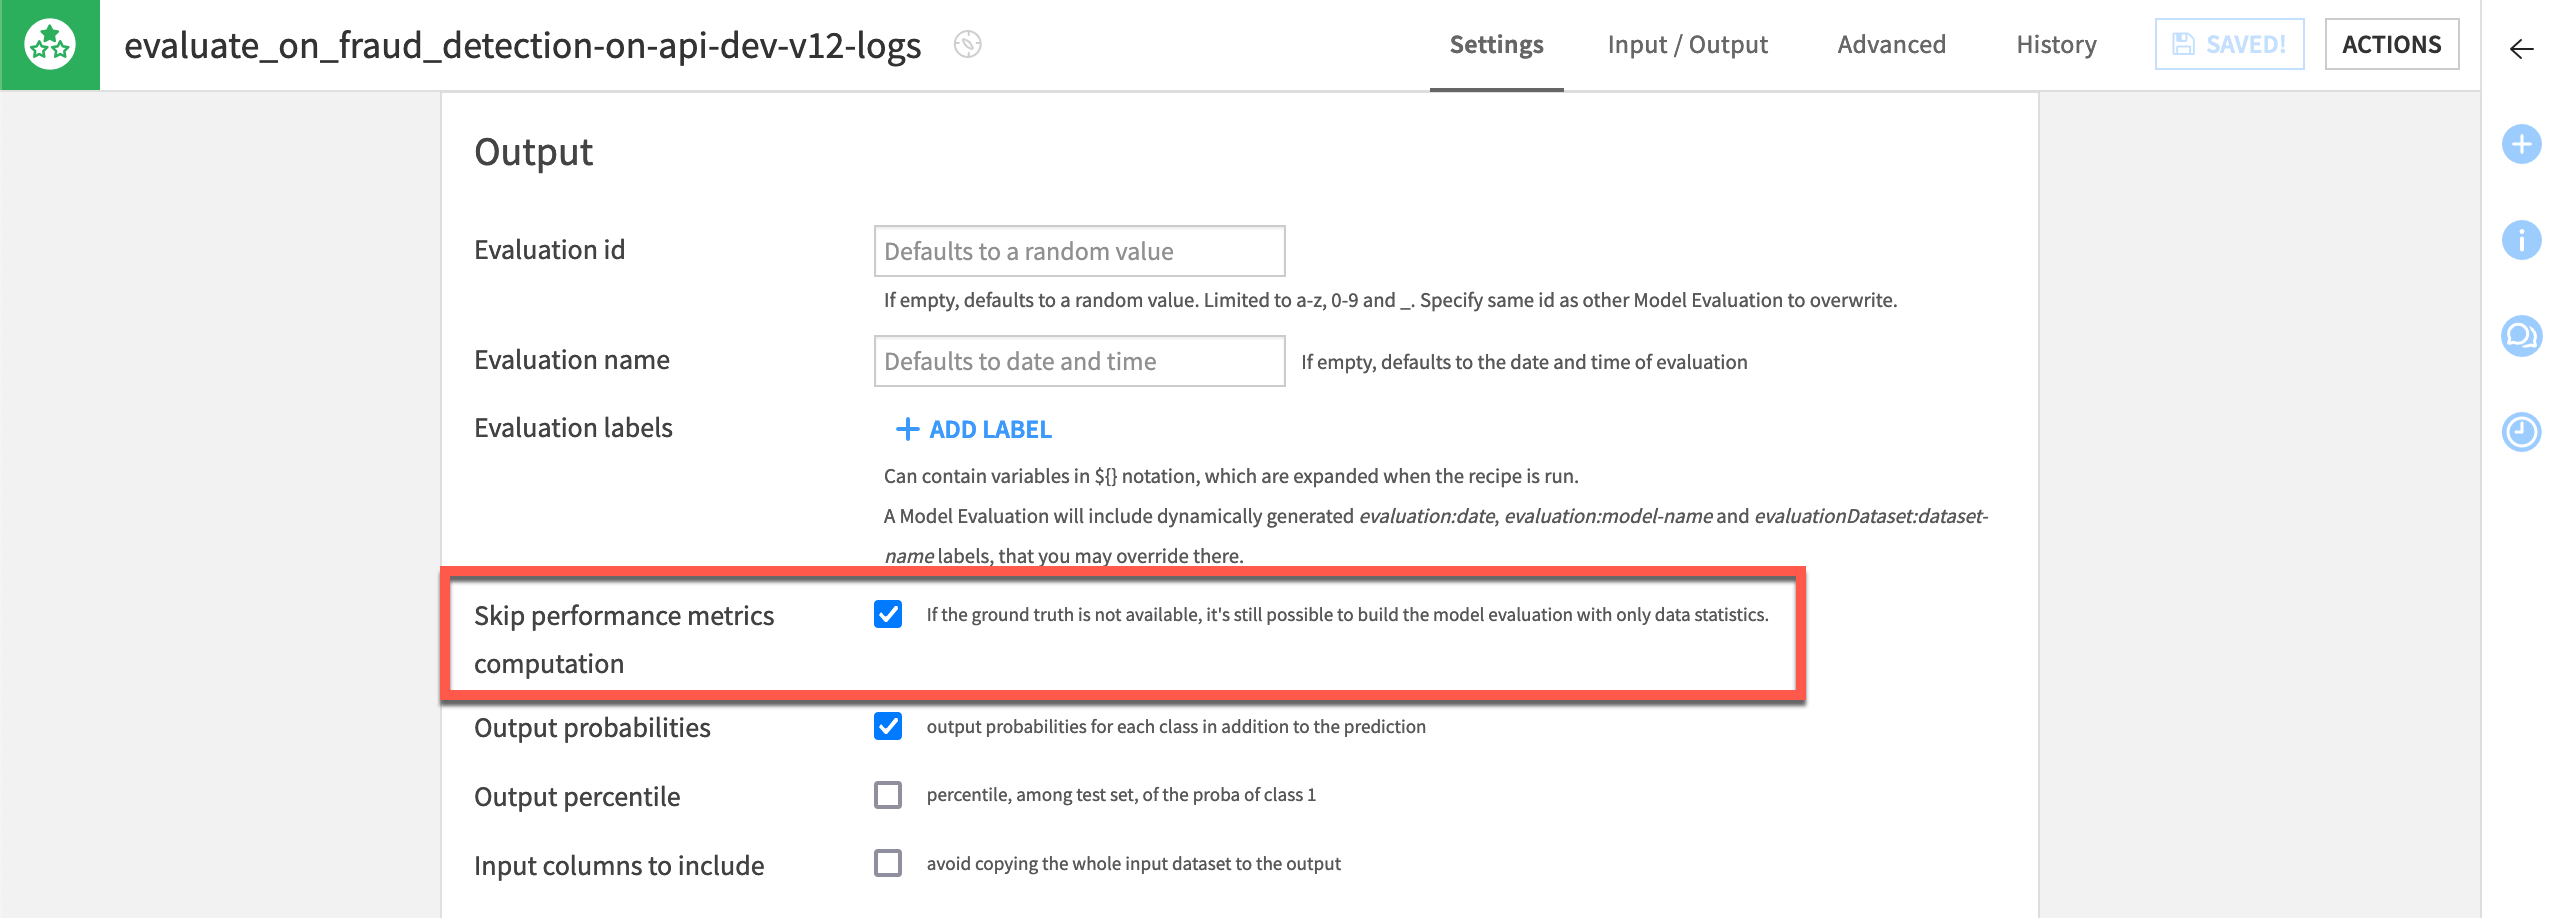
Finally, in the Output tile, note that the box is checked to skip computation of performance metrics — just as was done for the recipe monitoring data drift. Remember that the ground truth is also missing here as this data is straight from the API endpoint.
After observing these settings, click Run to execute the Evaluate recipe.

Open the output MES to find the same set of data drift metrics that you would normally find.
See also
You can read more in the reference documentation about reconciling the ground truth in the context of a feedback loop.
Next steps#
Congratulations! You’ve set up a feedback loop to monitor data drift on an API endpoint deployed in production.
If you have components of your monitoring pipeline outside of Dataiku, see Tutorial | Model monitoring in different contexts.
See also
See the reference documentation on MLOps for full coverage of Dataiku’s capabilities in this area.

