
Concept | Model evaluation stores#
At any point, you can evaluate the efficacy of a model over time if you have the right historical data. Additionally, as you receive new input data over time, you can concurrently evaluate whether a model is still performing well. To accomplish these tasks, you’ll use model evaluation stores.
Create an Evaluate recipe#
The first step to evaluating a model in Dataiku is to create an Evaluate recipe, which requires two inputs: a saved model deployed to the Flow and an evaluation dataset.
This recipe can have up to three outputs:
An output dataset containing the input features, predictions, and correctness of predictions;
A metrics dataset containing one row of performance metrics for each run of the Evaluate recipe;
And/or a model evaluation store, which contains the same performance metrics, but also visualizes them and offers the familiar status checks for monitoring purposes.
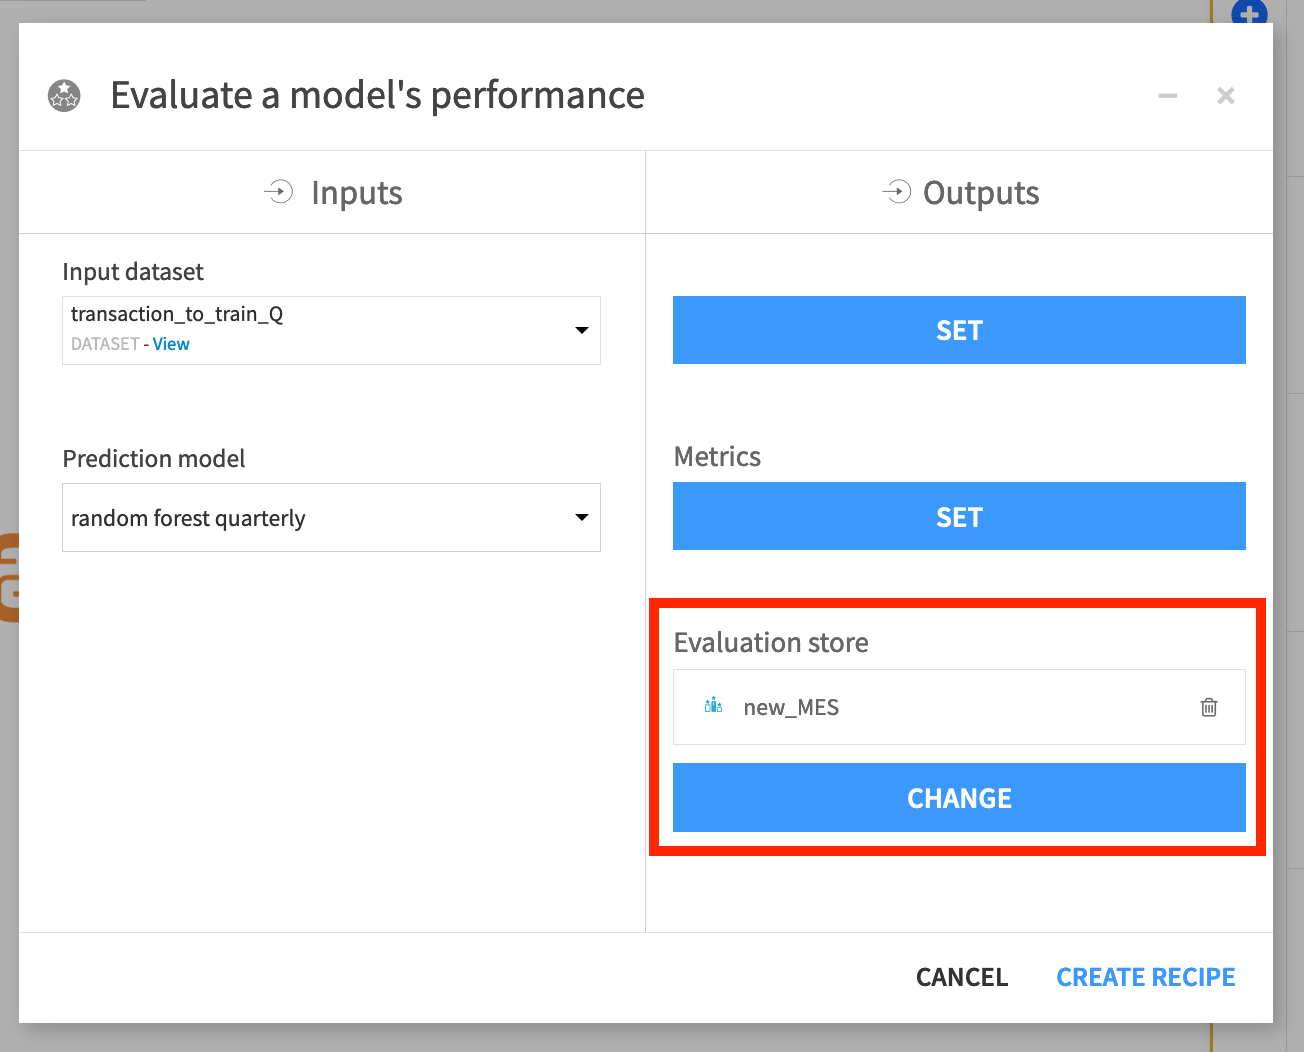
This example keeps the default settings for the Evaluate recipe. Note that this way, the recipe will use the active version of the saved model.
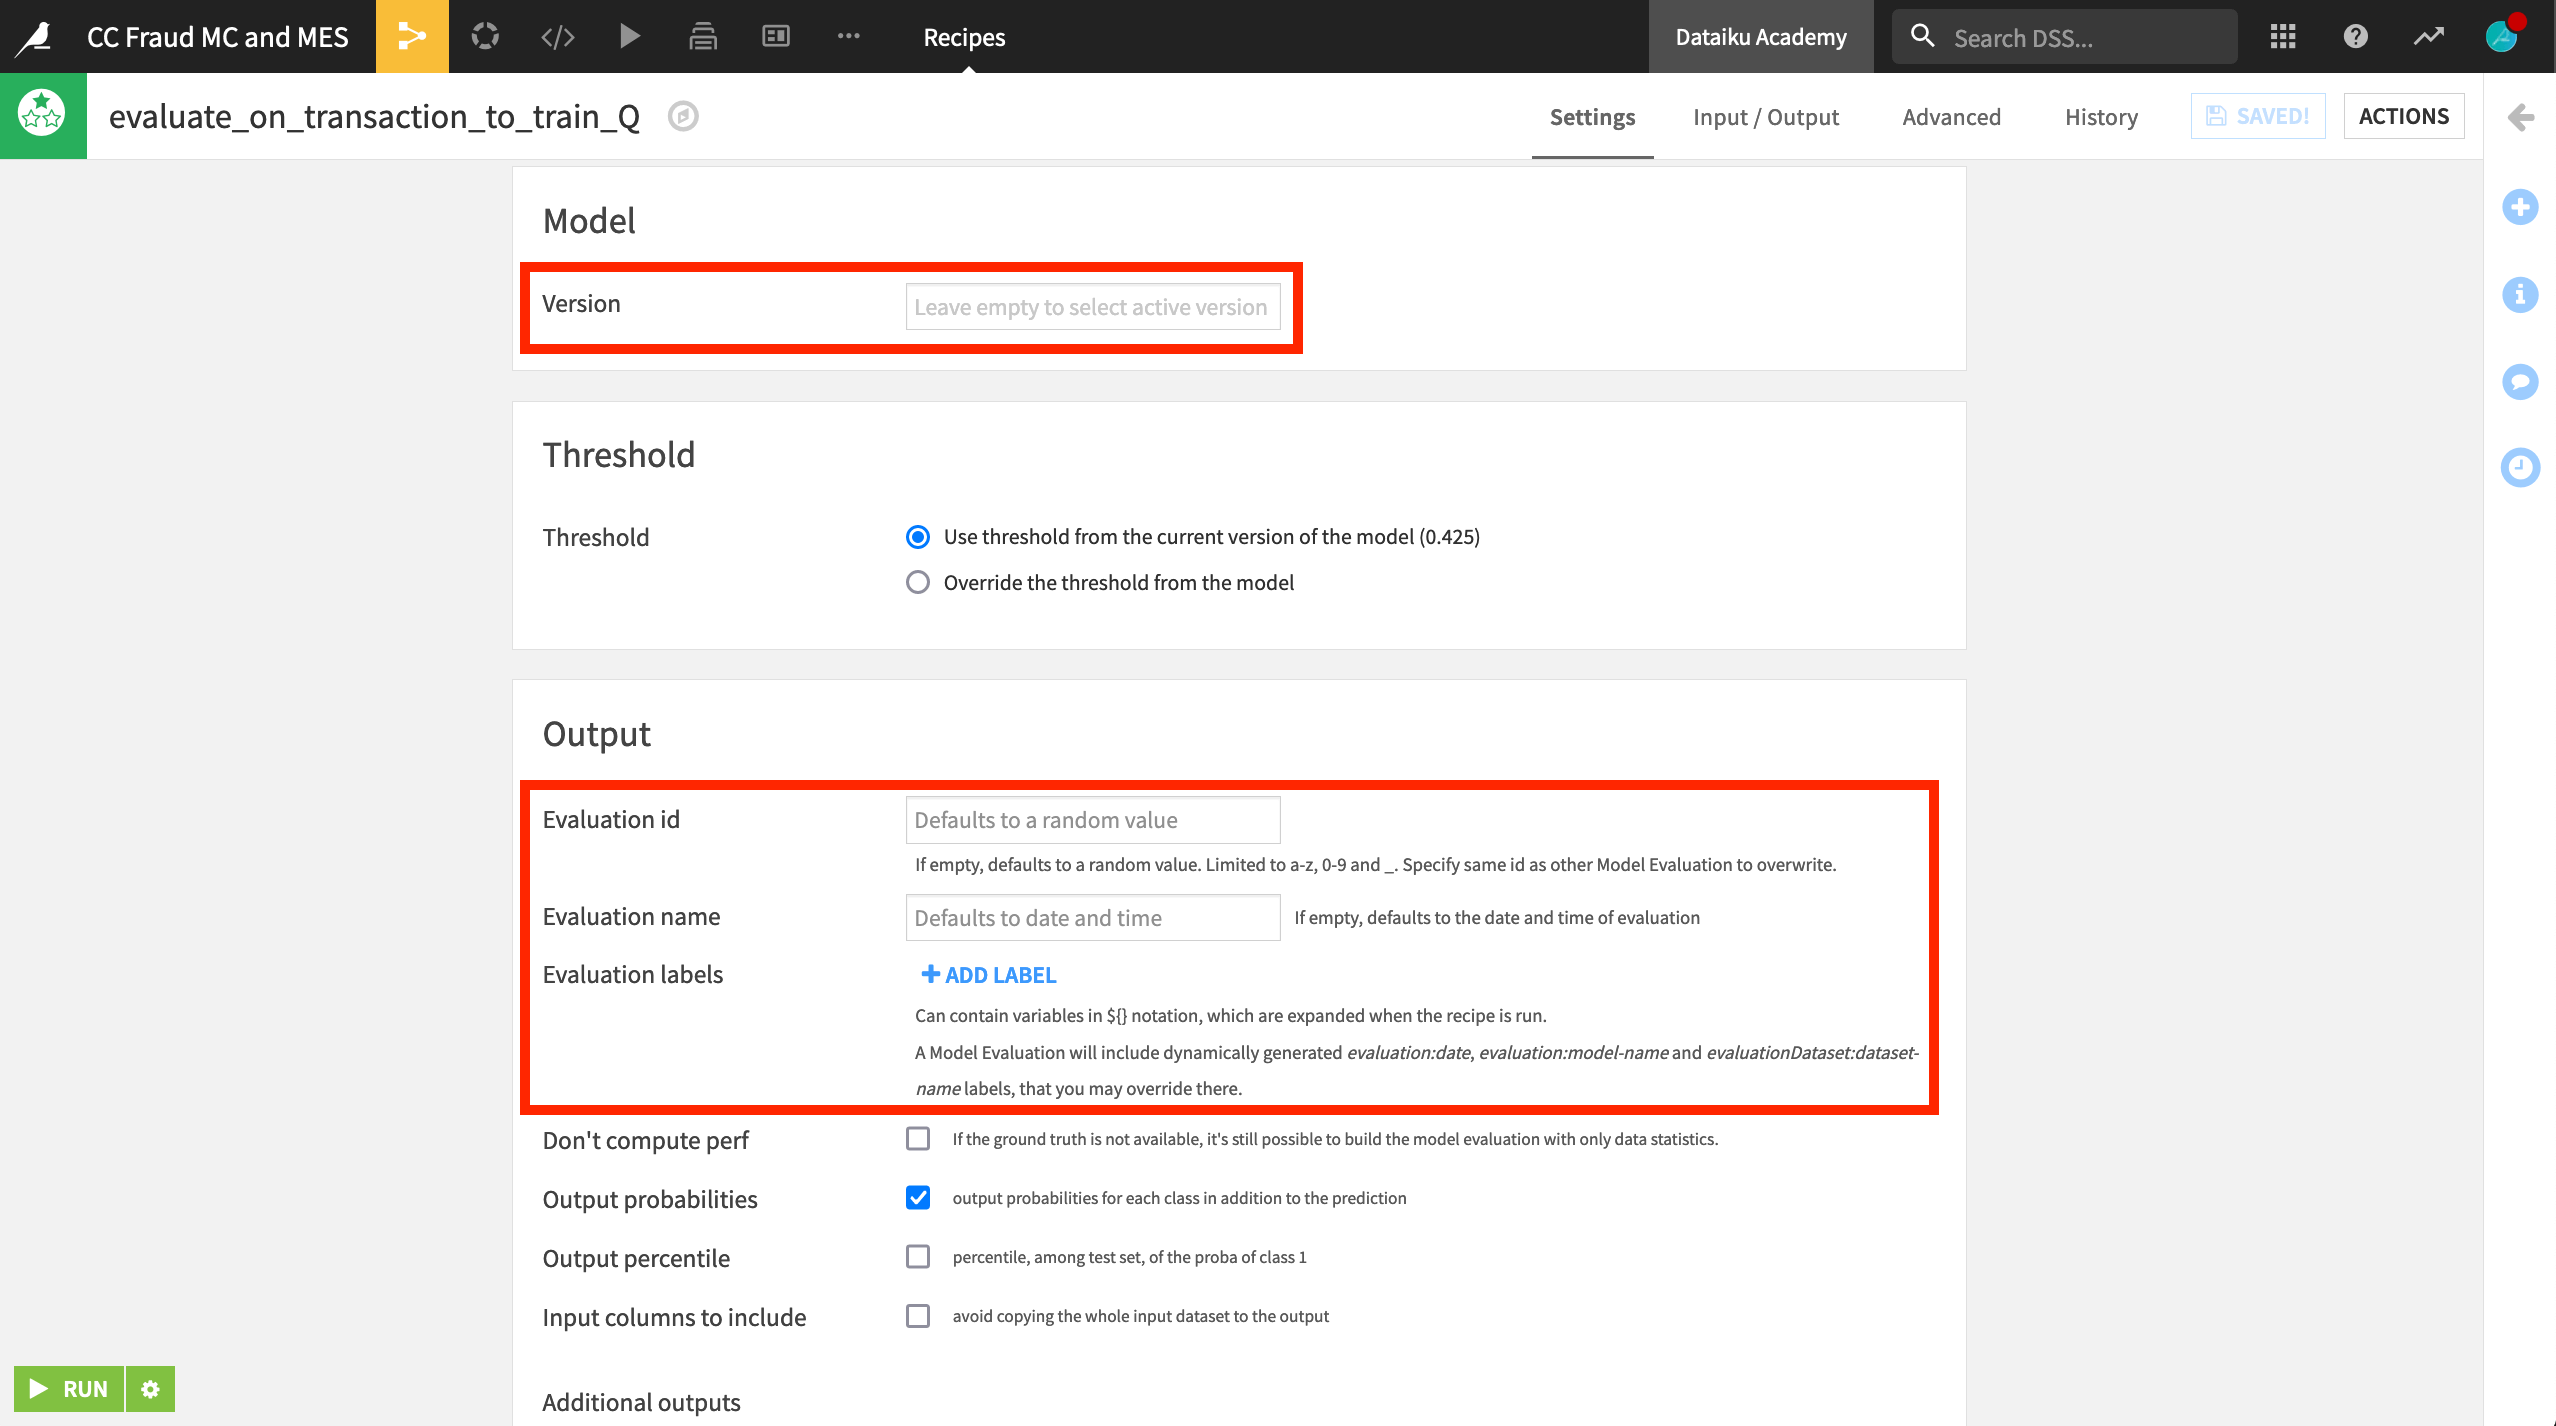
Each run of the Evaluate recipe runs adds a new row of data to the model evaluation store.
Explore the model evaluation store#
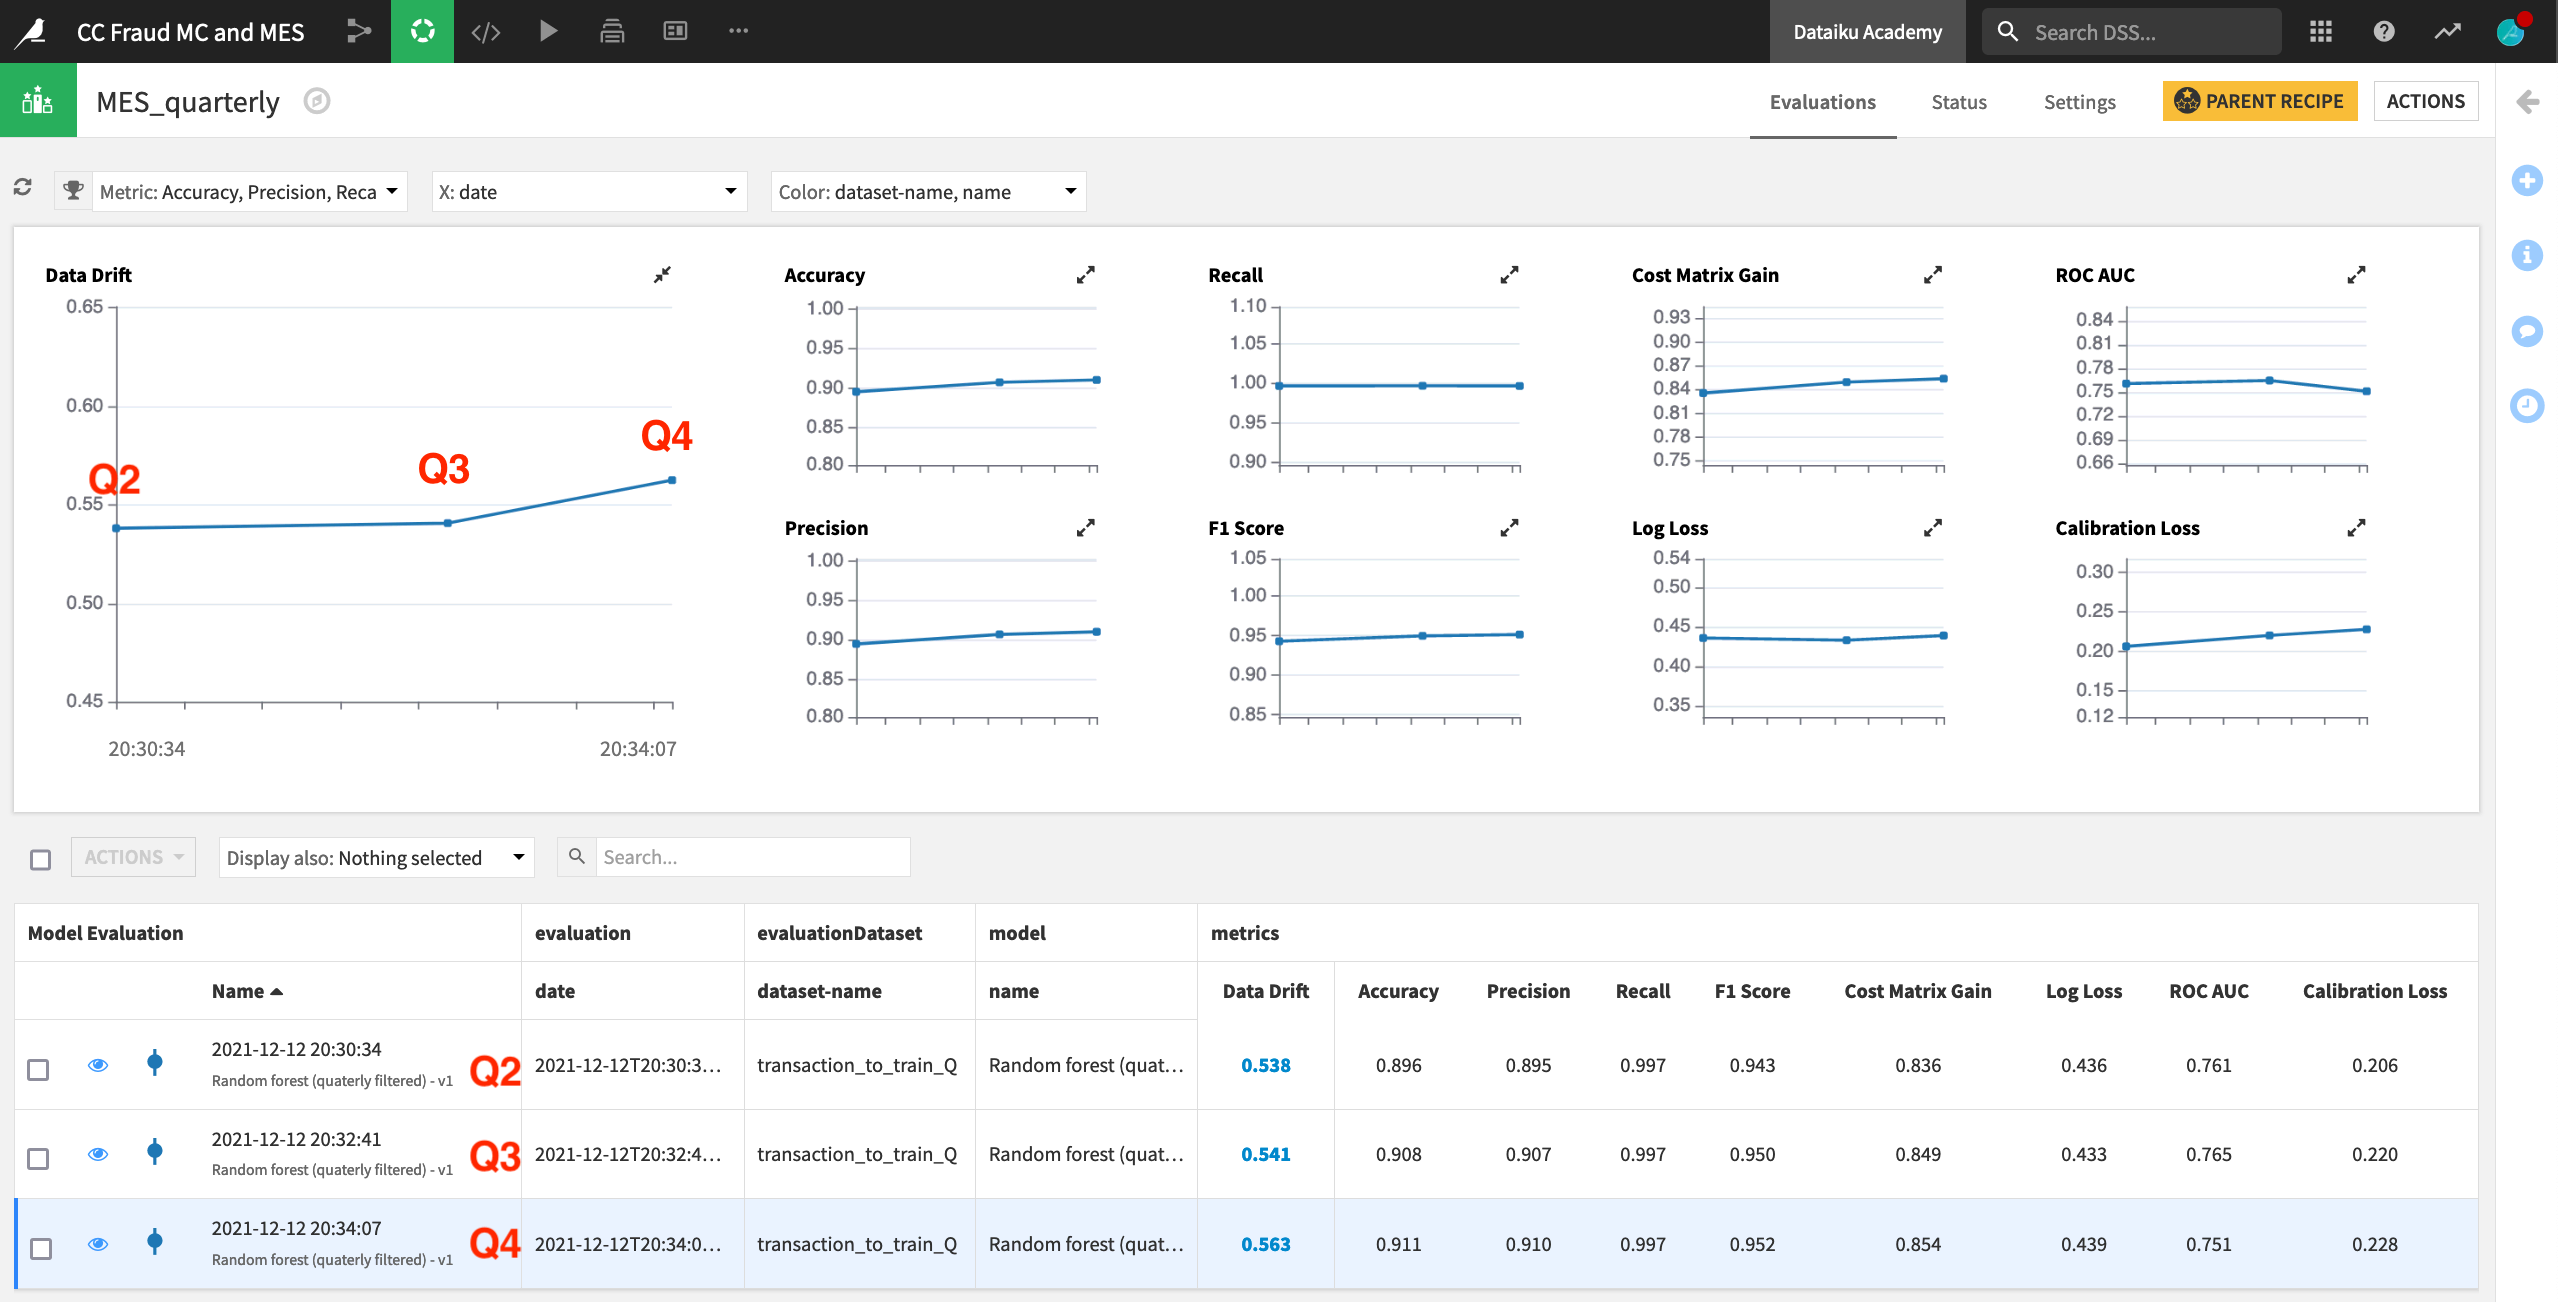
This example has run the Evaluate recipe three times. For each run, the prediction model trained on Q1 data remained the same. However, the contents of the input dataset transaction_to_train_Q were changed to Q2, Q3, and finally Q4 data.
After running the recipe on three subsequent quarters of data, you can begin to see the model degrade in the model evaluation store. Data drift, particularly for Q4, is increasing, and ROC AUC is decreasing.
View drift analysis#
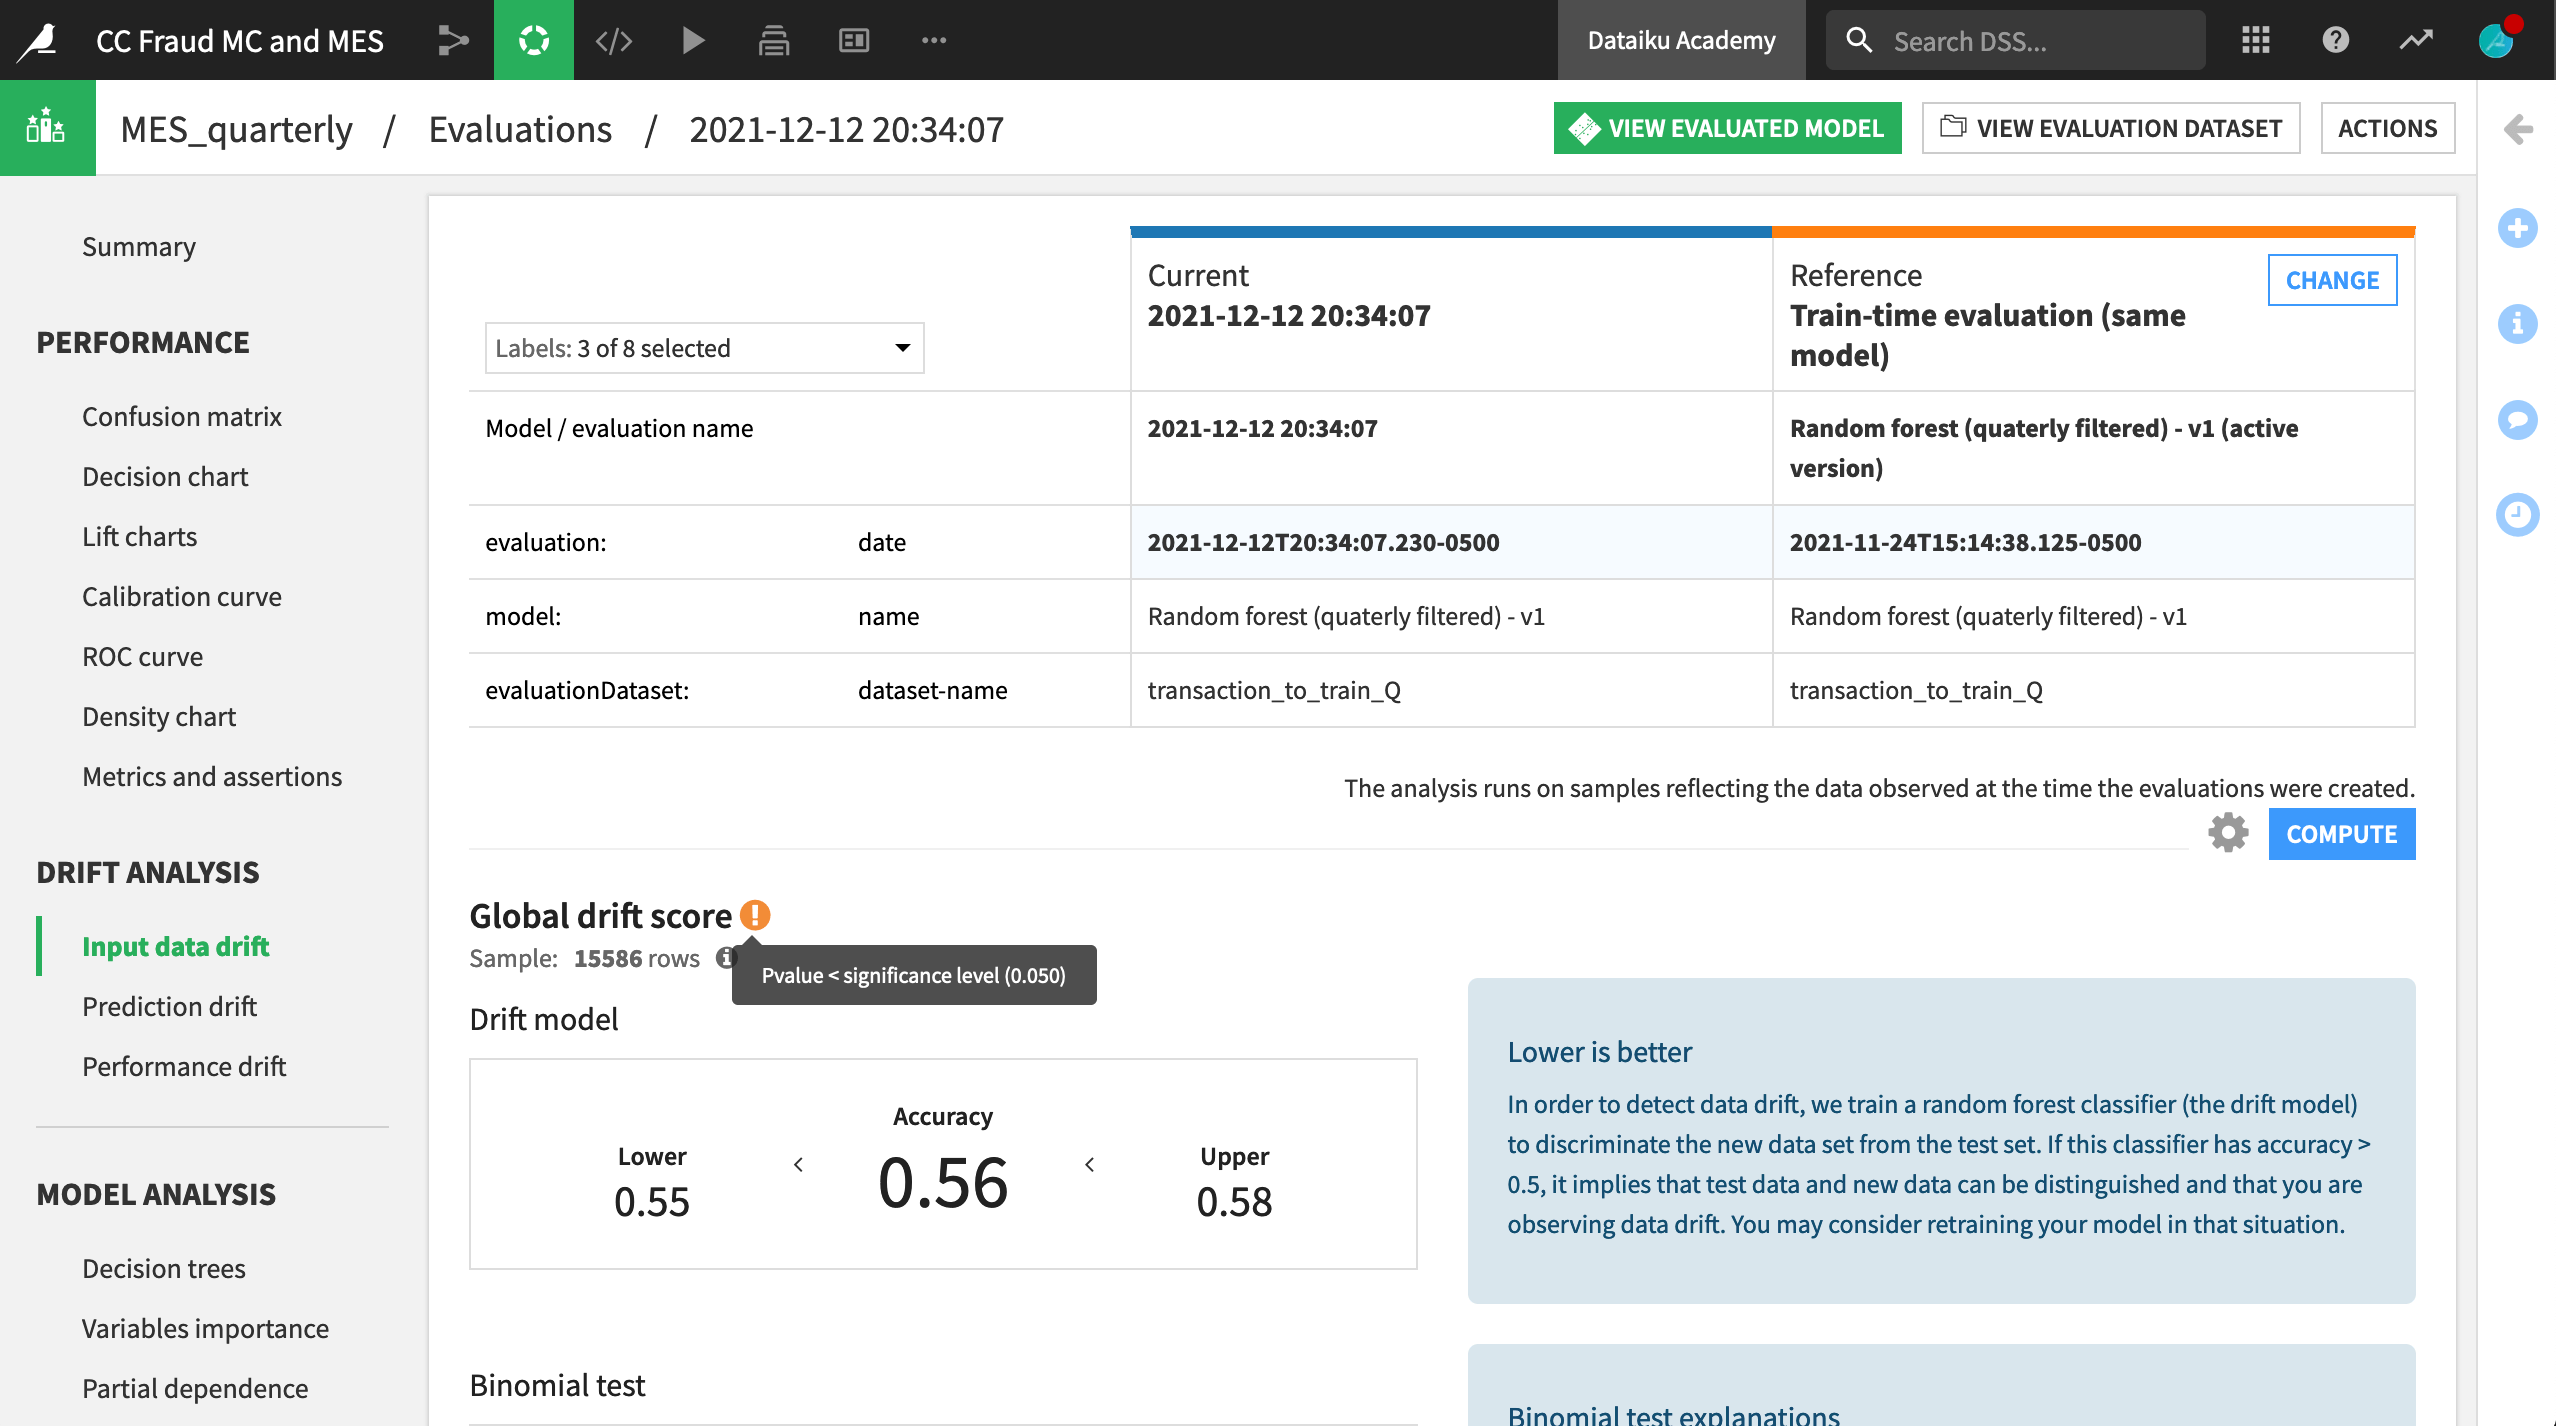
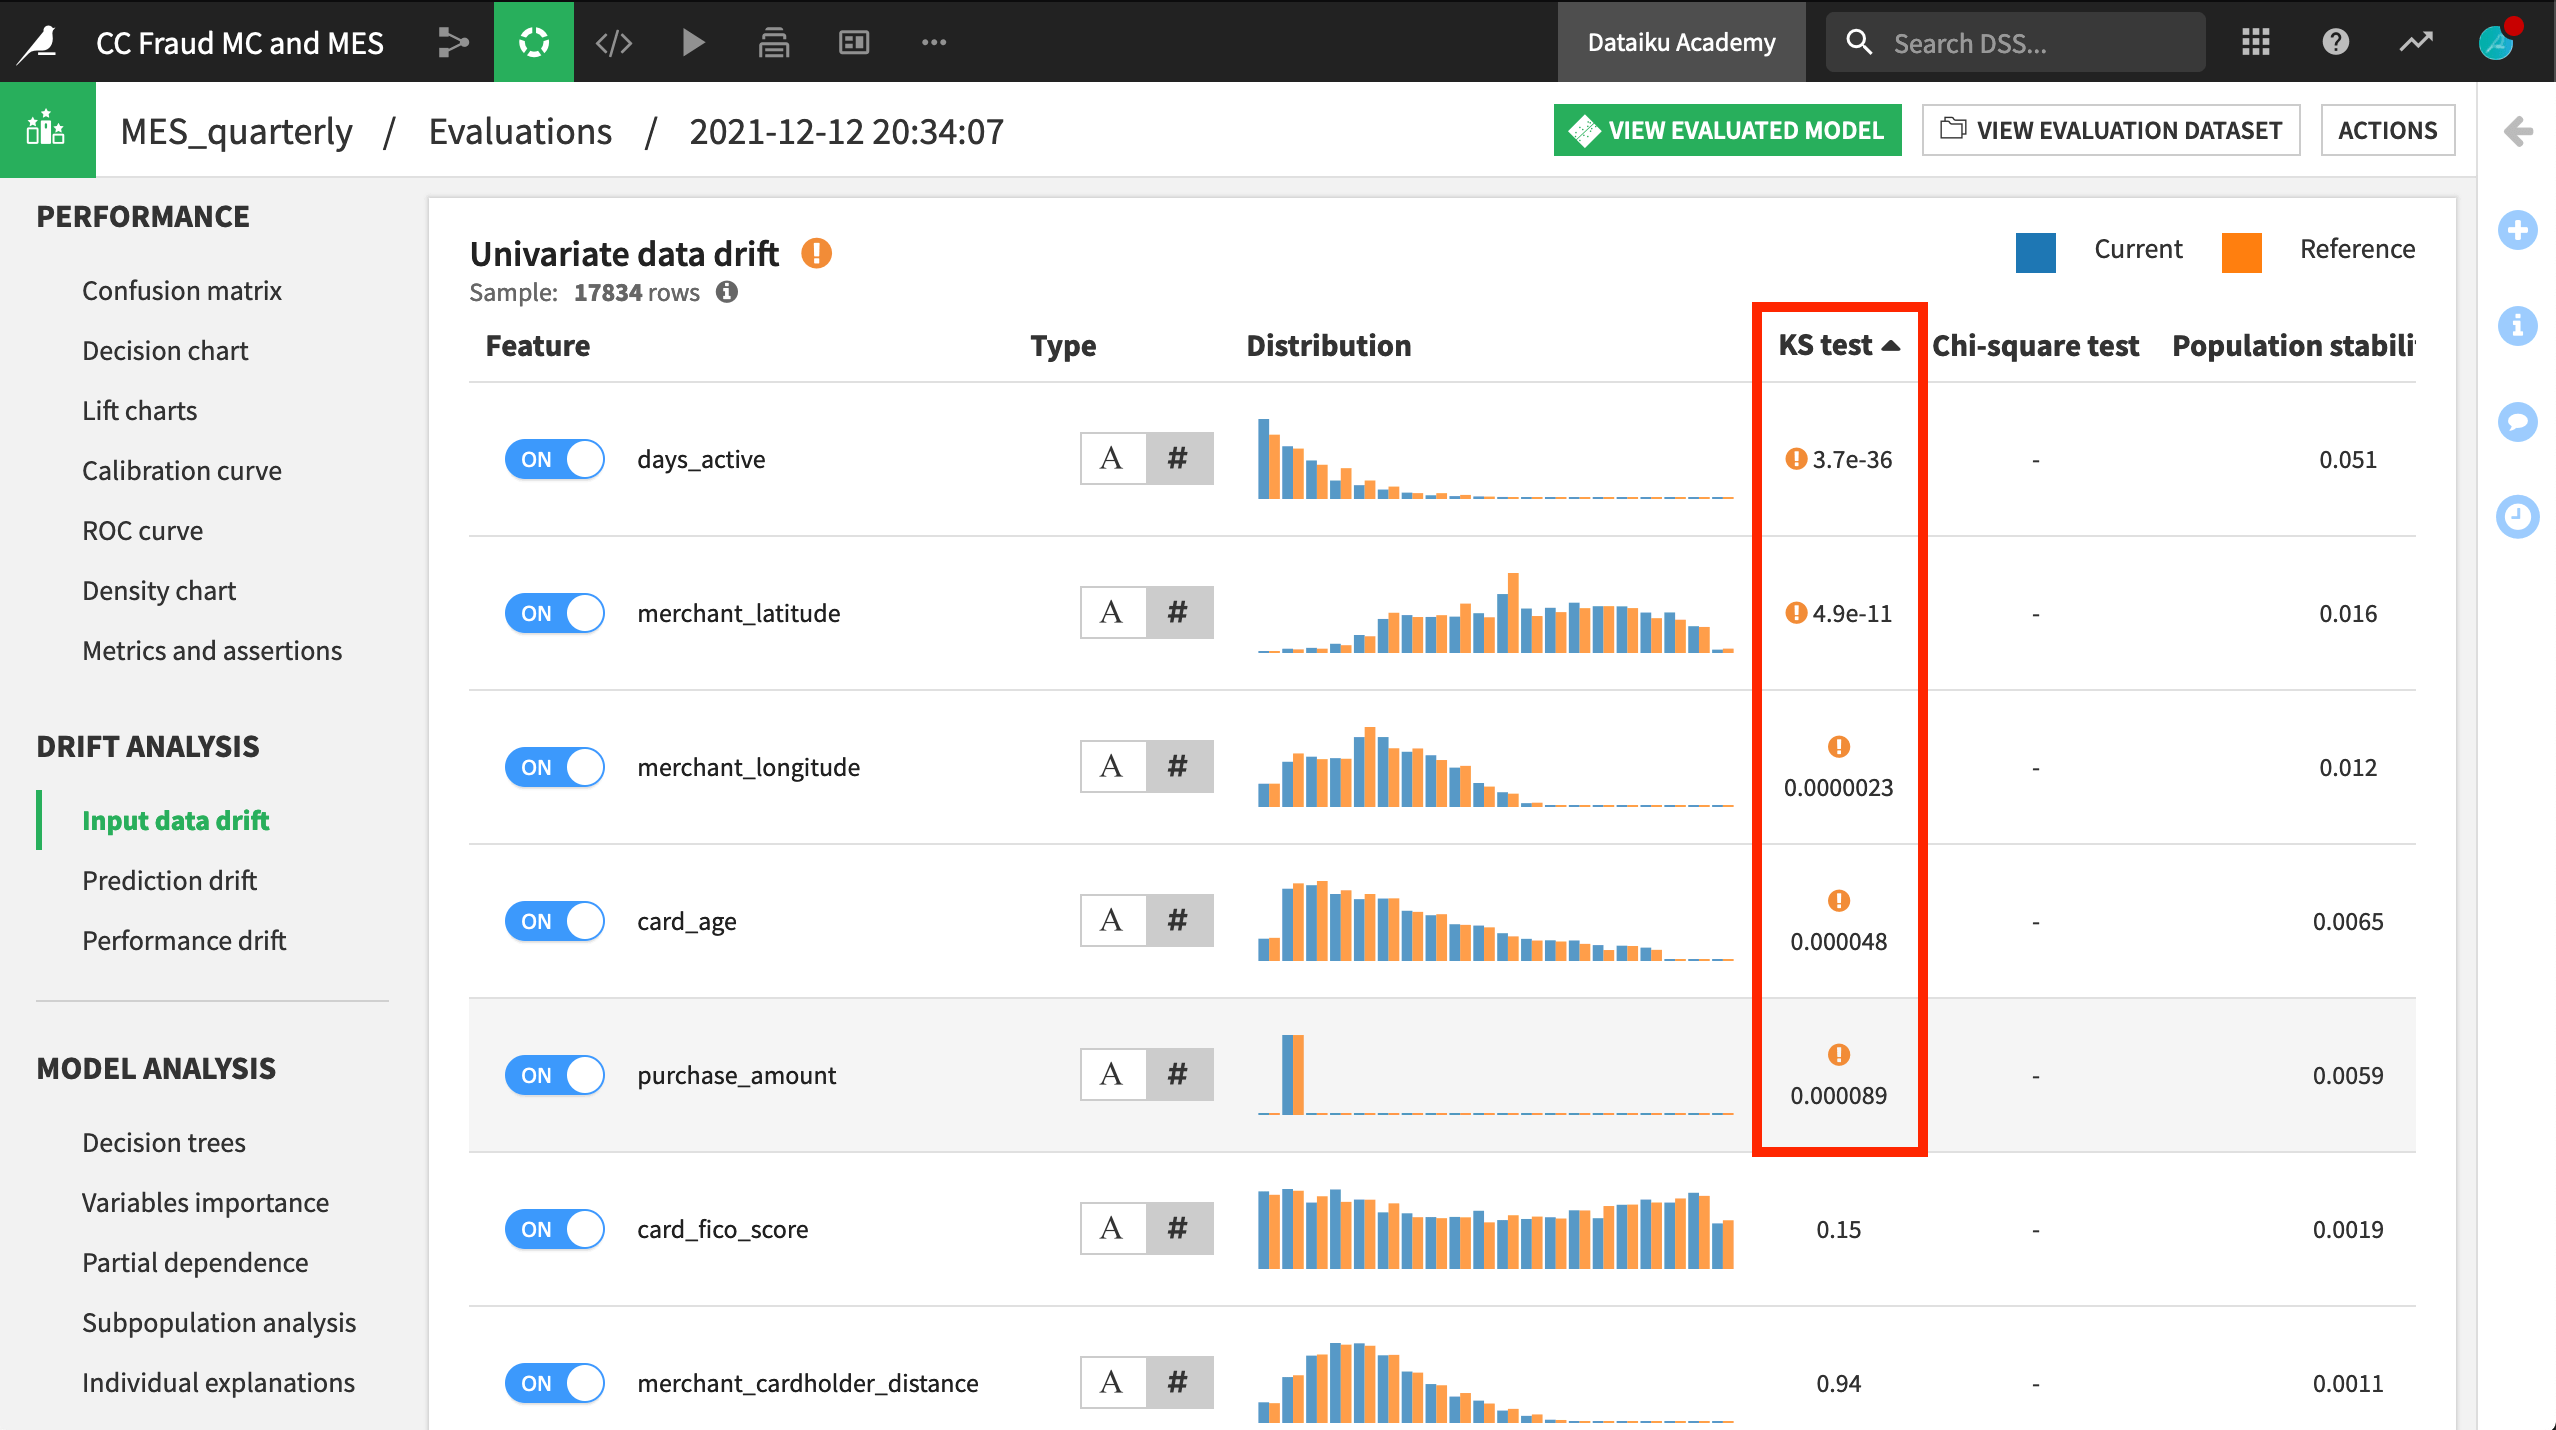
In addition to the summary view above, you can take a closer look at any individual run by clicking on its row. The third row containing the Q4 input data shows the necessary model information and performance metrics found in the Lab. There is also a Drift Analysis section.
The input data drift section reports the extent to which a random forest classifier is able to distinguish between the test set from the original reference data (Q1) and the new data (Q4). This case shows input data drift, which may signal that the model requires retraining.
Scrolling down in the same pane, you can see which input features have drifted. After sorting by the KS test column, you can see that five features were found to have drifted significantly between Q1 and Q4. Their test statistics are lower than the significance level of 5%.
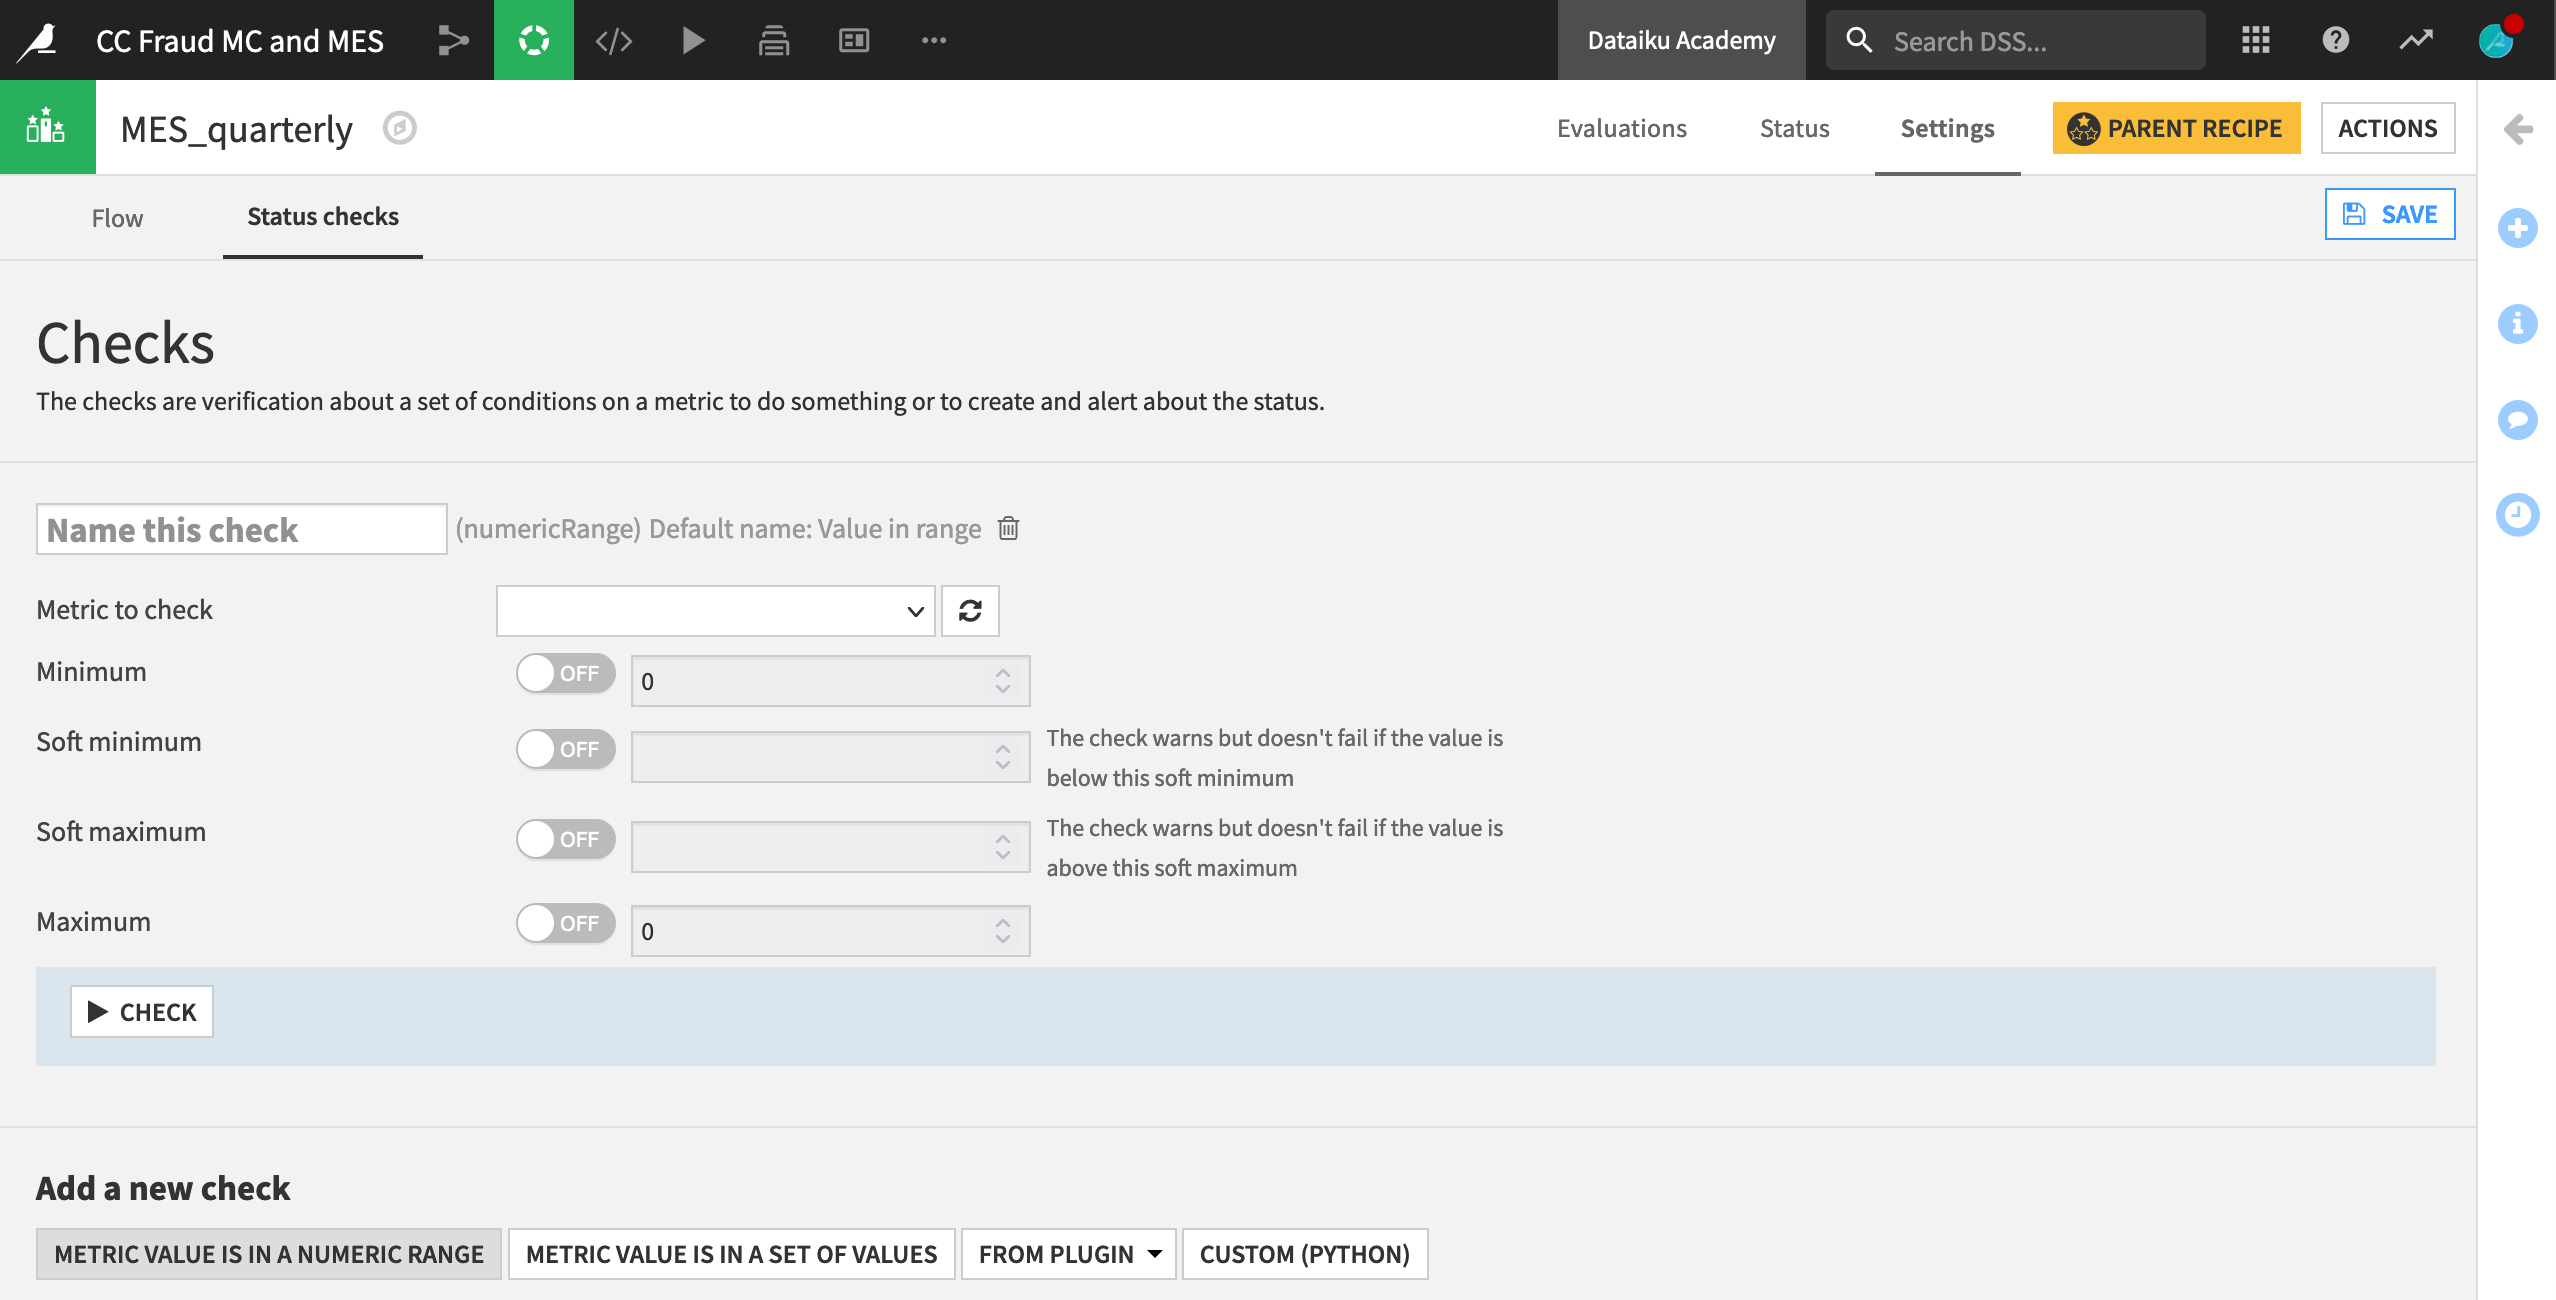
Establish status checks#
Like for other saved models or a metrics dataset from the Evaluate recipe, you could establish status checks, depending on any chosen metric. For example, you might want a warning if the model’s ROC AUC dipped below a certain threshold. You could also automatically retrain the model in the event this occurs using a scenario.
Next steps#
Model evaluation stores are also essential for monitoring the health of your models over time.
To learn more about the AI lifecycle, visit Concept | Monitoring and feedback in the AI project lifecycle or this tutorial on model monitoring for more hands-on experience.