
Tutorial | Model monitoring in different contexts#
Get started#
When deploying a model to production, monitoring is an important topic to tackle upfront. The first step is to actually define what you want to monitor, why, and with which consequences.
You’d do this using the usual methods: metrics, data quality rules, checks, scenarios.
Once you have a good understanding of your requirements, the next step is the implementation. At this stage, follow Dataiku’s resources on MLOps, such as the MLOps learning path, for a good understanding of the features at play.
However, the ML landscape within your organization might be heterogeneous. You might have models running in various contexts: some fully inside Dataiku’s ecosystem and others outside — through model exports or external deployments.
Nevertheless, even in contexts where model scoring happens outside Dataiku, model monitoring can still occur inside Dataiku.
Objectives#
This tutorial explains how to design a model monitoring feedback loop in several different contexts.
The first two cases demonstrate model scoring and monitoring entirely within Dataiku:
A deployed model scored with a batch Flow
A deployed model scored as an API endpoint
The last two demonstrate model monitoring within Dataiku in situations where model scoring occurs outside Dataiku:
A model exported in Java
A model exported in Python
Prerequisites#
To focus on the choices of model monitoring in different contexts, this tutorial simplifies the configuration for these cases to the greatest degree possible.
For any of the above cases, you’ll need:
Dataiku 12.0 or later.
A Full Designer user profile on the Dataiku for AI/ML or Enterprise AI packages.
Broad knowledge of Dataiku (Core Designer + ML Practitioner level or equivalent).
Each of the cases listed above may have additional specific requirements found at the beginning of each section.
Create the project#
From the Dataiku Design homepage, click + New Project.
Select Learning projects.
Search for and select Model Monitoring Contexts.
If needed, change the folder into which the project will be installed, and click Create.
From the project homepage, click Go to Flow (or type
g+f).
Note
You can also download the starter project from this website and import it as a ZIP file.
Use case summary#
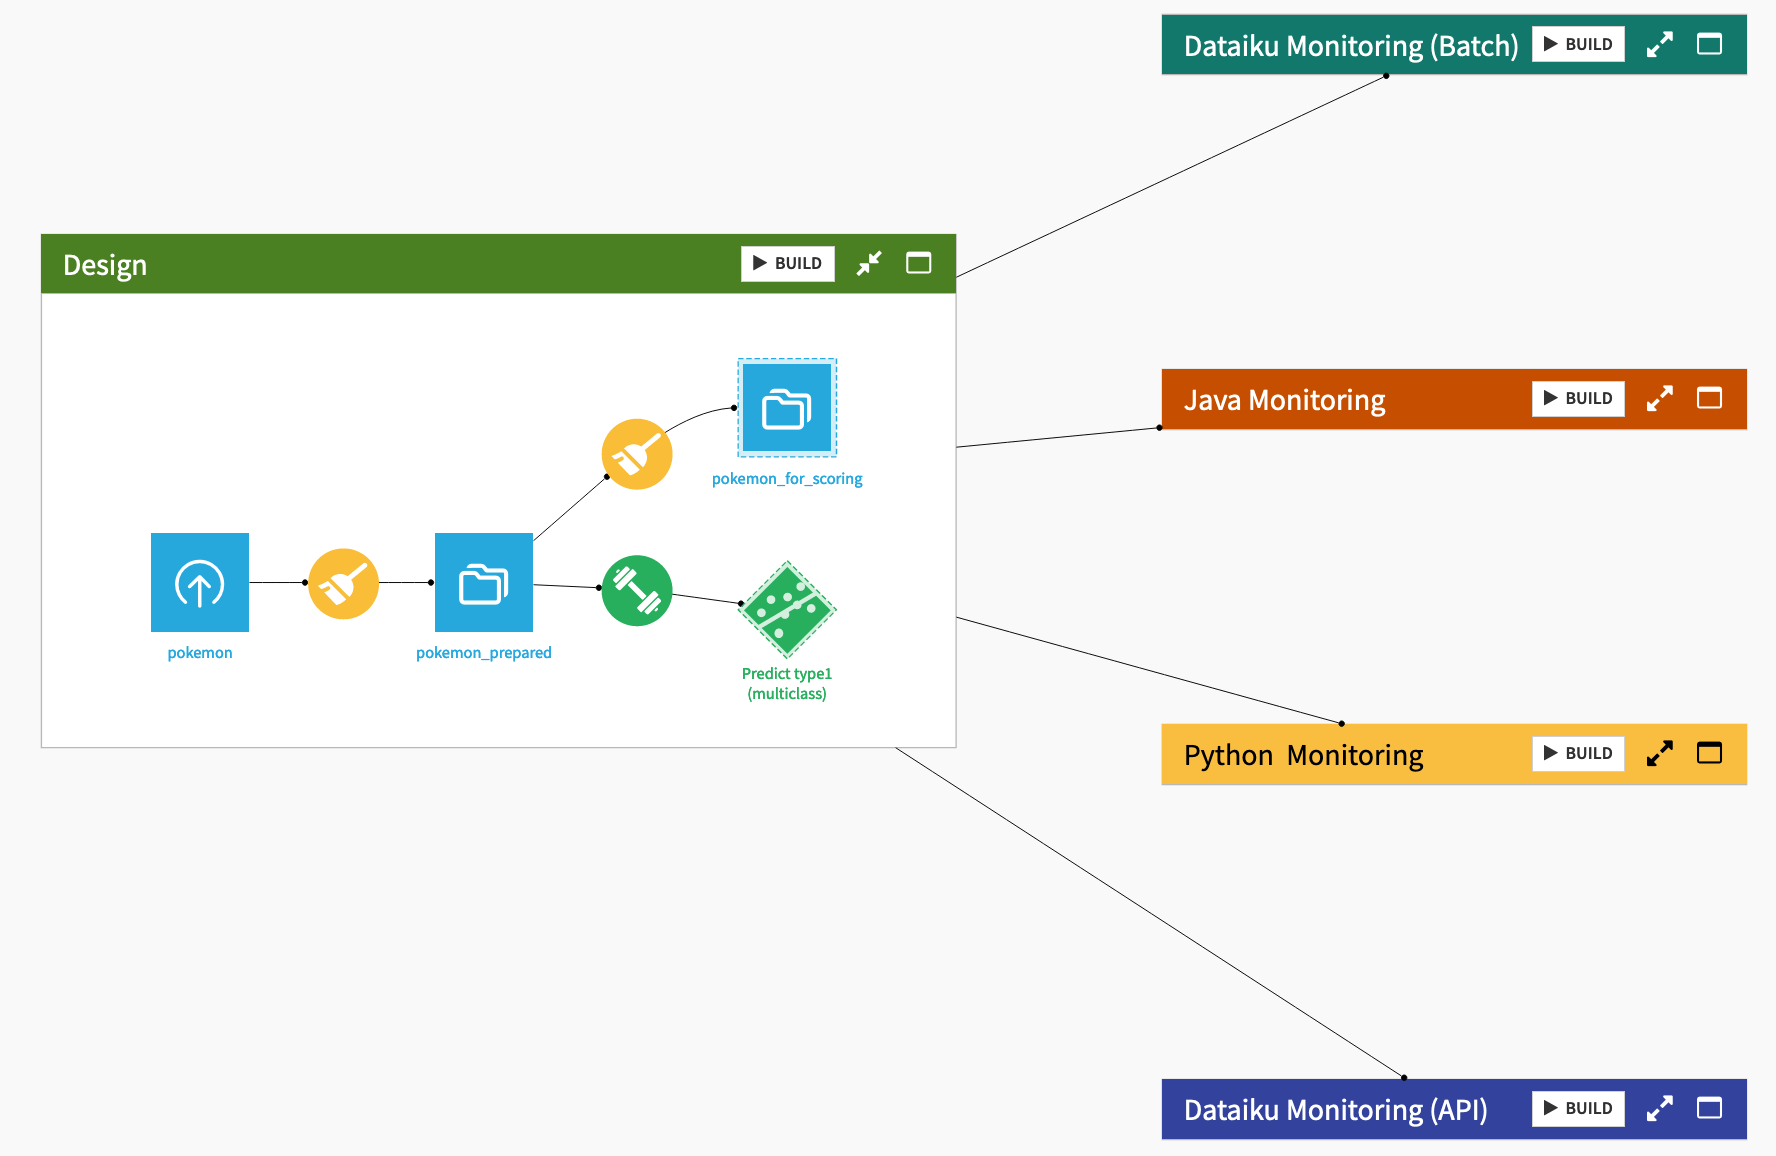
The starter project is based on the Kaggle Pokemon dataset. First review the Design Flow zone.
Every row in the pokemon dataset is a different Pokemon, with columns representing dozens of characteristics and abilities.
Every Pokemon belongs to one of eighteen different types (represented as type1 in the dataset), such as water, normal, grass, etc.
After some basic data cleaning in the Prepare recipe, the starter project includes a standard multi-class prediction model to predict the type of Pokemon using Dataiku’s AutoML tool, and then deployed it to the Flow.
Once you understand the basic use case at hand, build the Flow before moving ahead to the monitoring instructions.
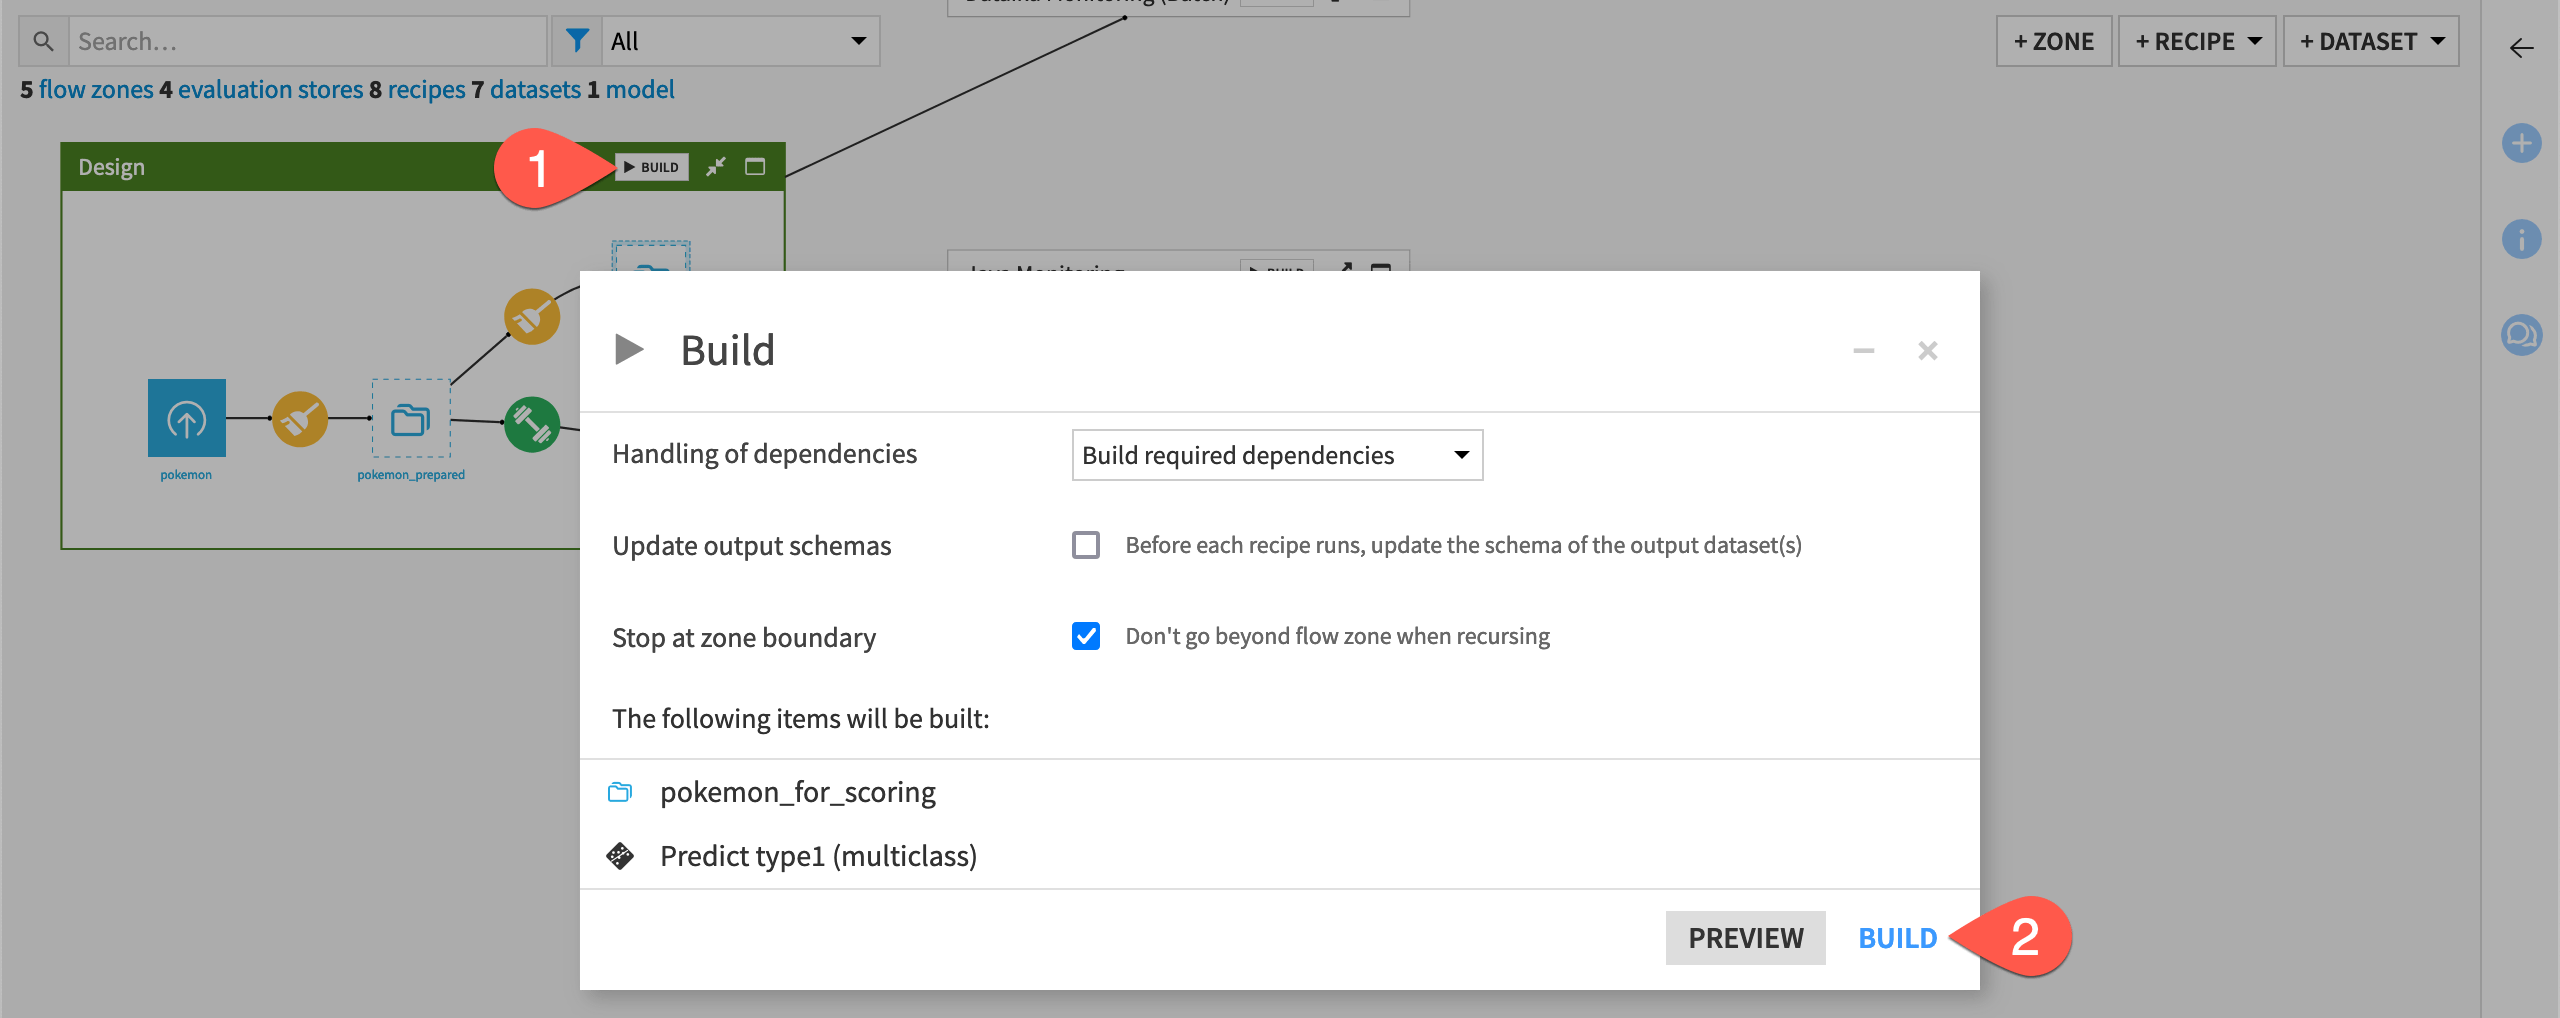
From the corner of the Design Flow zone, click Build.
Click Build once more to build the pipeline ending with the prediction model.
Ground truth vs. input drift monitoring#
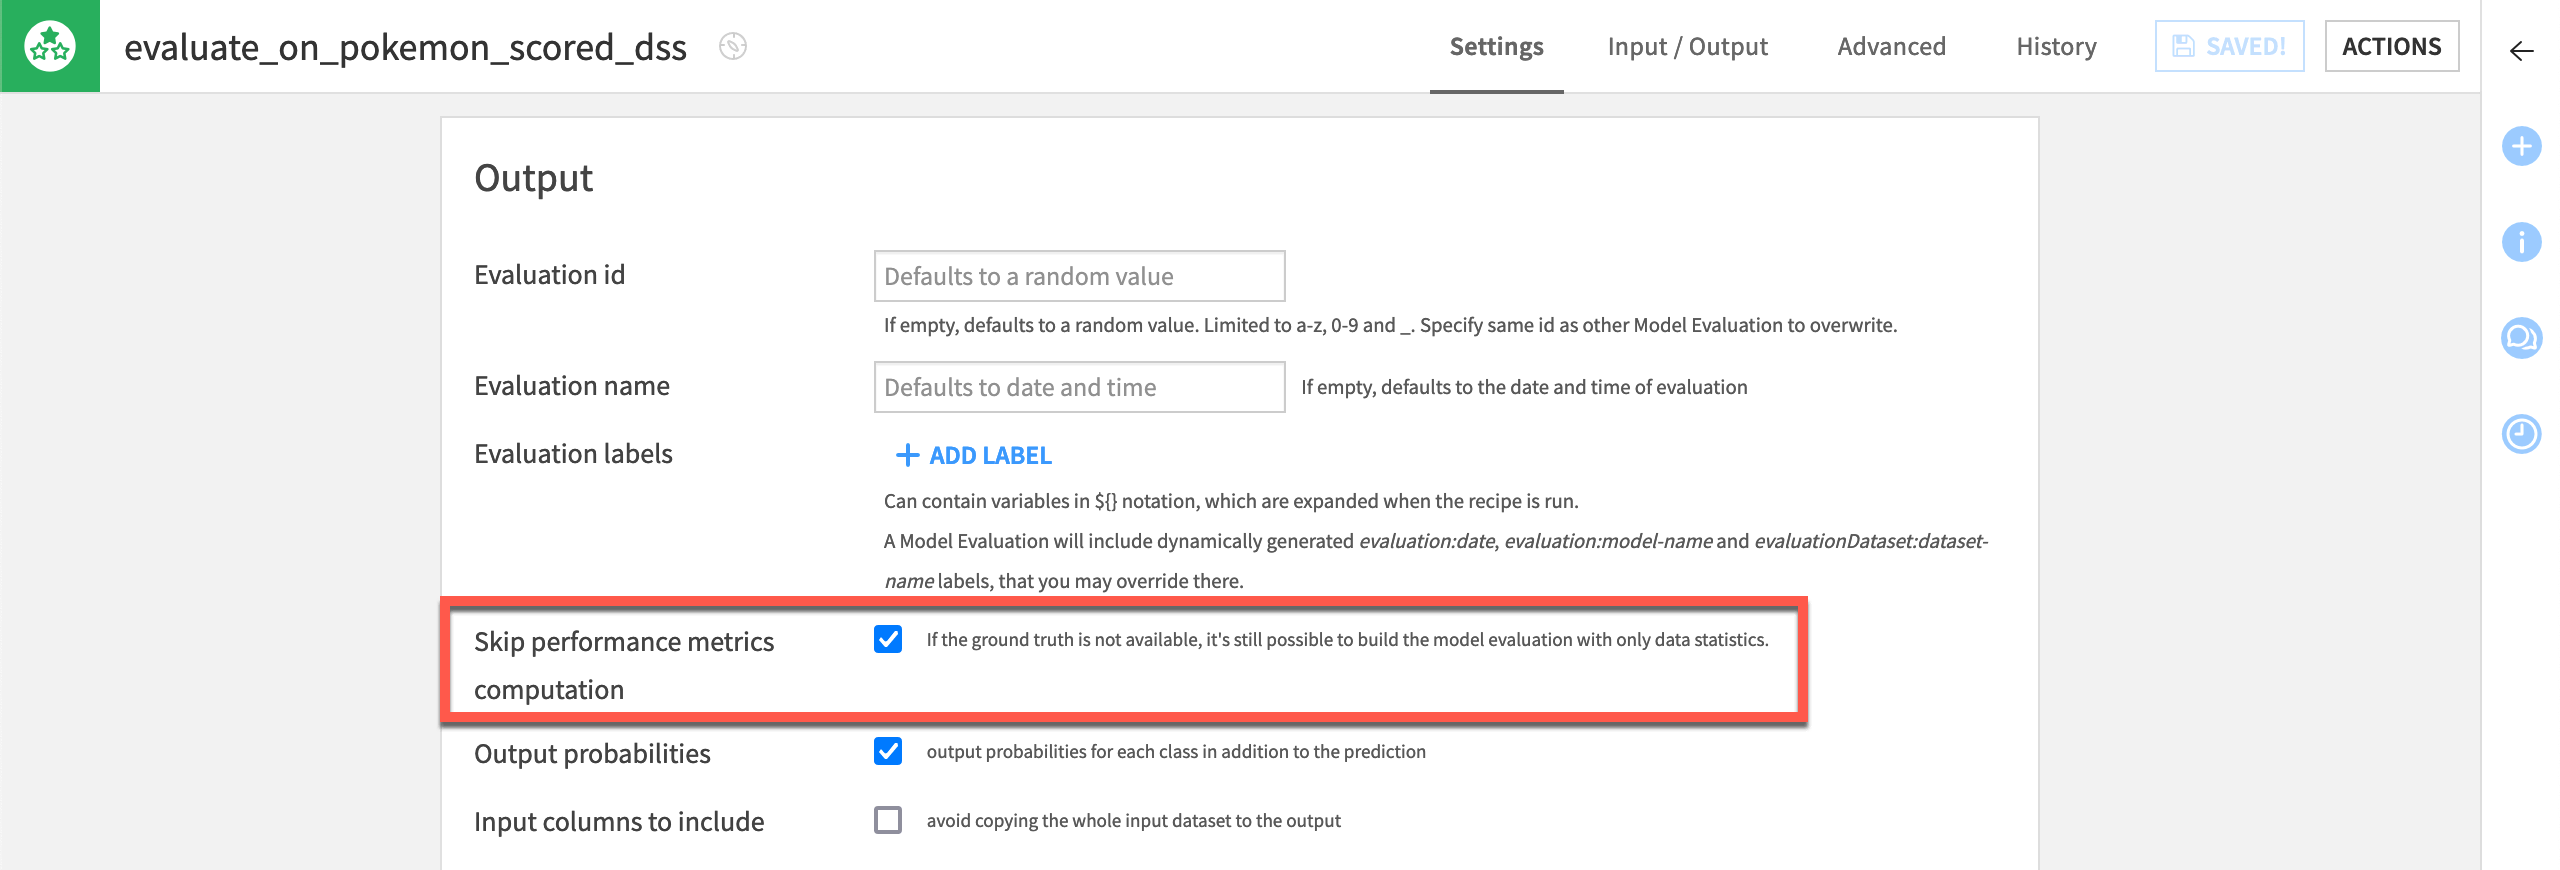
To simplify matters, in all monitoring contexts presented, the tutorial demonstrates input drift monitoring as opposed to ground truth monitoring.
If you examine the pokemon_for_scoring dataset, you’ll see that the Prepare recipe removes the target variable type1. The tutorial assumes the true answer of the model’s predictions is unknown. This is the hypothesis. Accordingly, all Evaluate recipes skip the computation of performance metrics.
Due to the differences between these two different types of monitoring, your Flow might build multiple model evaluation stores for a single model. For example:
One Flow zone builds a model evaluation store with only prediction logs that monitors only input data and prediction drift. This scenario might run every day.
In parallel, another Flow zone builds a model evaluation store with “ground truth-enriched” prediction logs that also monitors performance drift. Depending on the complications of reconciling ground truth, this data may have fewer rows or be older. This scenario might run every month.
See also
To gain experience computing both kinds of monitoring, see Tutorial | Model monitoring with a model evaluation store.
Model vs. data monitoring#
Although the focus here is model monitoring, you should recognize that model monitoring is only one leg of a robustly managed production project. You should also apply the same tools of metrics, data quality rules, checks, and scenarios to objects like datasets and managed folders. These are the upstream inputs to saved models and the Evaluate recipe.
See also
Learn more about Automation Scenarios in the Knowledge Base.
Deployment contexts#
Now that you have set up your project, move on to any of the following model monitoring examples based on your interests. You can complete them in any order independently of each other.
A batch workflow within Dataiku#
Many data science workloads call for a batch deployment framework.
As a means of comparison to other deployment contexts, this section presents how to monitor a model under a batch deployment framework staying entirely within Dataiku.
Additional prerequisites#
For this case, you’ll only need to satisfy the requirements included in the shared prerequisites, including creating the starter project found there.
Score data within Dataiku#
For this case, you’ll be using the Dataiku Monitoring (Batch) Flow zone found in the starter project.
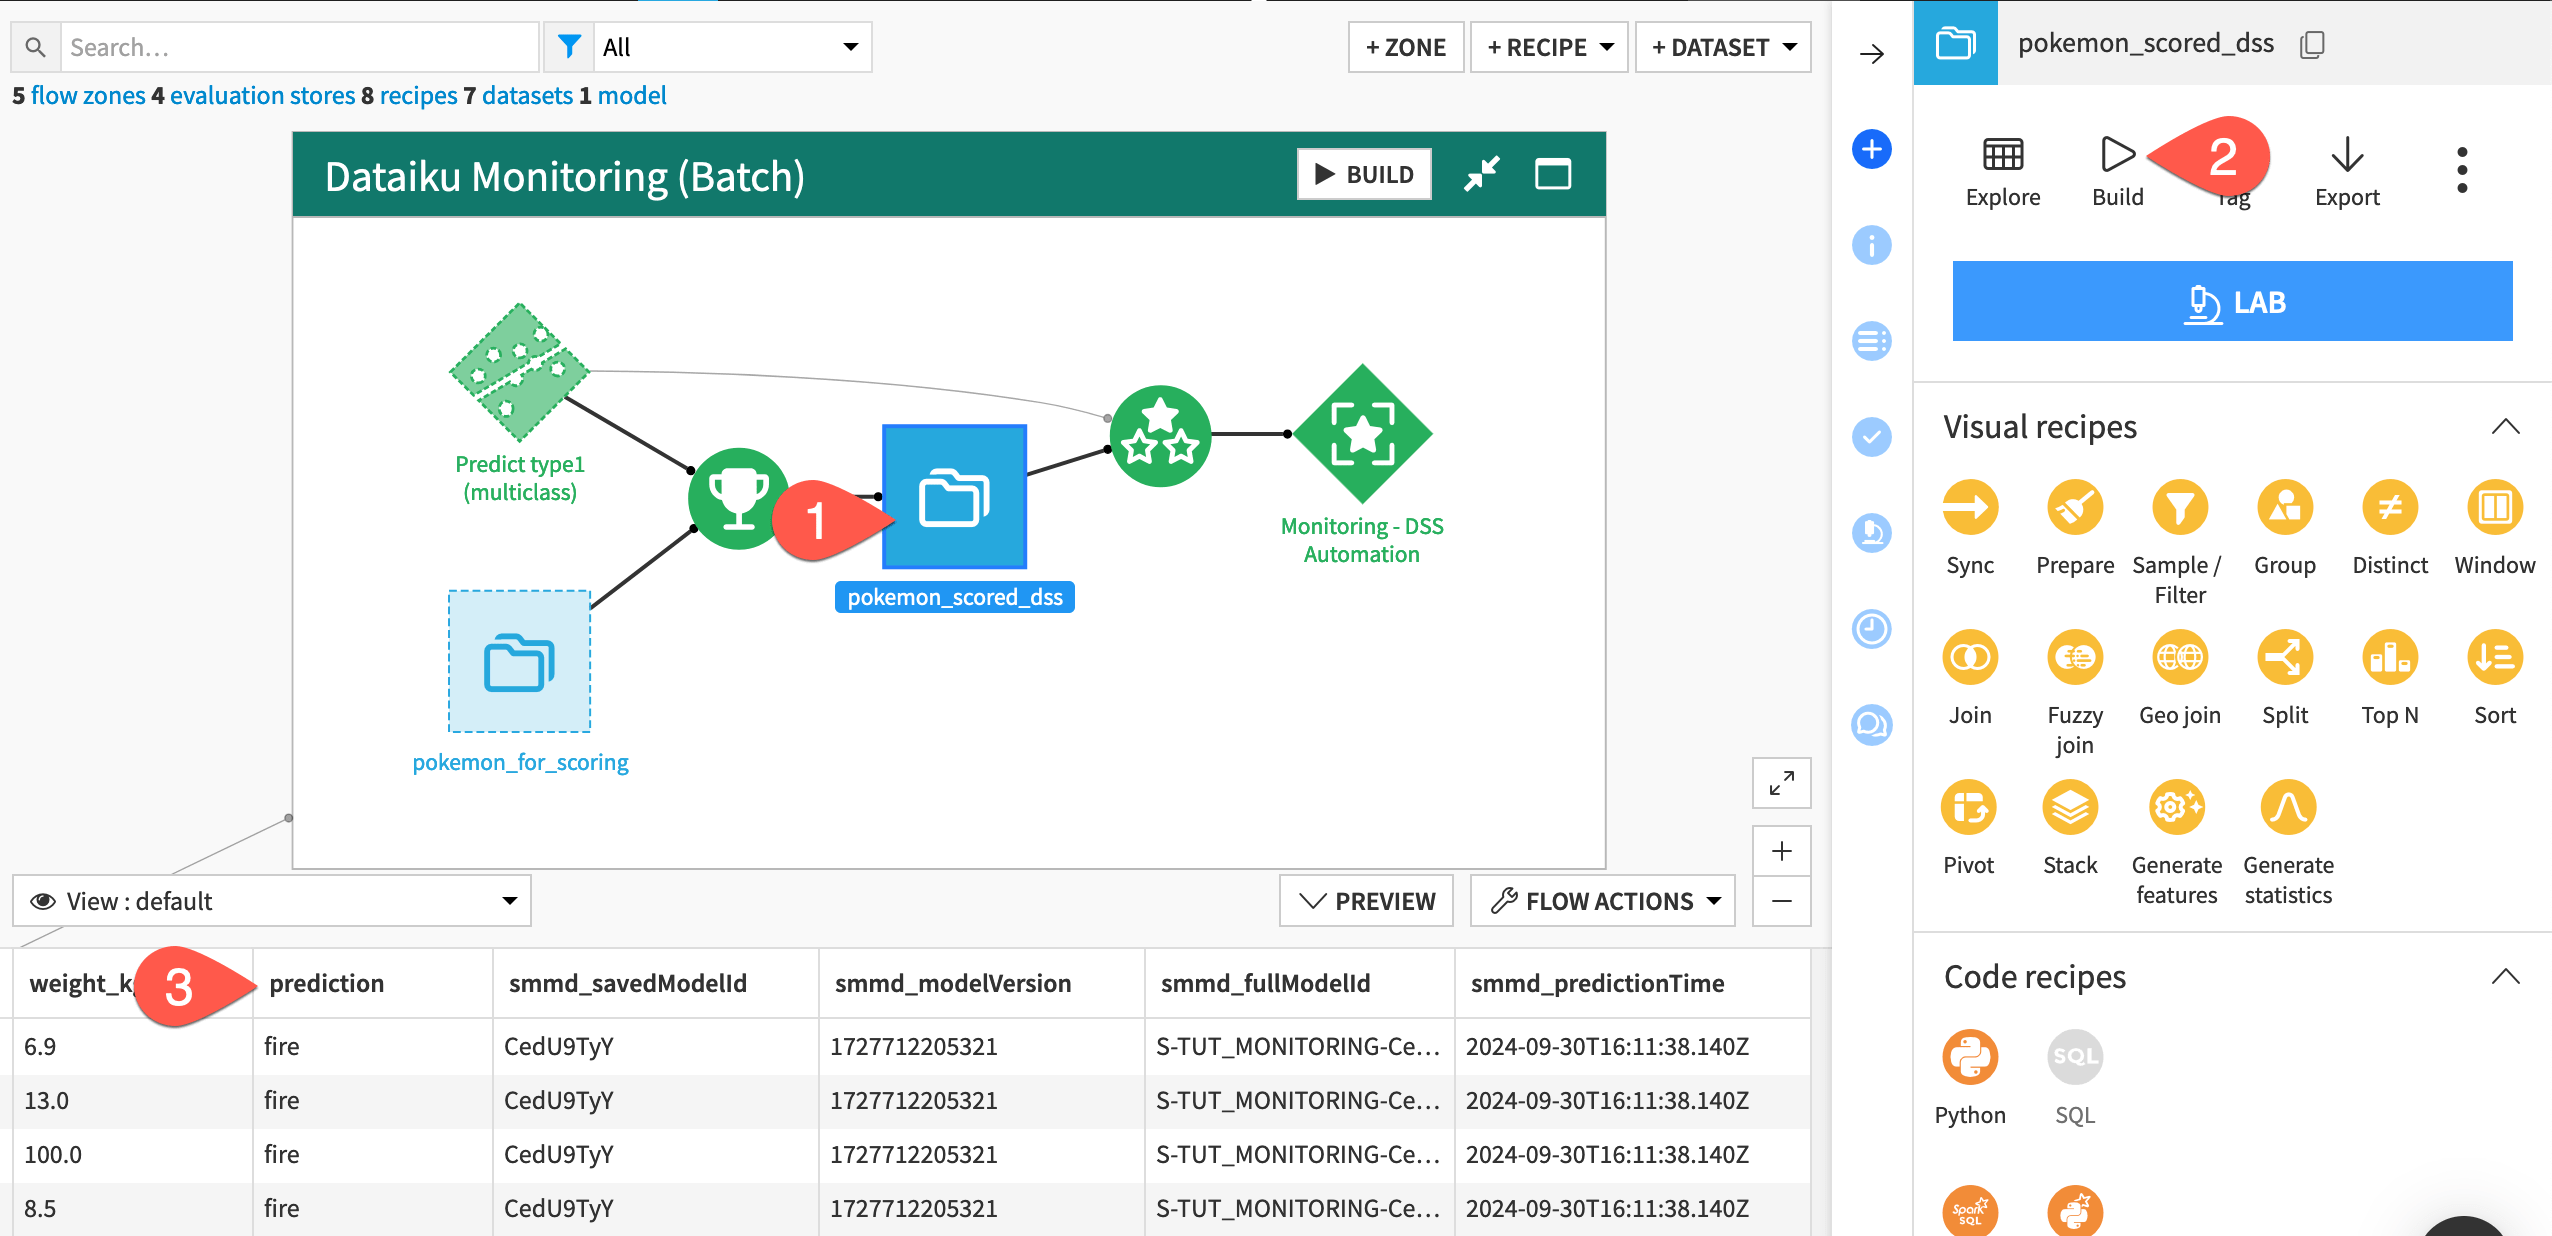
In the Dataiku Monitoring (Batch) Flow zone, select the pokemon_scored_dss dataset.
Click Build > Build Dataset with the Build Only This setting to run the Score recipe.
Before moving to the monitoring setup, examine the schema of the output to the Score recipe compared to the input. You should notice the addition of a prediction column containing the predicted type of Pokemon.
Note
You’ll notice that, in addition to a prediction column, the schema of the pokemon_scored_dss dataset includes four columns beginning with smmd_. This is because the parent Score recipe chose to output model metadata.
Monitor model metrics#
The monitoring setup in this case is the same as that presented in Tutorial | Model monitoring with a model evaluation store, but let’s review the core tenets for completeness.
In Dataiku’s world, the Evaluate recipe takes a saved model and an input dataset of predictions. It computes model monitoring metrics and stores them in a model evaluation store (MES). This case assumes the ground truth is unavailable and so doesn’t compute performance metrics.
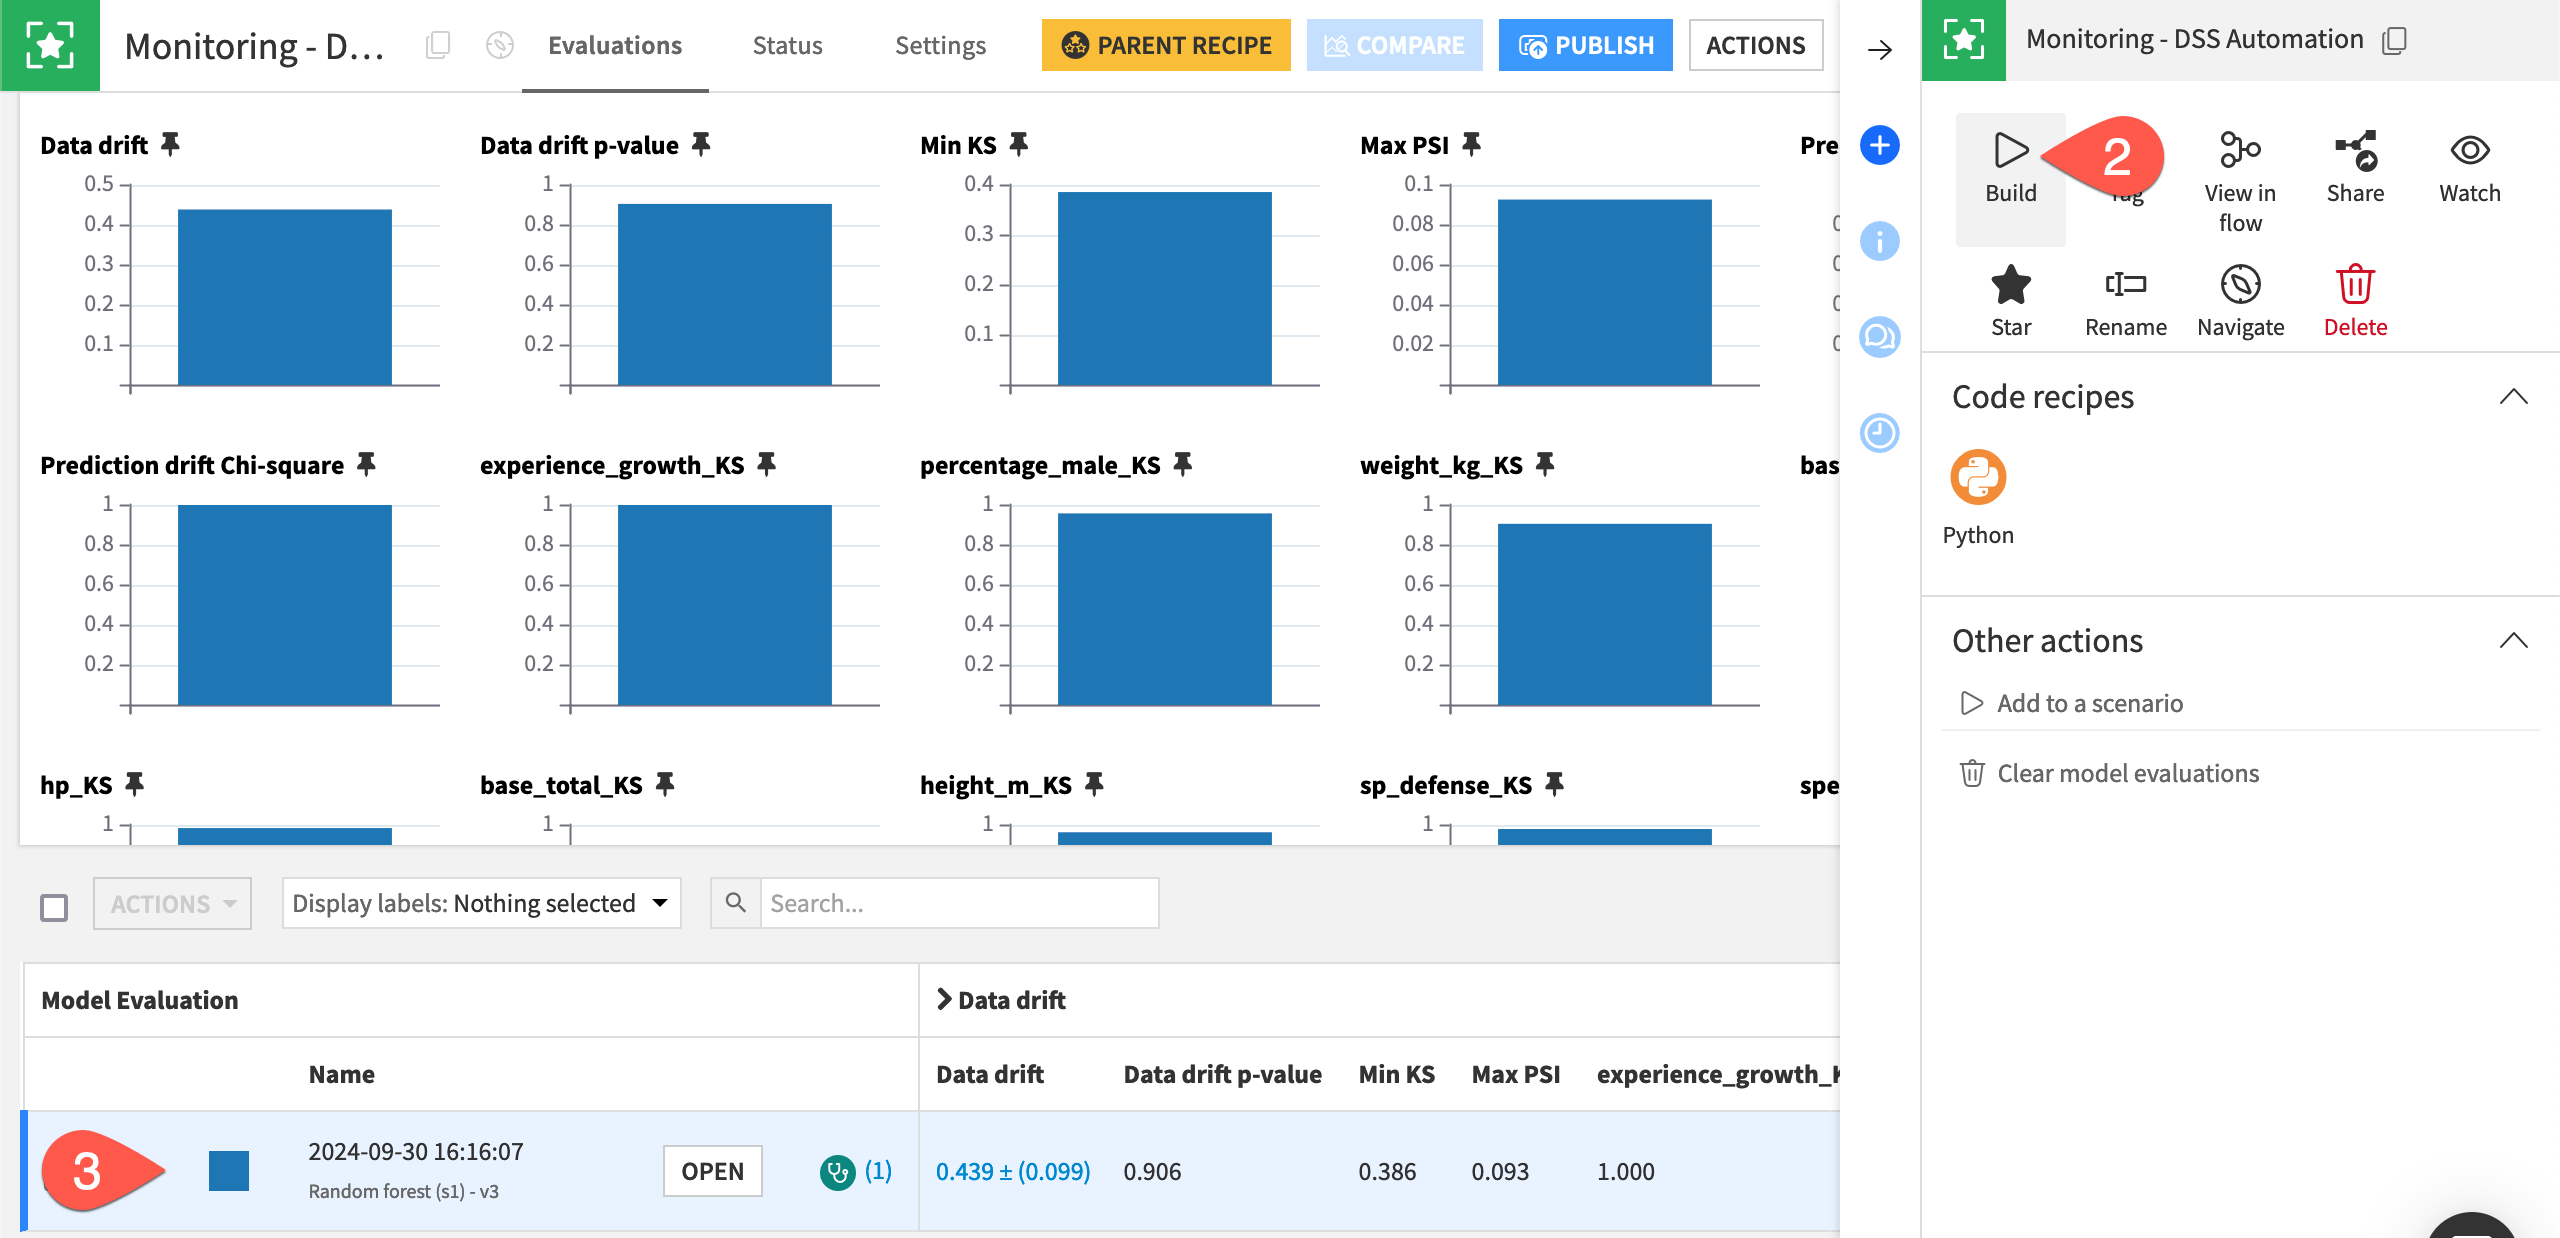
In the Dataiku Monitoring (Batch) Flow zone, open the empty model evaluation store called Monitoring - DSS Automation.
From the Actions tab of the right panel, click Build > Build Evaluation Store, thereby running the Evaluate recipe.
When the job finishes, refresh the page to find one model evaluation.
See also
Review the reference documentation on model evaluations if this is unfamiliar to you.
Automate model monitoring#
The same automation toolkit of metrics, checks, and scenarios that you find for Dataiku objects like datasets also is available for model evaluation stores.
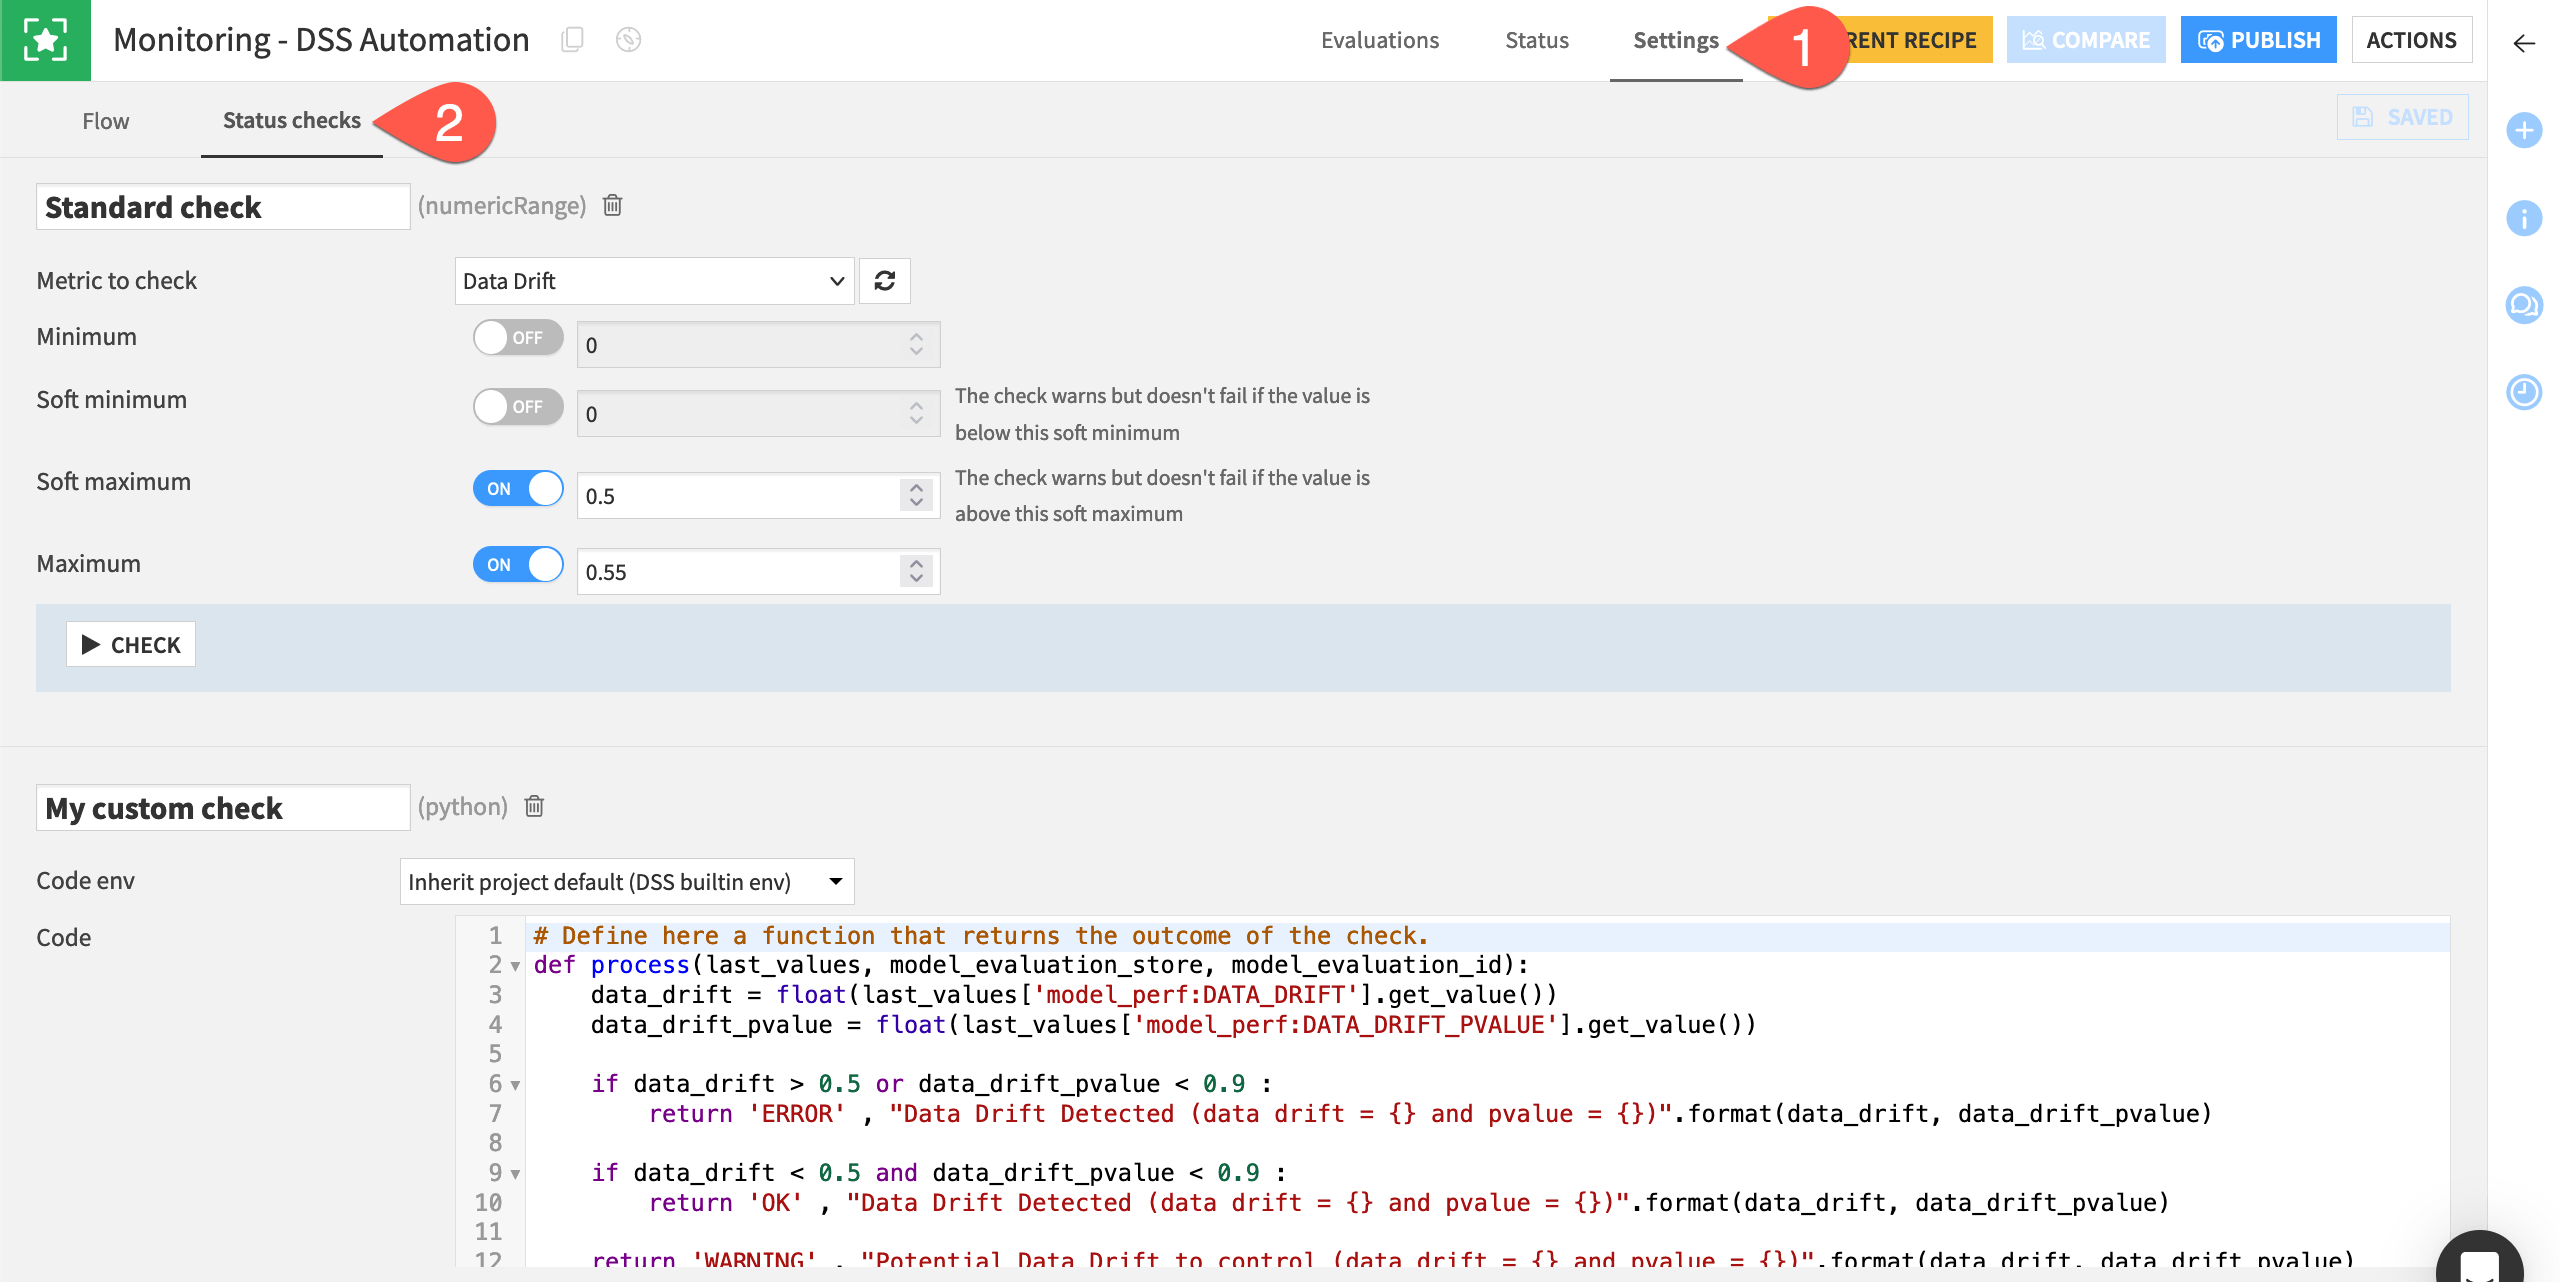
Within the Monitoring - DSS Automation MES, navigate to the Settings tab.
Go to the Status Checks subtab.
Observe the example native and Python checks based on the data drift metric.
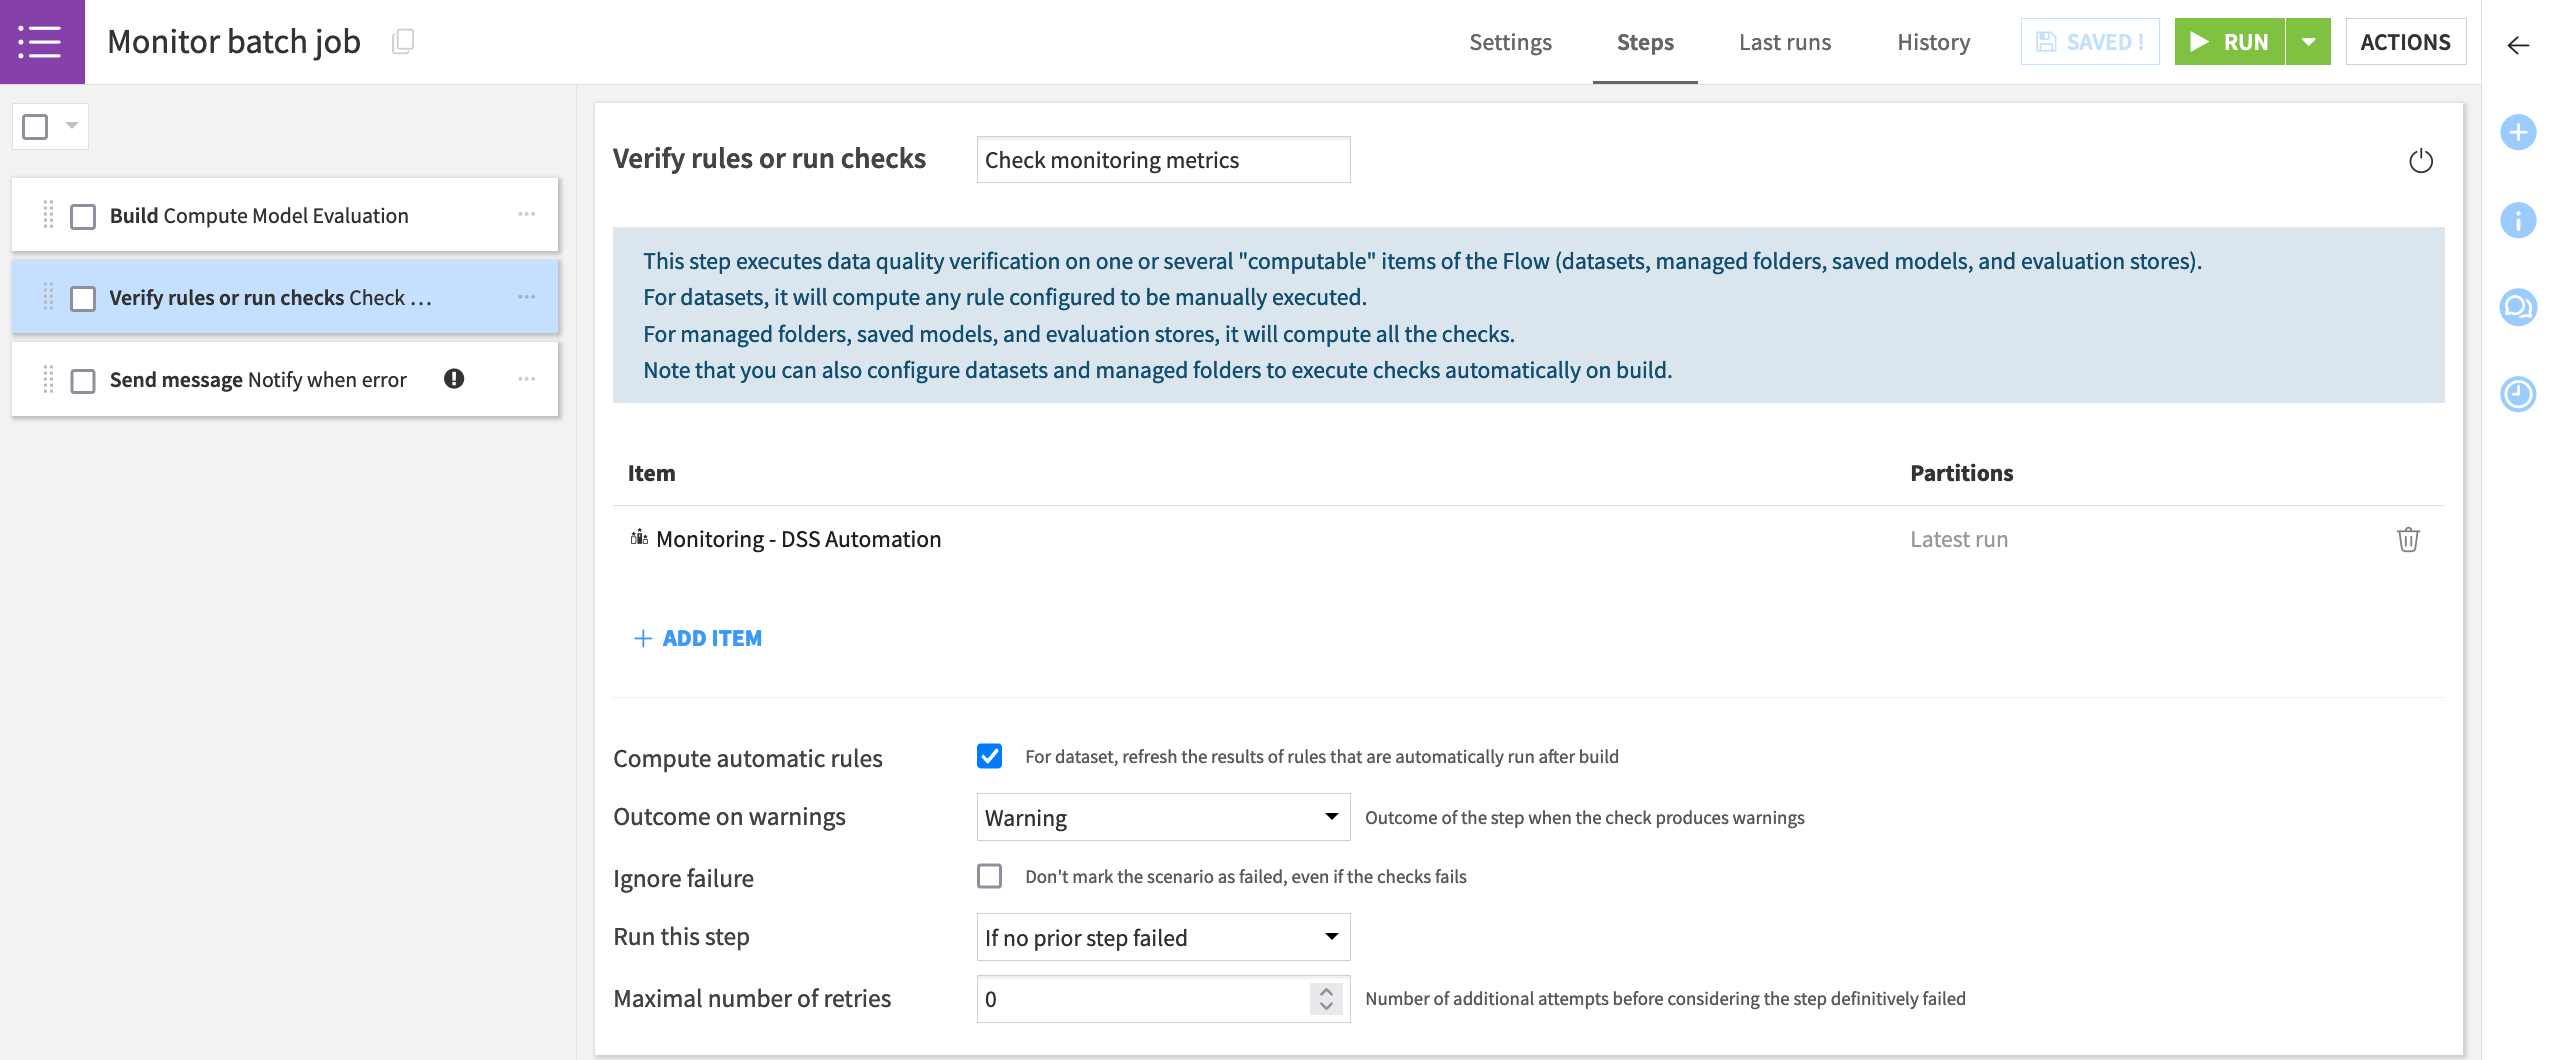
With acceptable limits for each chosen metric formally defined in checks, you can then leverage these objects into a scenario. For example, the Monitor batch job scenario included in the project:
Computes the model evaluation with the data at hand.
Runs checks to determine if the metrics have exceeded the defined threshold.
Sends alerts if any checks return an error or trigger other actions.
Note
The Monitor batch job scenario found in the project uses a Microsoft Teams webhook, but many other reporters are available.
You’ll also notice that the scenario has no trigger attached. Determining how often your scenario should run is highly dependent on your specific use case, but you’ll want to make sure you have enough data for significant comparisons.
Push to the Automation node#
This article presents the basis of building a working operationalized project that will automatically batch score, monitor, and alert. Although simple, it highlights the main components to use such as the Evaluate recipe, the model evaluation store, and scenarios controlled by metrics, checks, and/or data quality rules.
This simplified example performed both scoring and monitoring on the Design node. However, in a real-life batch use case contained within Dataiku’s universe, both scoring and monitoring should occur on an Automation node. To produce a consistent and reliable Flow, real life cases require a true production environment, separate from the development environment.
Accordingly, the next steps would be to:
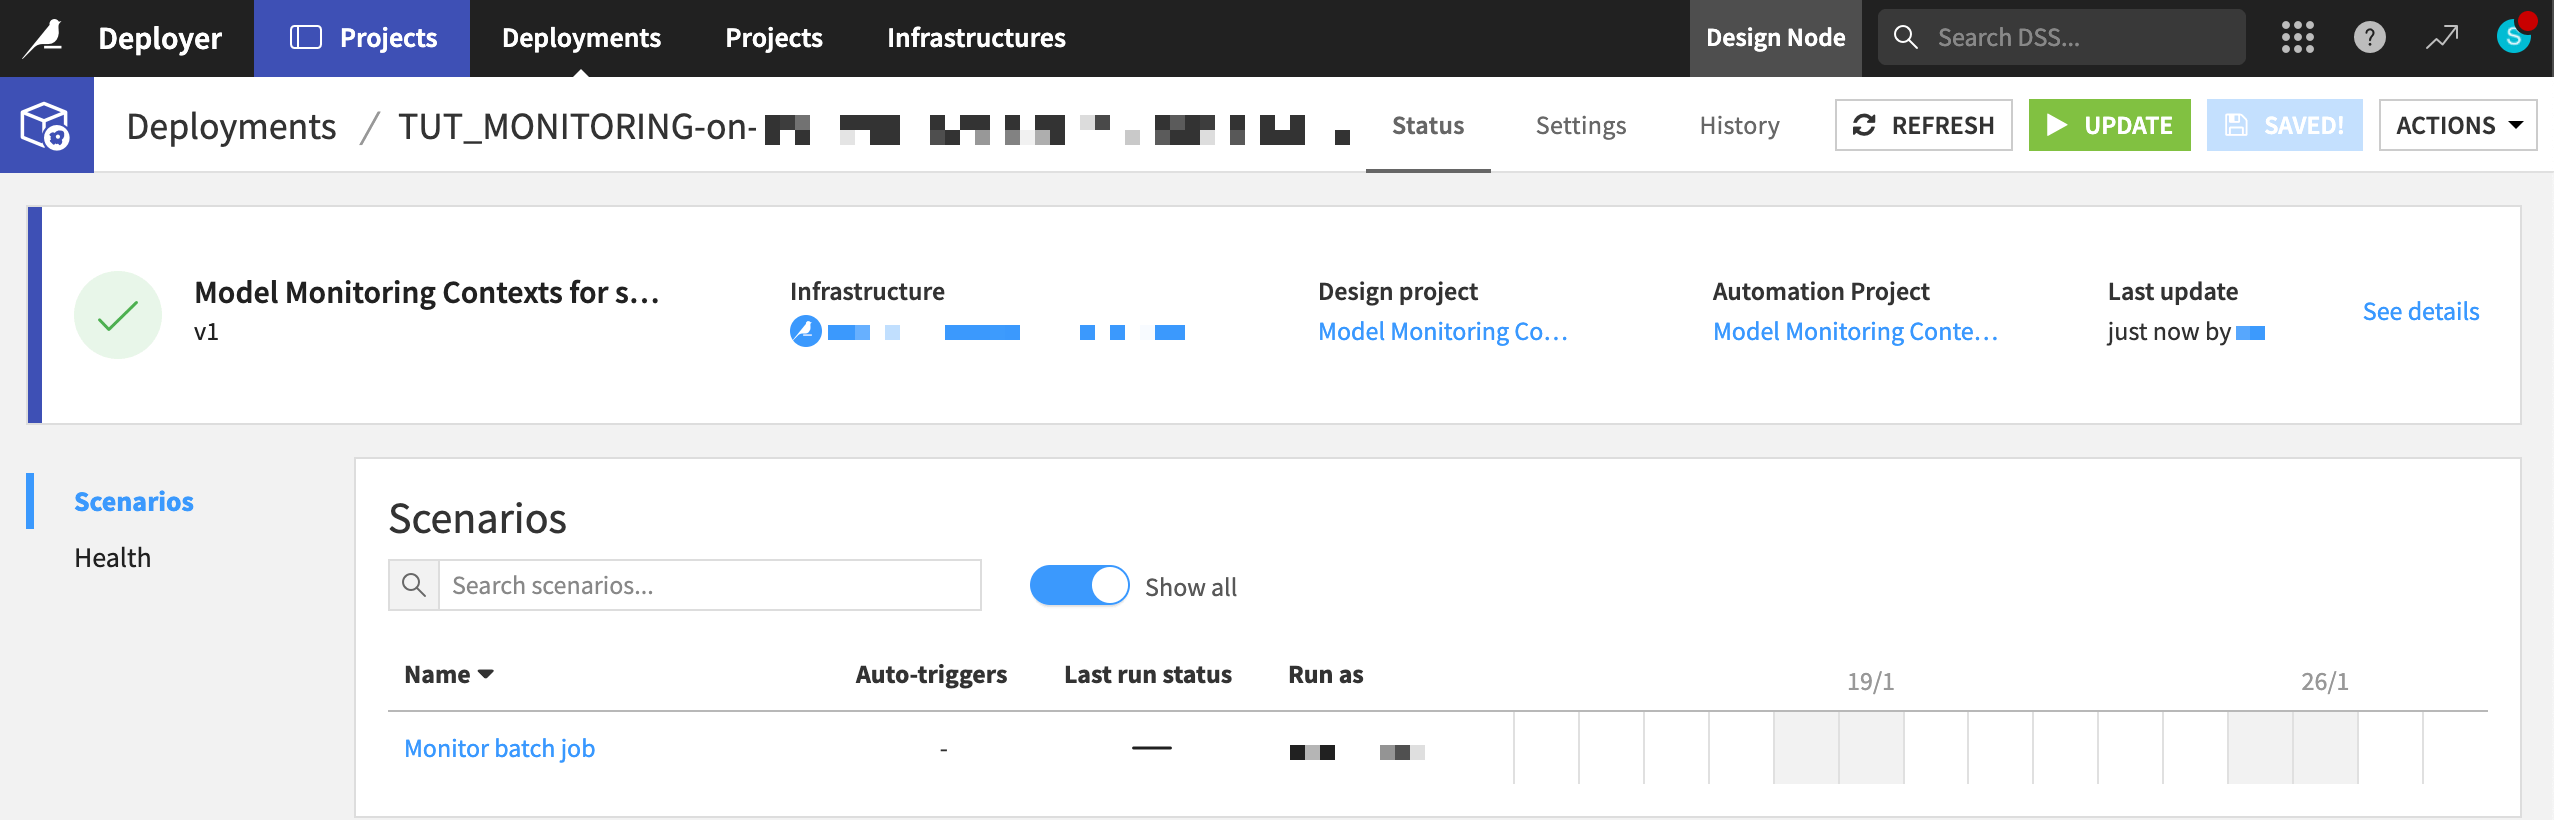
Create a project bundle on the Design node.
Publish the bundle to the Project Deployer (shown below).
Deploy the bundle to the Automation node.
Run scenarios on the Automation node for both the scoring and monitoring — the entire Flow zone Dataiku Monitoring (Batch).
Tip
Follow the Tutorial | Deploy a project bundle to a production environment for a walkthrough of these steps.
An API endpoint on a Dataiku API node#
Many data science workloads call for a real-time API framework. In this framework, queries sent to an API endpoint receive an immediate response.
As a means of comparison to other deployment contexts, this section presents how to monitor a model under a real-time API framework staying entirely within Dataiku.
Additional prerequisites#
In addition to the shared prerequisites, you’ll also need:
A Design node connected to the API Deployer and an API node.
Consult the documentation for setting up an API node from the Launchpad and accessing API query logs.
A Design node connected to the API Deployer and an API node.
The Event server installed and configured for audit logging.
Deploy the model as an API endpoint#
The starter project already contains the API endpoint to be monitored. The next step is pushing a version of an API service including the endpoint to the API Deployer.
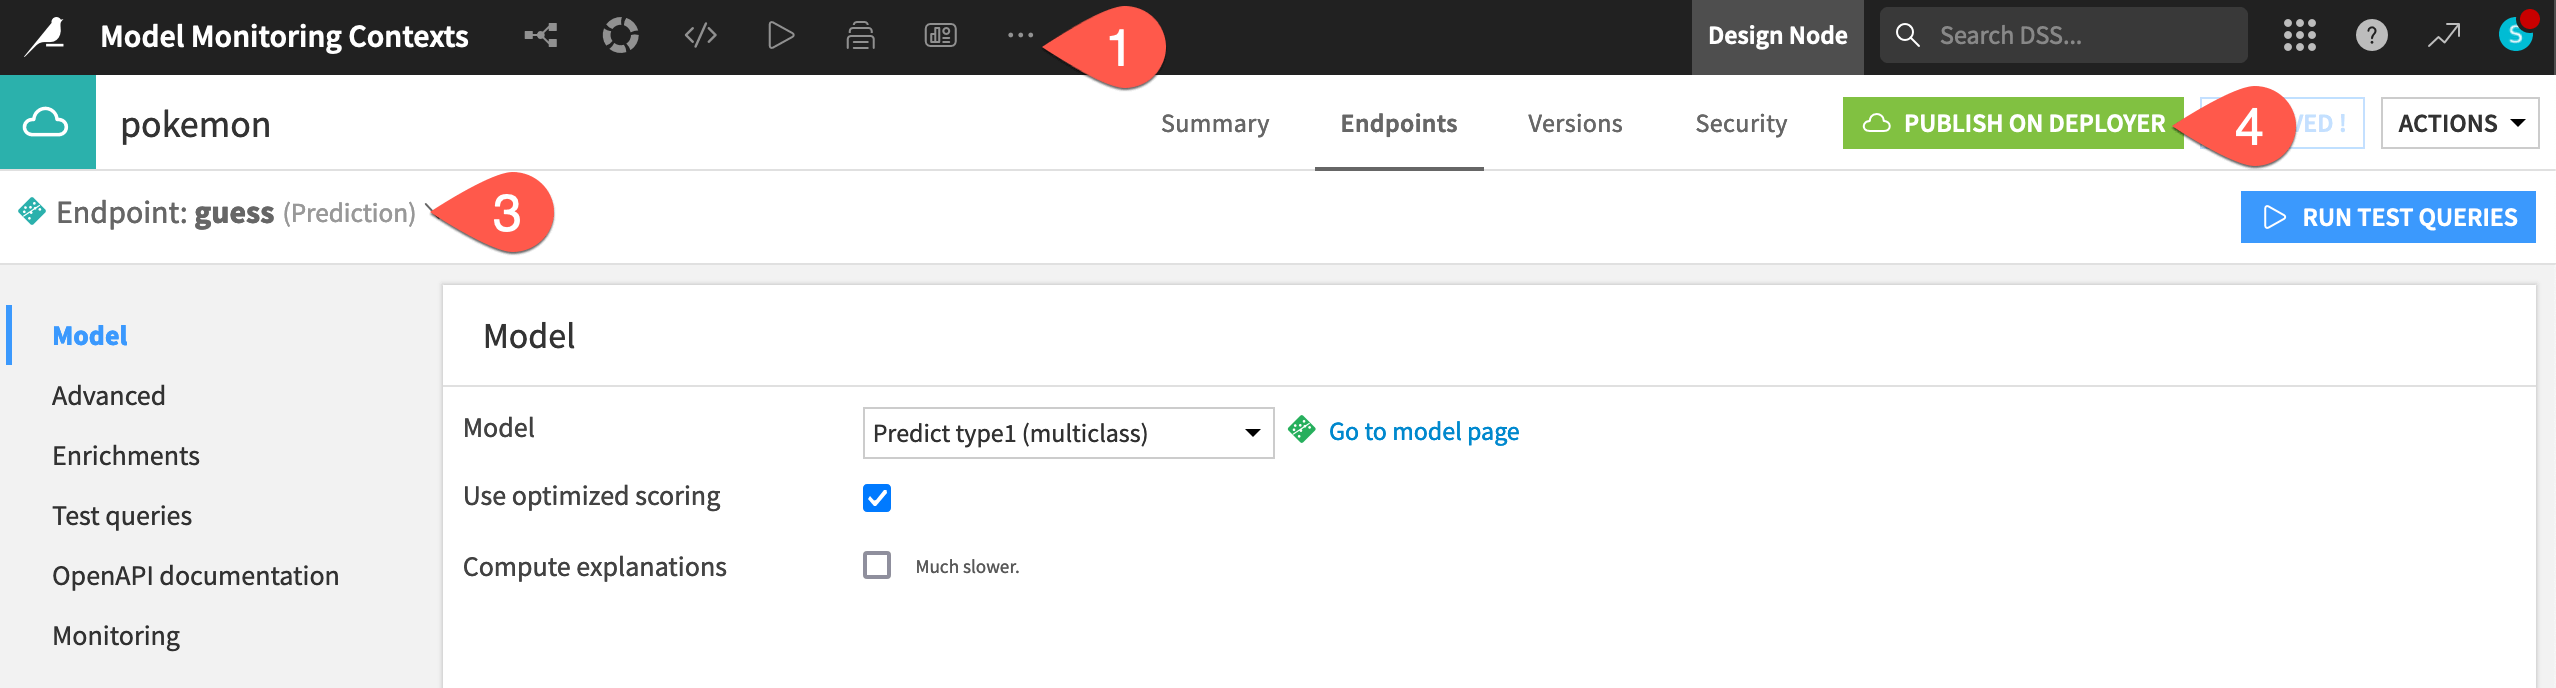
From the top navigation bar, navigate to More Options (
 ) > API Designer.
Open the pokemon API service.
Note how it includes one prediction endpoint called guess using the model found in the Flow.
Click Publish on Deployer and Publish to confirm publishing v1 of the service to the API Deployer.
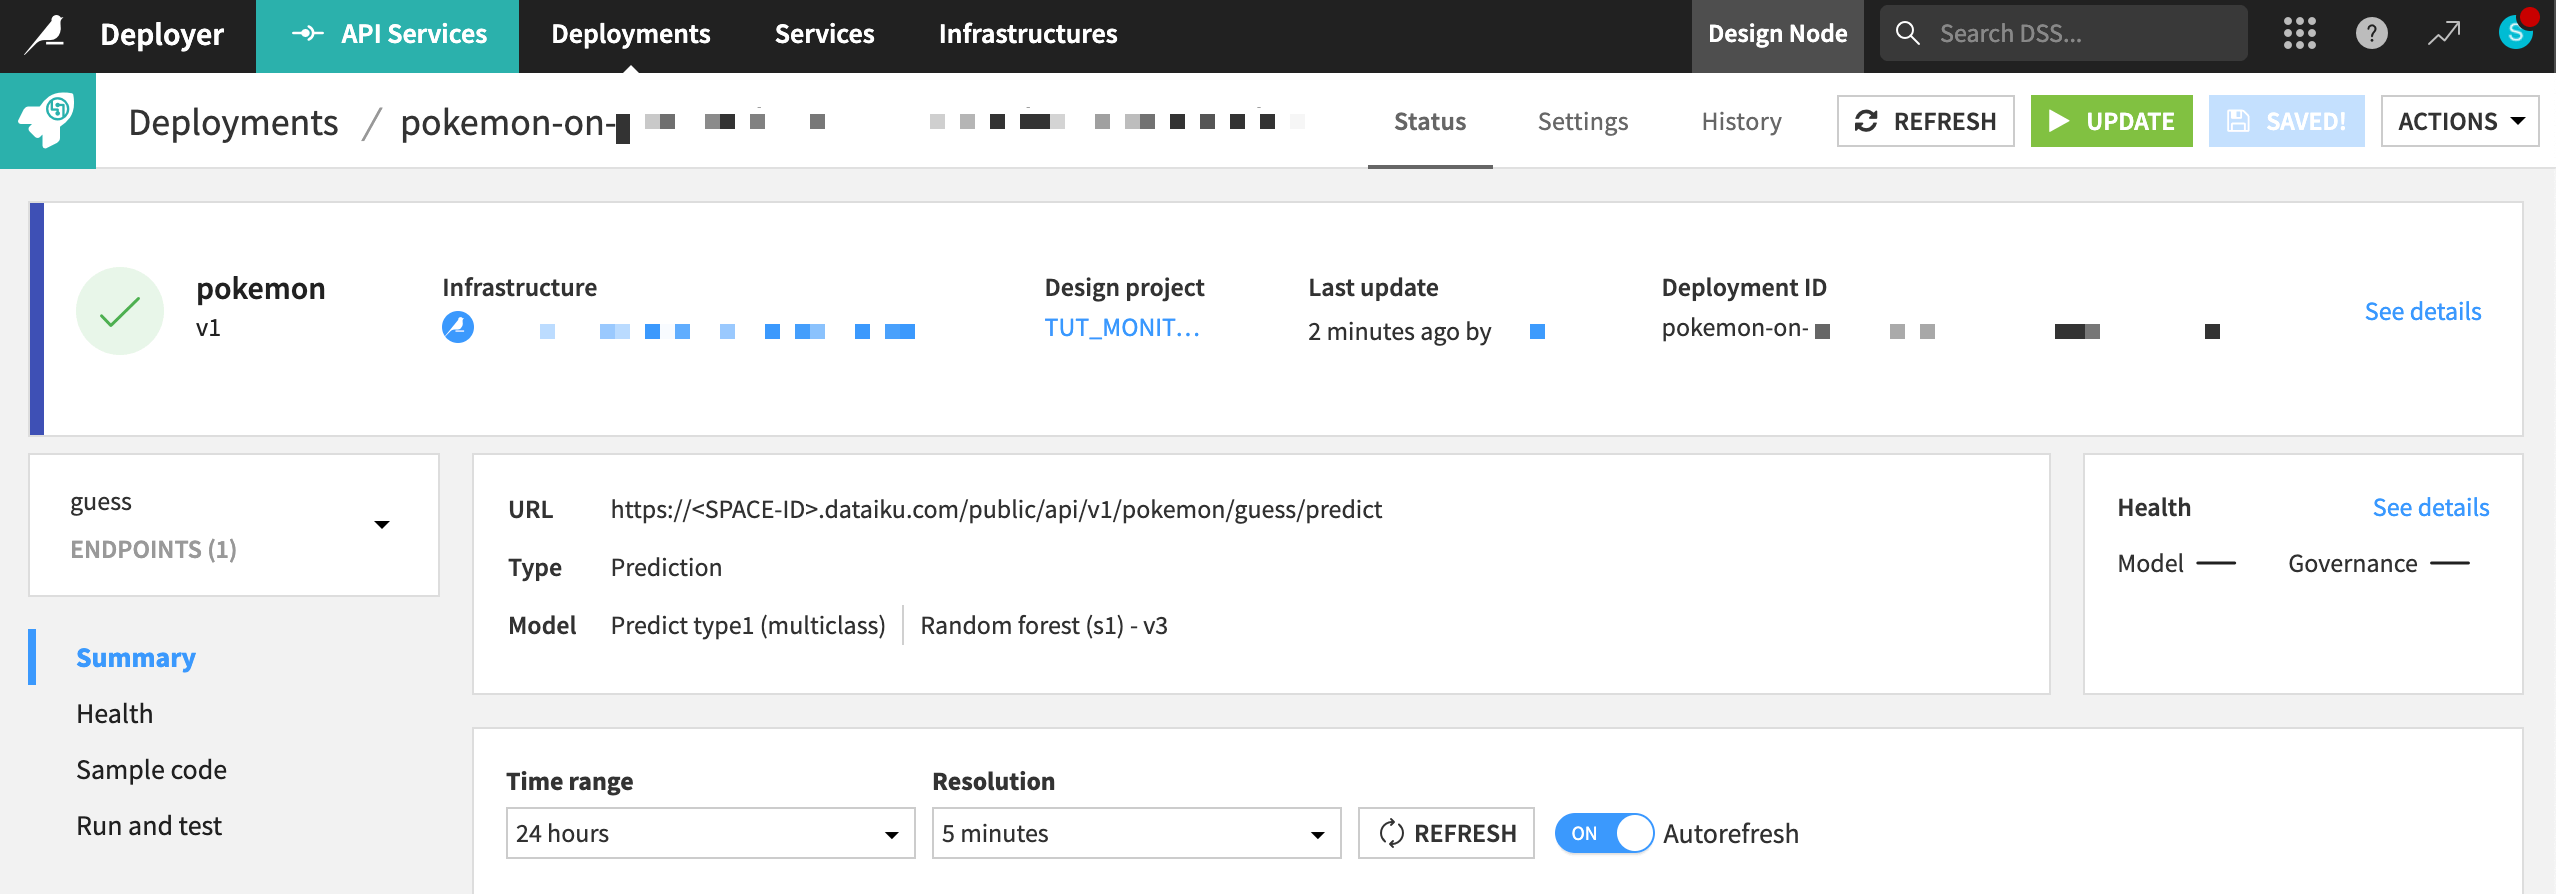
Once the API service exists on the API Deployer, you can deploy the service to an infrastructure.
From the waffle (
 ) menu in the top navigation bar, click Local (or Remote) Deployer.
Click Deploying API Services.
In the Deployments tab of the API Deployer, find the API version that you pushed to the API Deployer, and click Deploy.
If not already selected, choose an infrastructure.
Click Deploy and Deploy again to confirm.
See also
To review the mechanics of real-time API deployment in greater detail, please see Tutorial | Deploy an API service to a production environment.
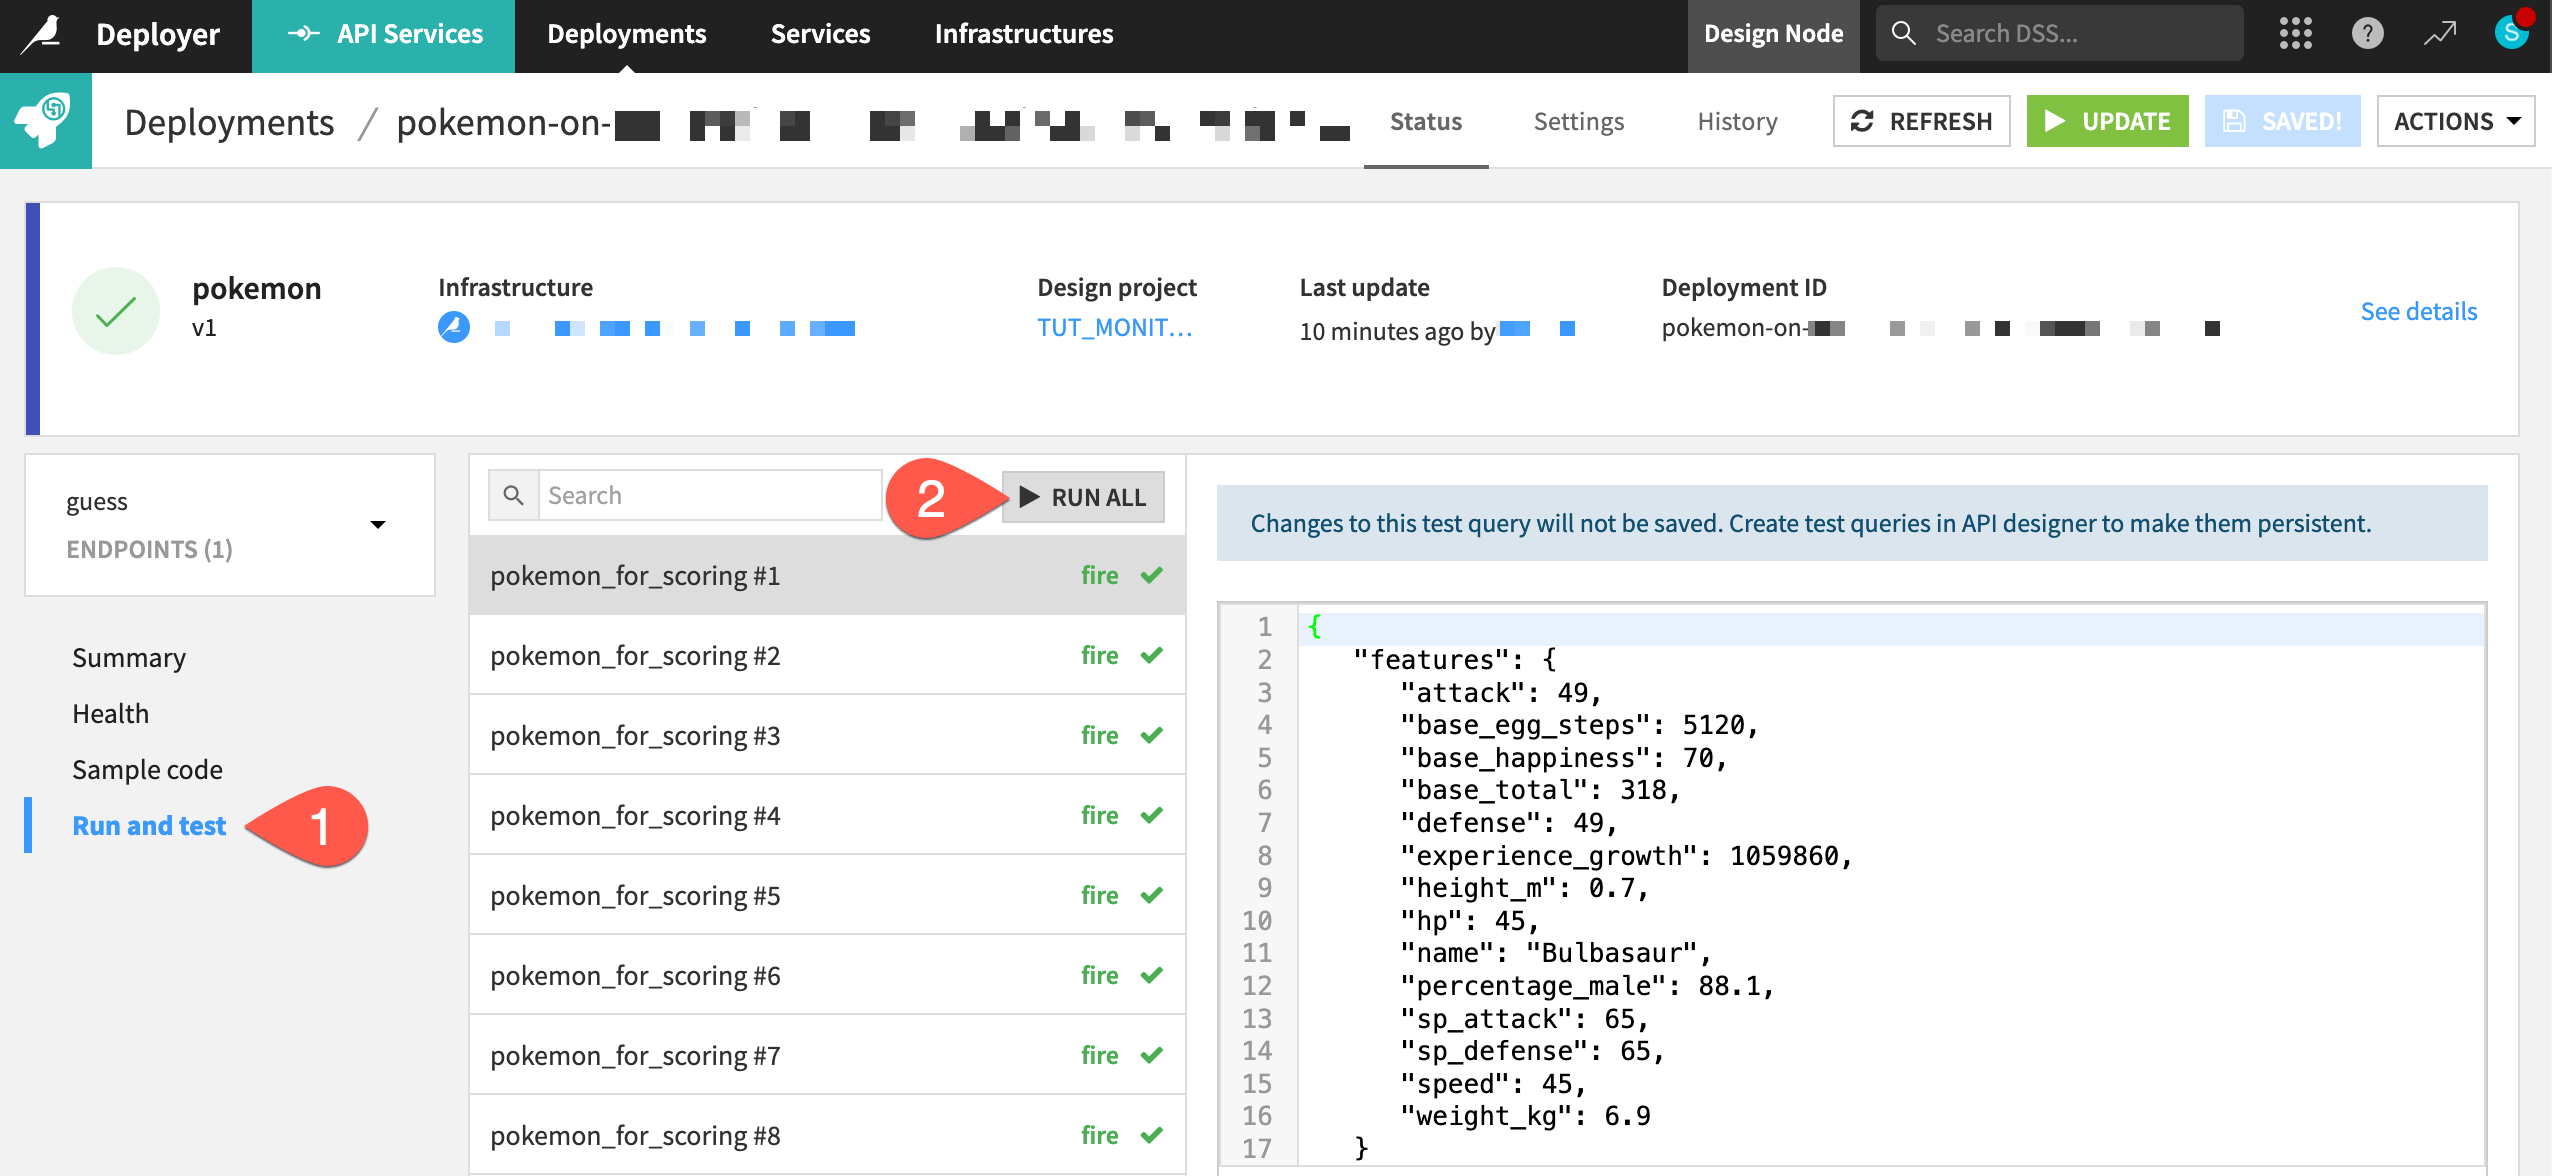
Generate activity on the API endpoint#
Before you set up the monitoring portion of this project, you need to generate some activity on the API endpoint. That way, you have actual data on the API node to retrieve in the feedback loop.
Within the Status tab of the deployment, navigate to the Run and test panel for the guess endpoint.
Click Run All to send several test queries to the API node.
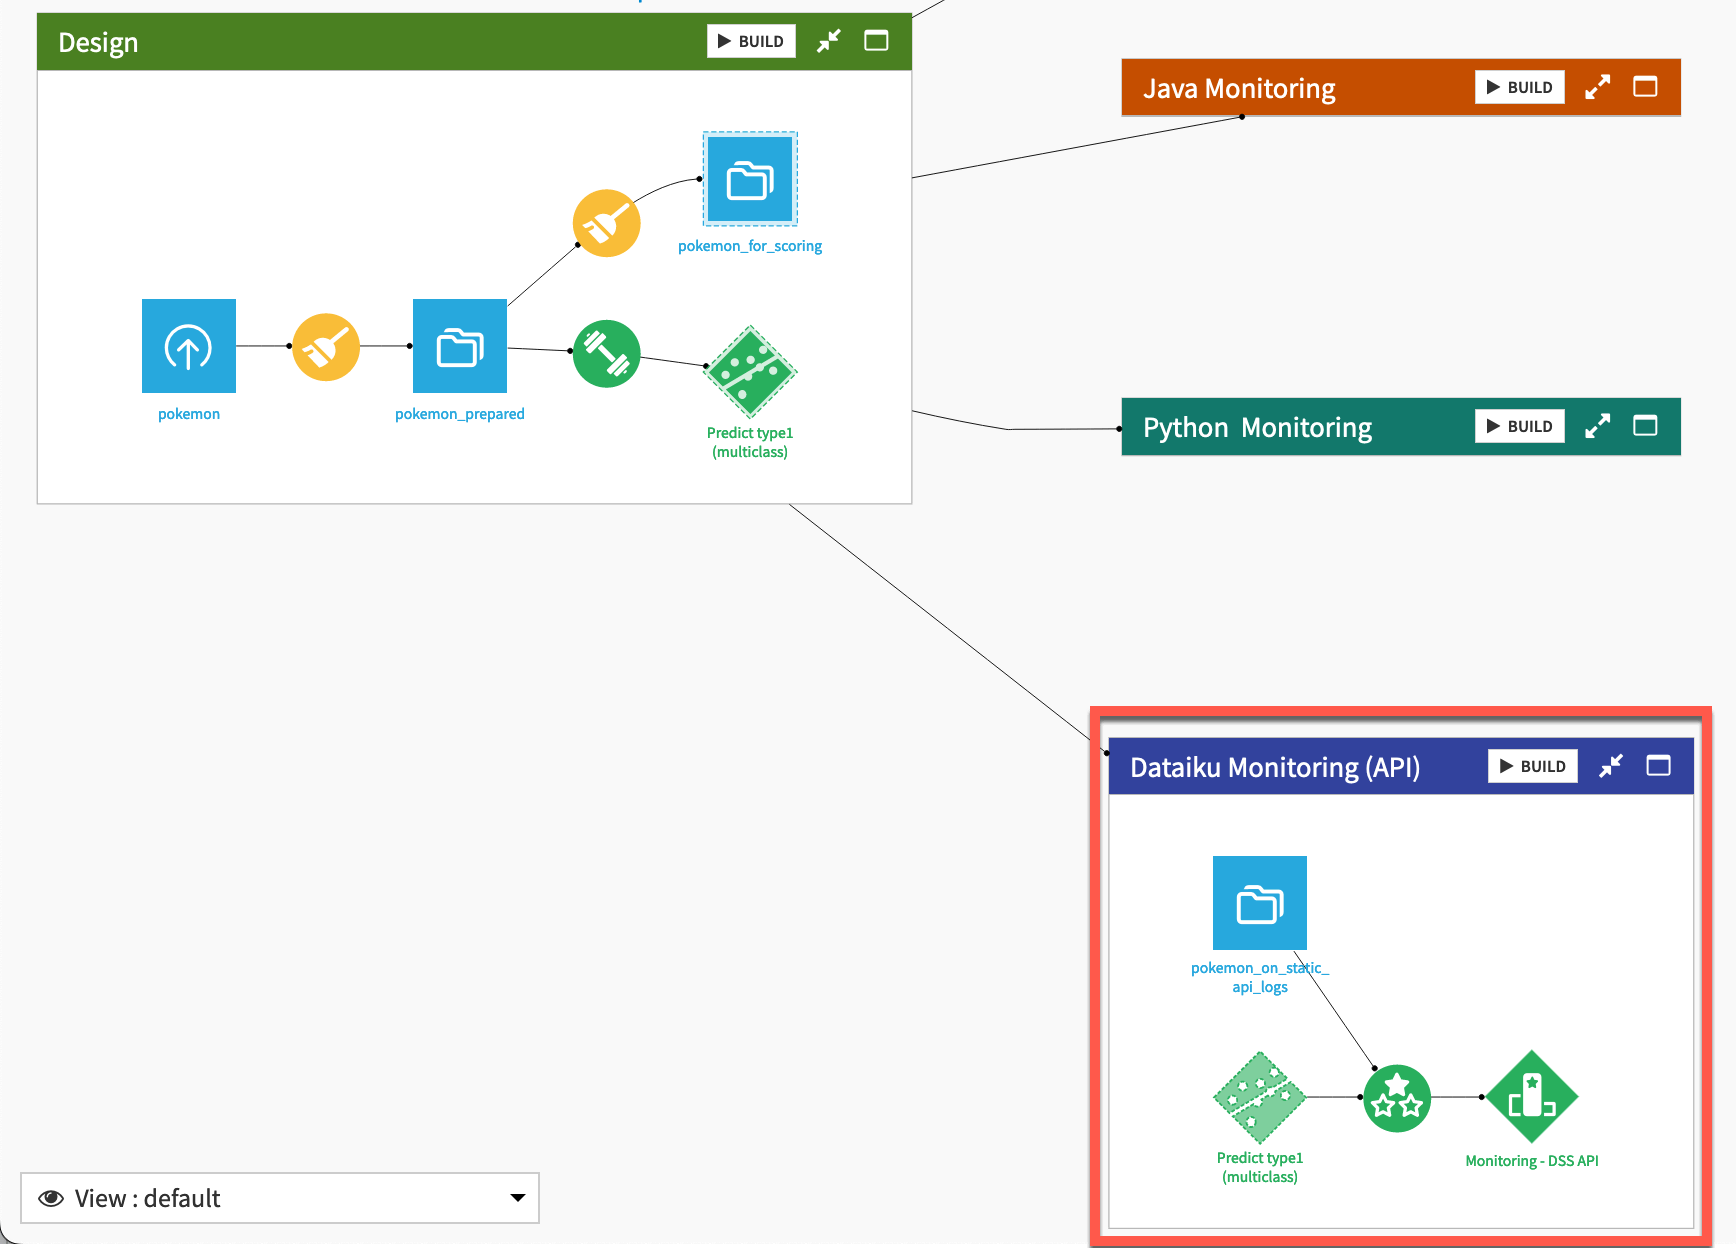
Create a feedback loop on the API endpoint#
Now direct your attention to the Dataiku Monitoring (API) Flow zone. Like the batch Flow zone, this zone includes an Evaluate recipe that takes two inputs (a dataset of predictions and a saved model) and outputs a model evaluation store. However, there are two subtle differences.
API node log data#
The input data in this context comes directly from the API node. As explained in Tutorial | API endpoint monitoring, the storage location of this data differs for Dataiku Cloud and self-managed users.
Follow the steps in Audit trail on Dataiku Cloud to access API node queries.
Once you’ve imported this dataset, replace pokemon_on_static_api_logs with the apinode_audit_logs dataset as the input to the Evaluate recipe in the Dataiku Monitoring (API) Flow zone.
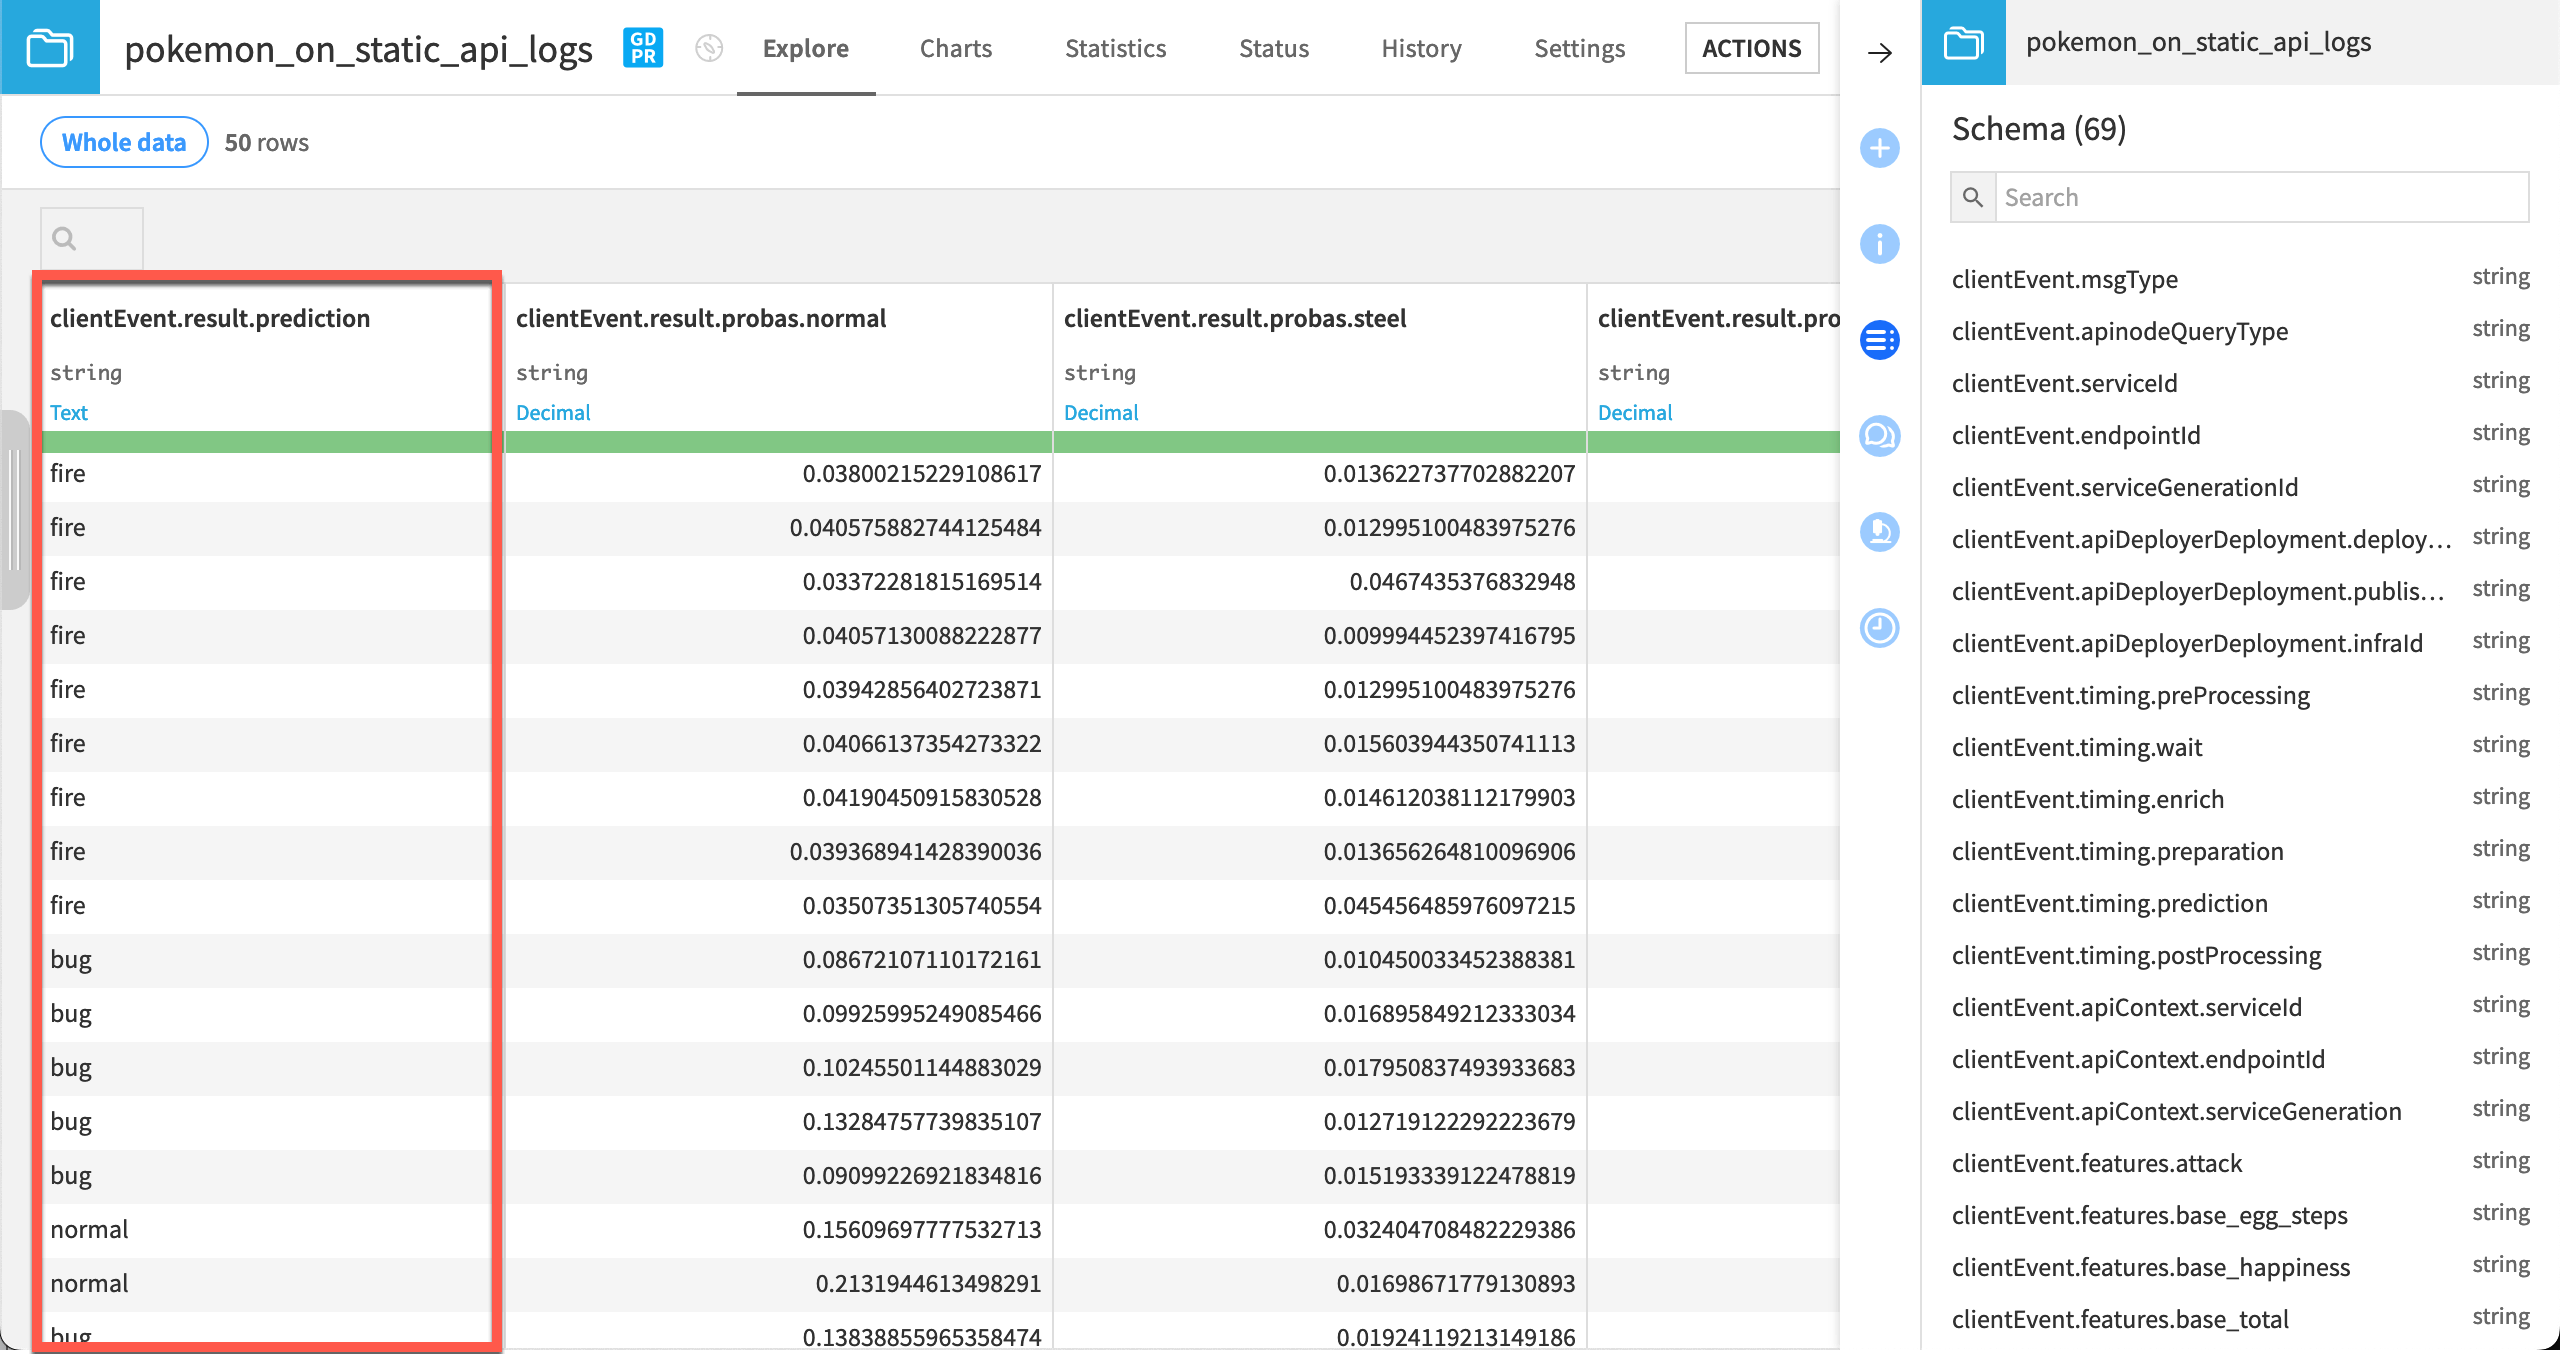
The pokemon_on_static_api_logs dataset must point to the storage of the API endpoint prediction logs according to the Event server’s configuration. An admin can find this information under Administration > Settings > Event Server on the Design node.
Open the pokemon_on_static_api_logs dataset. There will be an error that it doesn’t exist.
Navigate to the Settings tab.
In the Files subtab, select the Read from connection specific to the configuration of your Event server.
Click Browse to navigate the file directory, and find the Path specific to the configuration of your Event server.
Click api-node-query, and then select the name of the API deployment for this project.
Click OK, and see a path ending with your API deployment.
Click List Files to observe which logs are available, and Save when ready.
After pointing this dataset to the correct prediction logs, you can now explore it. Each row is an actual prediction request that the model answered. You can find all the features requested, the resulting prediction, with details and other technical data.
Warning
This tutorial uses a local filesystem storage for the API node logs to make the project import easier. In a real situation however, any file-based cloud storage is highly recommended. This data can grow quickly, and it won’t decrease unless explicitly truncated.
It would also be common to activate partitioning for this dataset.
The Evaluate recipe with API node logs as input#
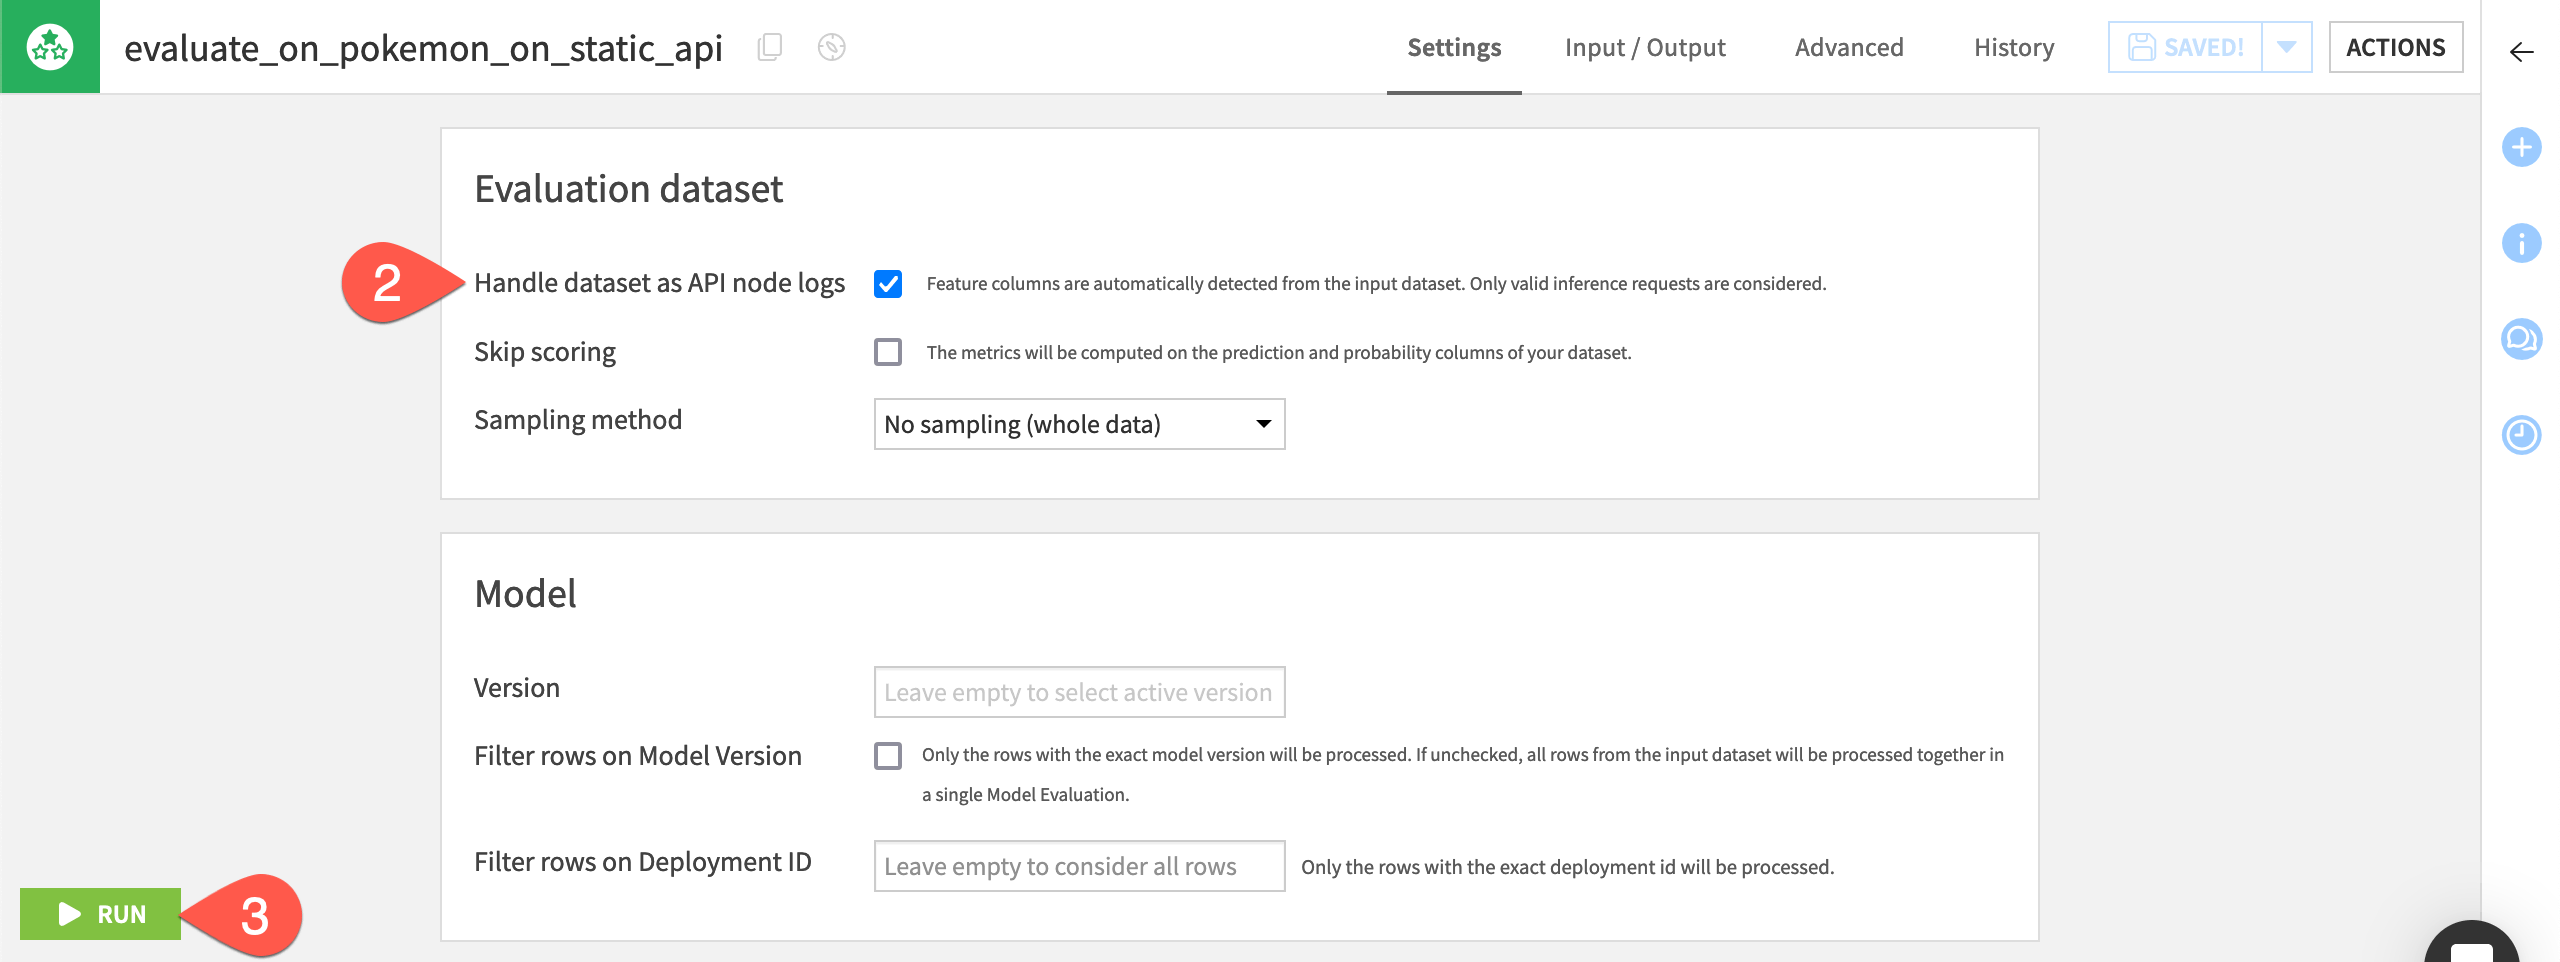
There is another subtle difference between the Evaluate recipe in the API Flow zone compared to the Batch Flow zone. In the API Flow zone, the Evaluate recipe automatically handles the input data as API node logs.
With this activated (detected by default), you don’t need to care about all the additional columns or the naming.
Open the Evaluate recipe in the Dataiku Monitoring (API) Flow zone.
Confirm that the recipe will handle the input dataset as API node logs.
Click Run to produce a model evaluation of the API node logs.
Note
If using a version of Dataiku before 11.2, you will need to add a Prepare recipe to keep only the features and prediction columns. Then, rename them to match the initial training dataset convention.
Create a one-click monitoring loop#
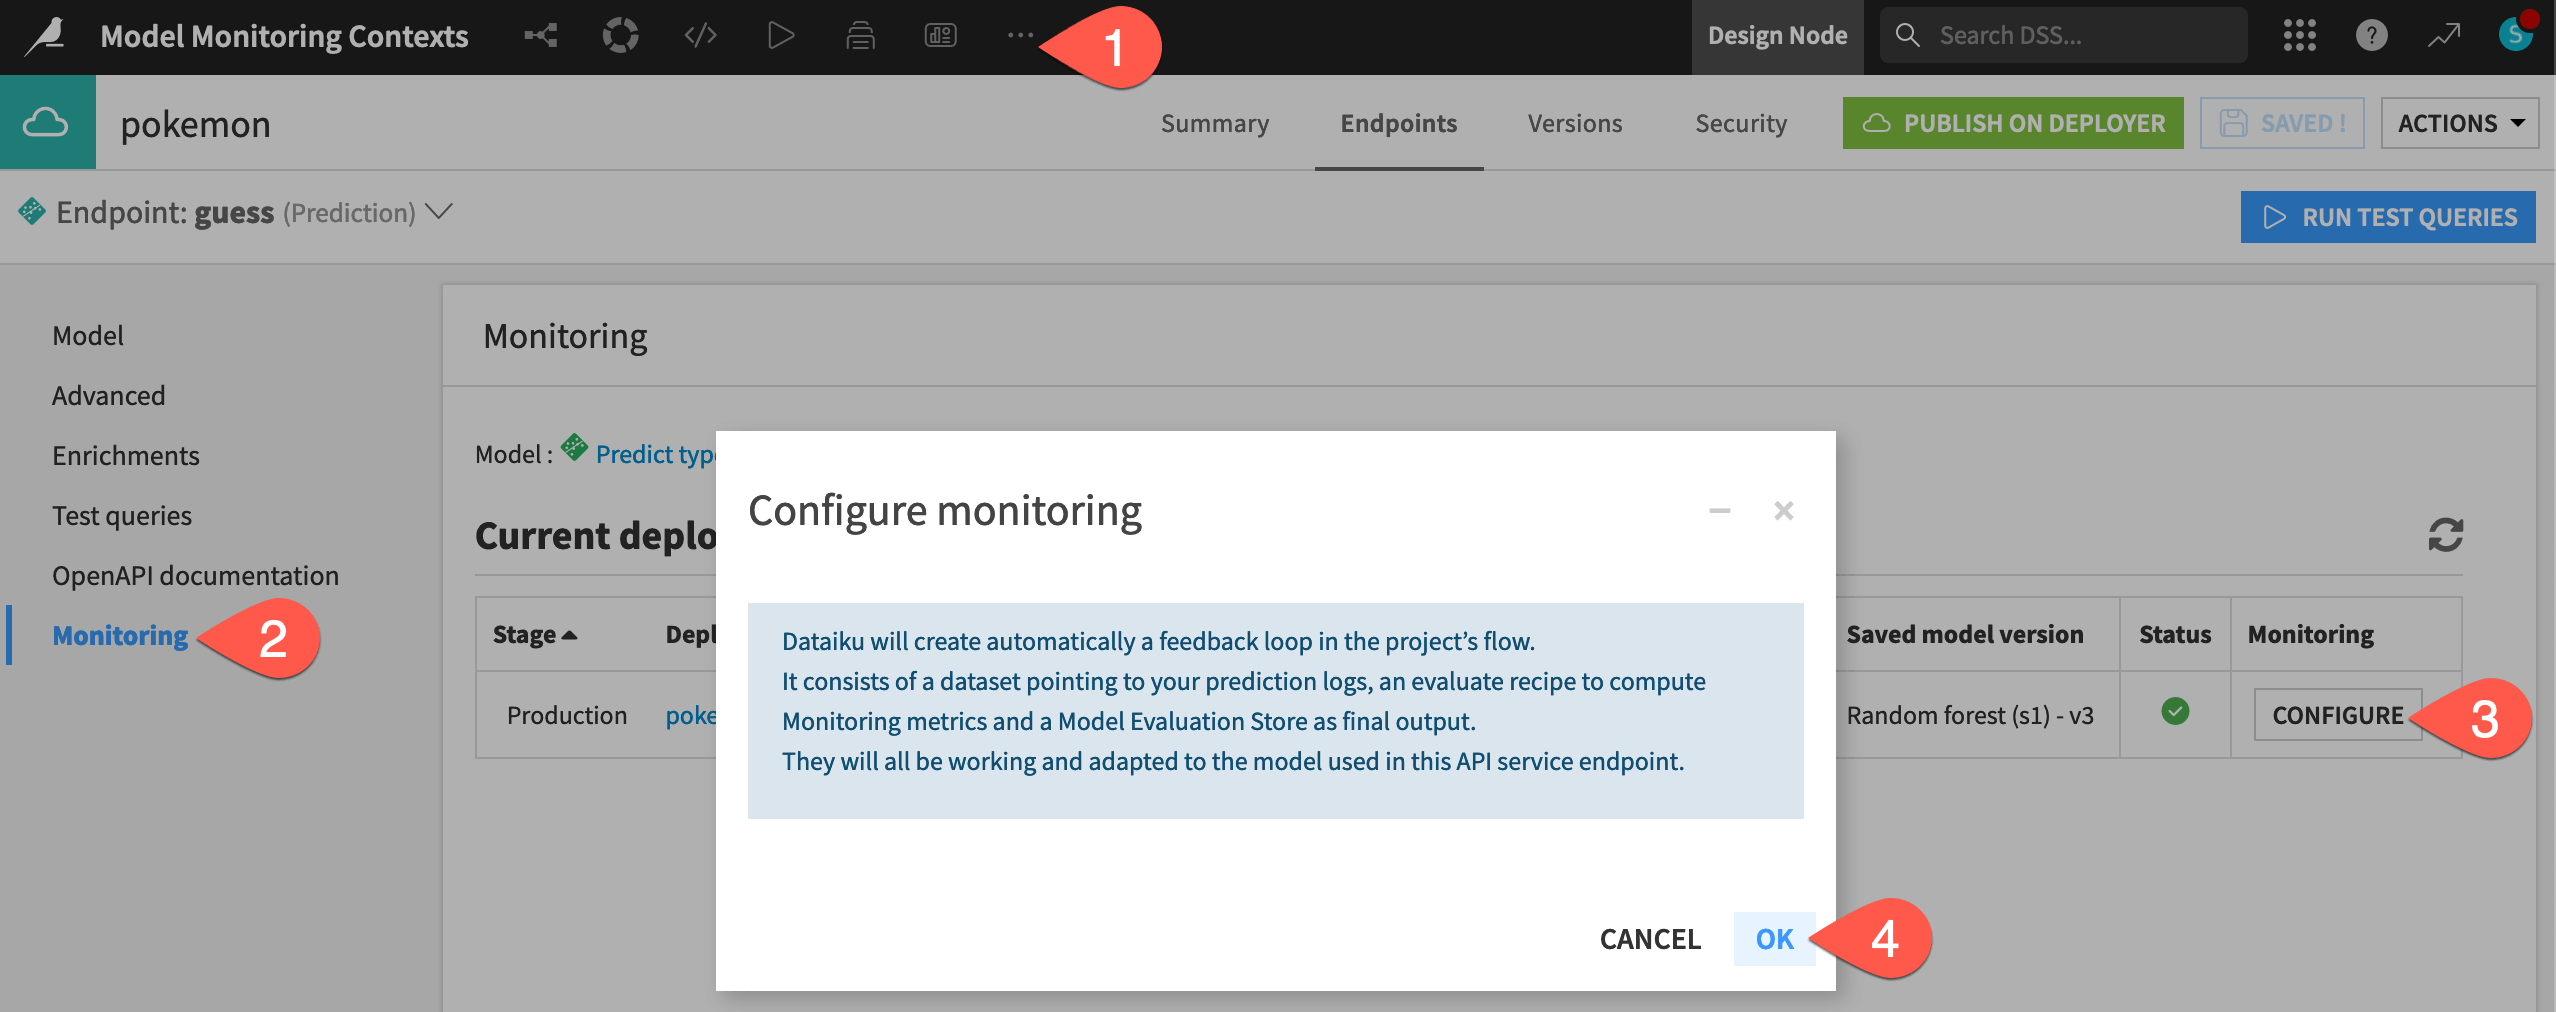
Since version 12, users can simplify this process by building the entire feedback loop directly from the API endpoint in the API Designer.
From the top navigation bar of the Design node, navigate to More Options (
) > API Designer.Open the pokemon API service.
Navigate to the Monitoring panel for the guess endpoint.
Click Configure to create a monitoring loop for this endpoint.
Click OK, and then return to the Flow to see the new zone, which, in this case, duplicates the work of the existing Dataiku Monitoring (API) Flow zone.
An exported Python model scored externally#
Depending on the deployment context, you may wish to export a model designed in Dataiku so that it can run on an external system. For example, a model may need to run within a more complete pipeline including tasks before and after the model call. However, even if model scoring occurs externally, model monitoring can still occur within Dataiku.
This section presents how to monitor a model within Dataiku in situations where the model is exported to Python and scored externally.
Additional prerequisites#
In addition to the shared prerequisites, you’ll also need:
Basic knowledge of Python.
Python 3 on your machine.
A Dataiku instance with the Python model export feature activated.
Export the model#
For scoring to occur outside of Dataiku, you’ll first need to export the model used in the starter project.
Double click to open the saved model deployed to the Flow.
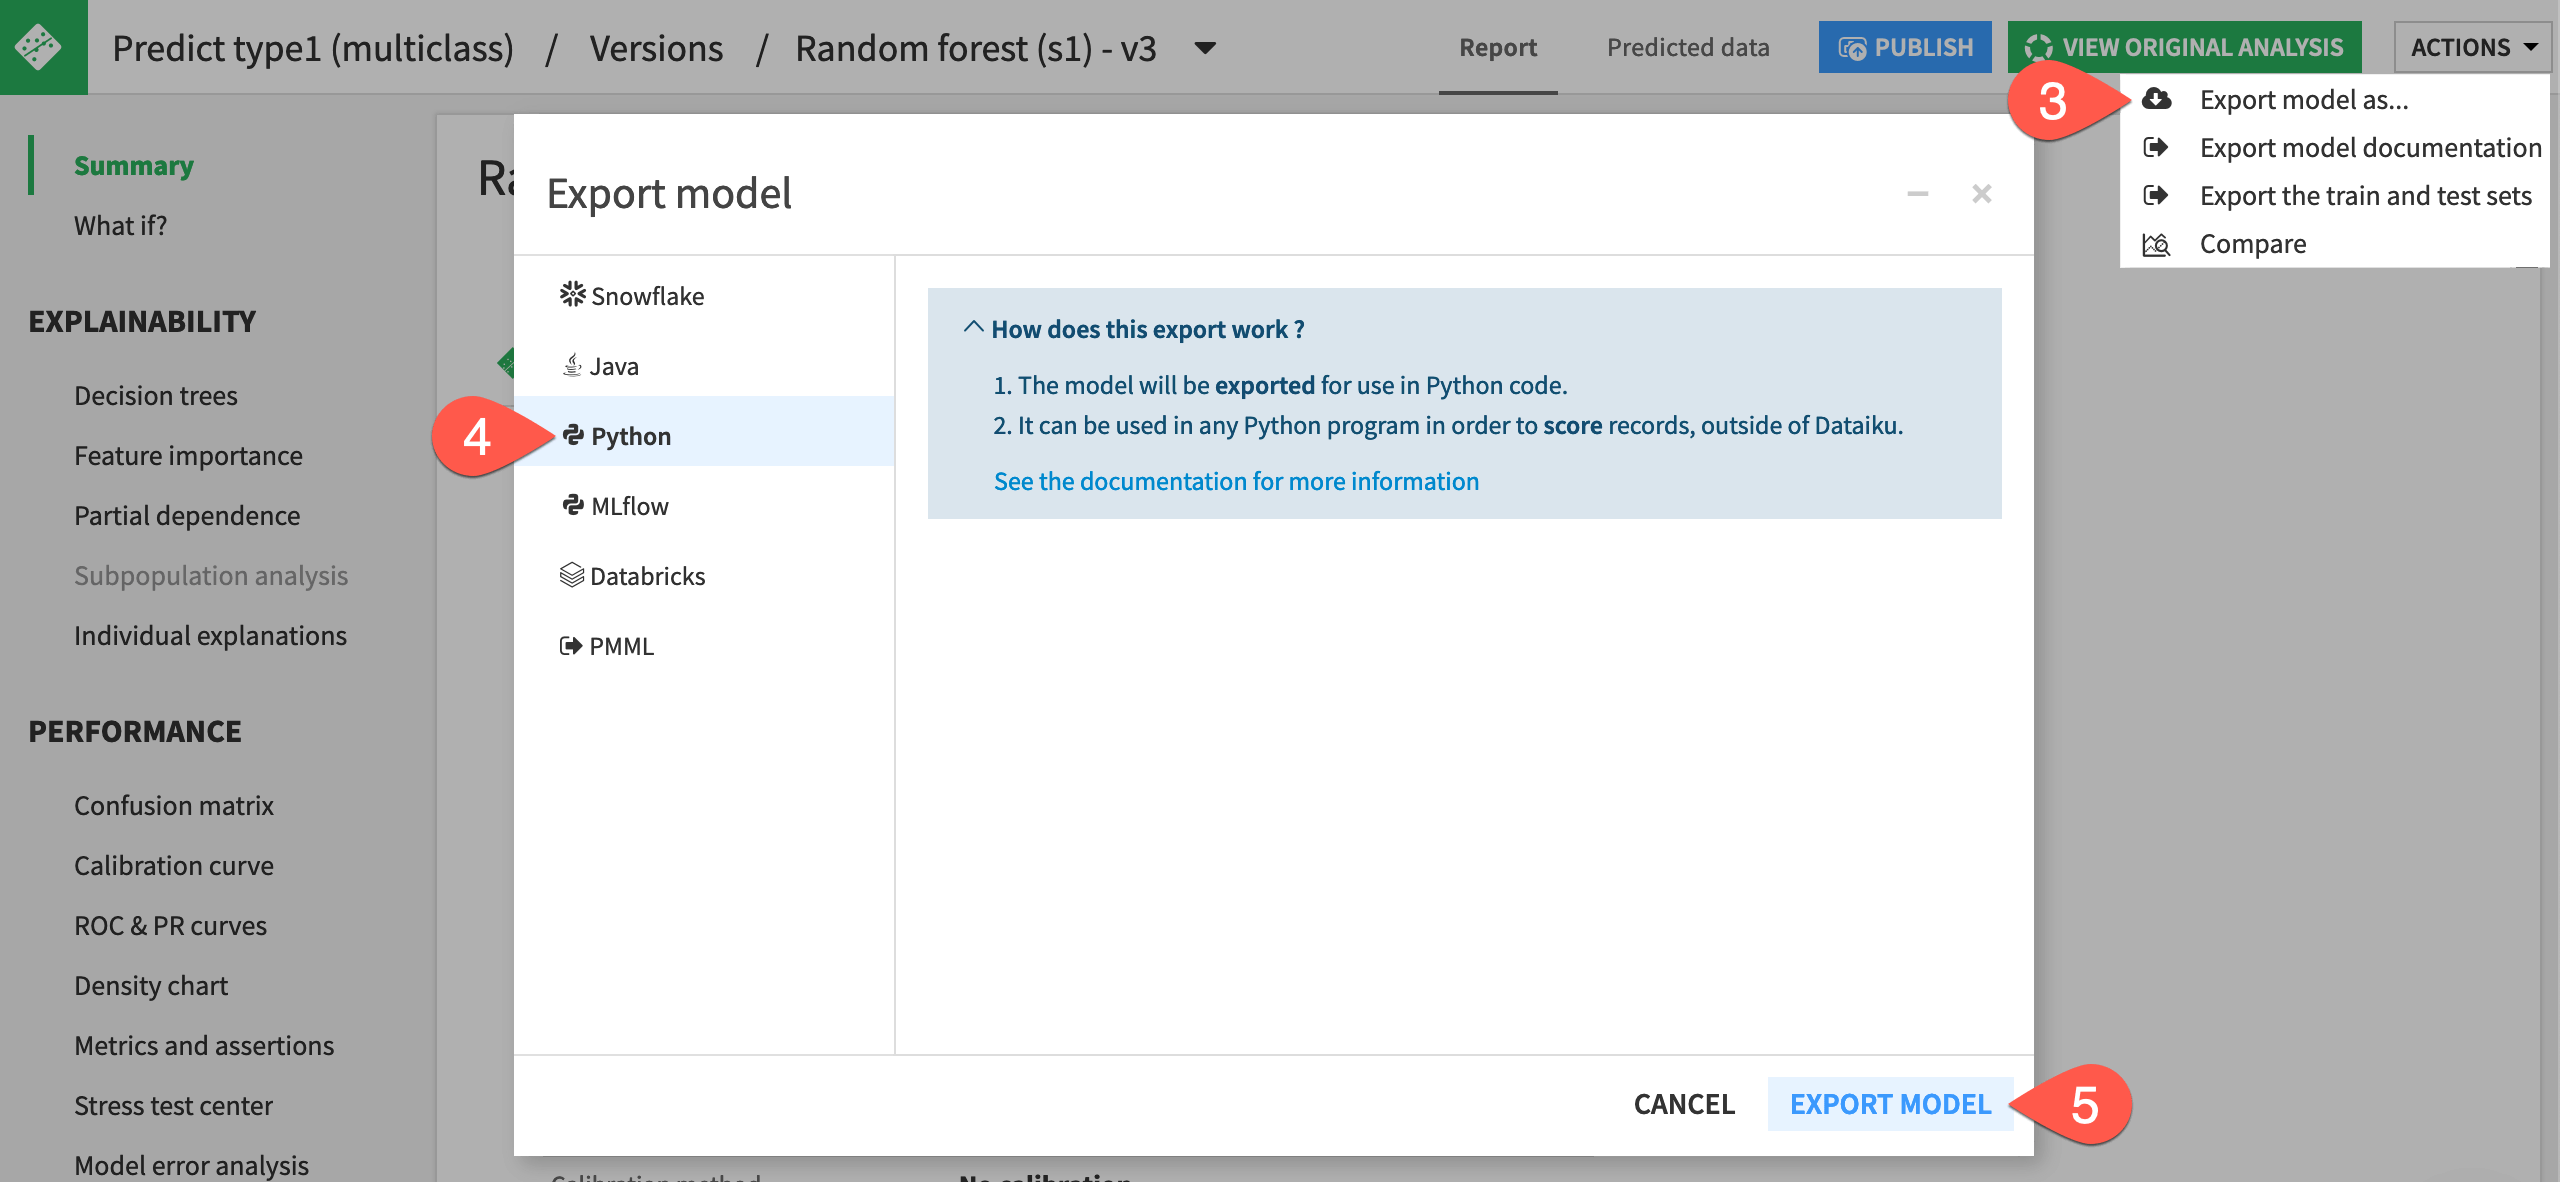
Open the report for the Active version by clicking on the model name Random forest (s1) - v3 at the top left of the tile.
At the top right of the screen, click Actions > Export model as ….
Select the Python panel.
Click Export Model.
See also
See the reference documentation on Python model exports to understand the requirements, usage, and limitations.
Run the model outside of Dataiku#
This action downloaded onto your machine a ZIP file containing the components needed for scoring directly with Python outside of Dataiku.
Inspect the downloaded package#
Take a look at what Dataiku has provided.
Unzip the downloaded package to find:
File name |
Contents |
|---|---|
|
The exported model |
|
The Python module required to run the model |
|
A sample script for making predictions |
Set up the environment#
The next step is to check that your environment and downloaded model is ready by running a sample script.
On the terminal, navigate to the directory holding these files.
Create a virtual environment for your tests.
virtualenv python-export
Activate that environment.
source python-export/bin/activate
You’ll need to make two small adjustments for the sake of this tutorial.
Open the
requirements.txtfile, and remove the specific version requirements on the dataiku-scoring package.Add
pandasas a second requirement. (This isn’t mandatory for scoring, but you’ll use it in a Python script later).Load the requirements file.
pip install -r requirements.txt
Once that’s setup, call the sample script to validate the environment.
python sample.py
This should output the following:
Output of model.predict():
array(['fire', 'fire'], dtype=object)
Output of model.predict_proba():
{'bug': array([0.02705888, 0.0306321 ]),
 'dark': array([0.05454764, 0.03727579]),
 'dragon': array([0.07957995, 0.00496544]),
 'electric': array([0.06280624, 0.06476114]),
 'fairy': array([0.02217147, 0.03600387]),
 'fighting': array([0.05453975, 0.06410458]),
 'fire': array([0.15311388, 0.24131331]),
 'flying': array([0.0058496 , 0.00308777]),
 'ghost': array([0.04494048, 0.029513  ]),
 'grass': array([0.1031577, 0.1232584]),
 'ground': array([0.04200412, 0.02563218]),
 'ice': array([0.03195237, 0.03471062]),
 'normal': array([0.03372282, 0.0405713 ]),
 'poison': array([0.04058422, 0.06011815]),
 'psychic': array([0.04955909, 0.06700692]),
 'rock': array([0.05377793, 0.0422824 ]),
 'steel': array([0.04674354, 0.00999445]),
 'water': array([0.09389033, 0.08476859])}
Export data for scoring#
Now that you’ve verified a working Python model, you’ll also need a batch of data prepared for scoring. The starter project already includes this.
Return to your project in Dataiku.
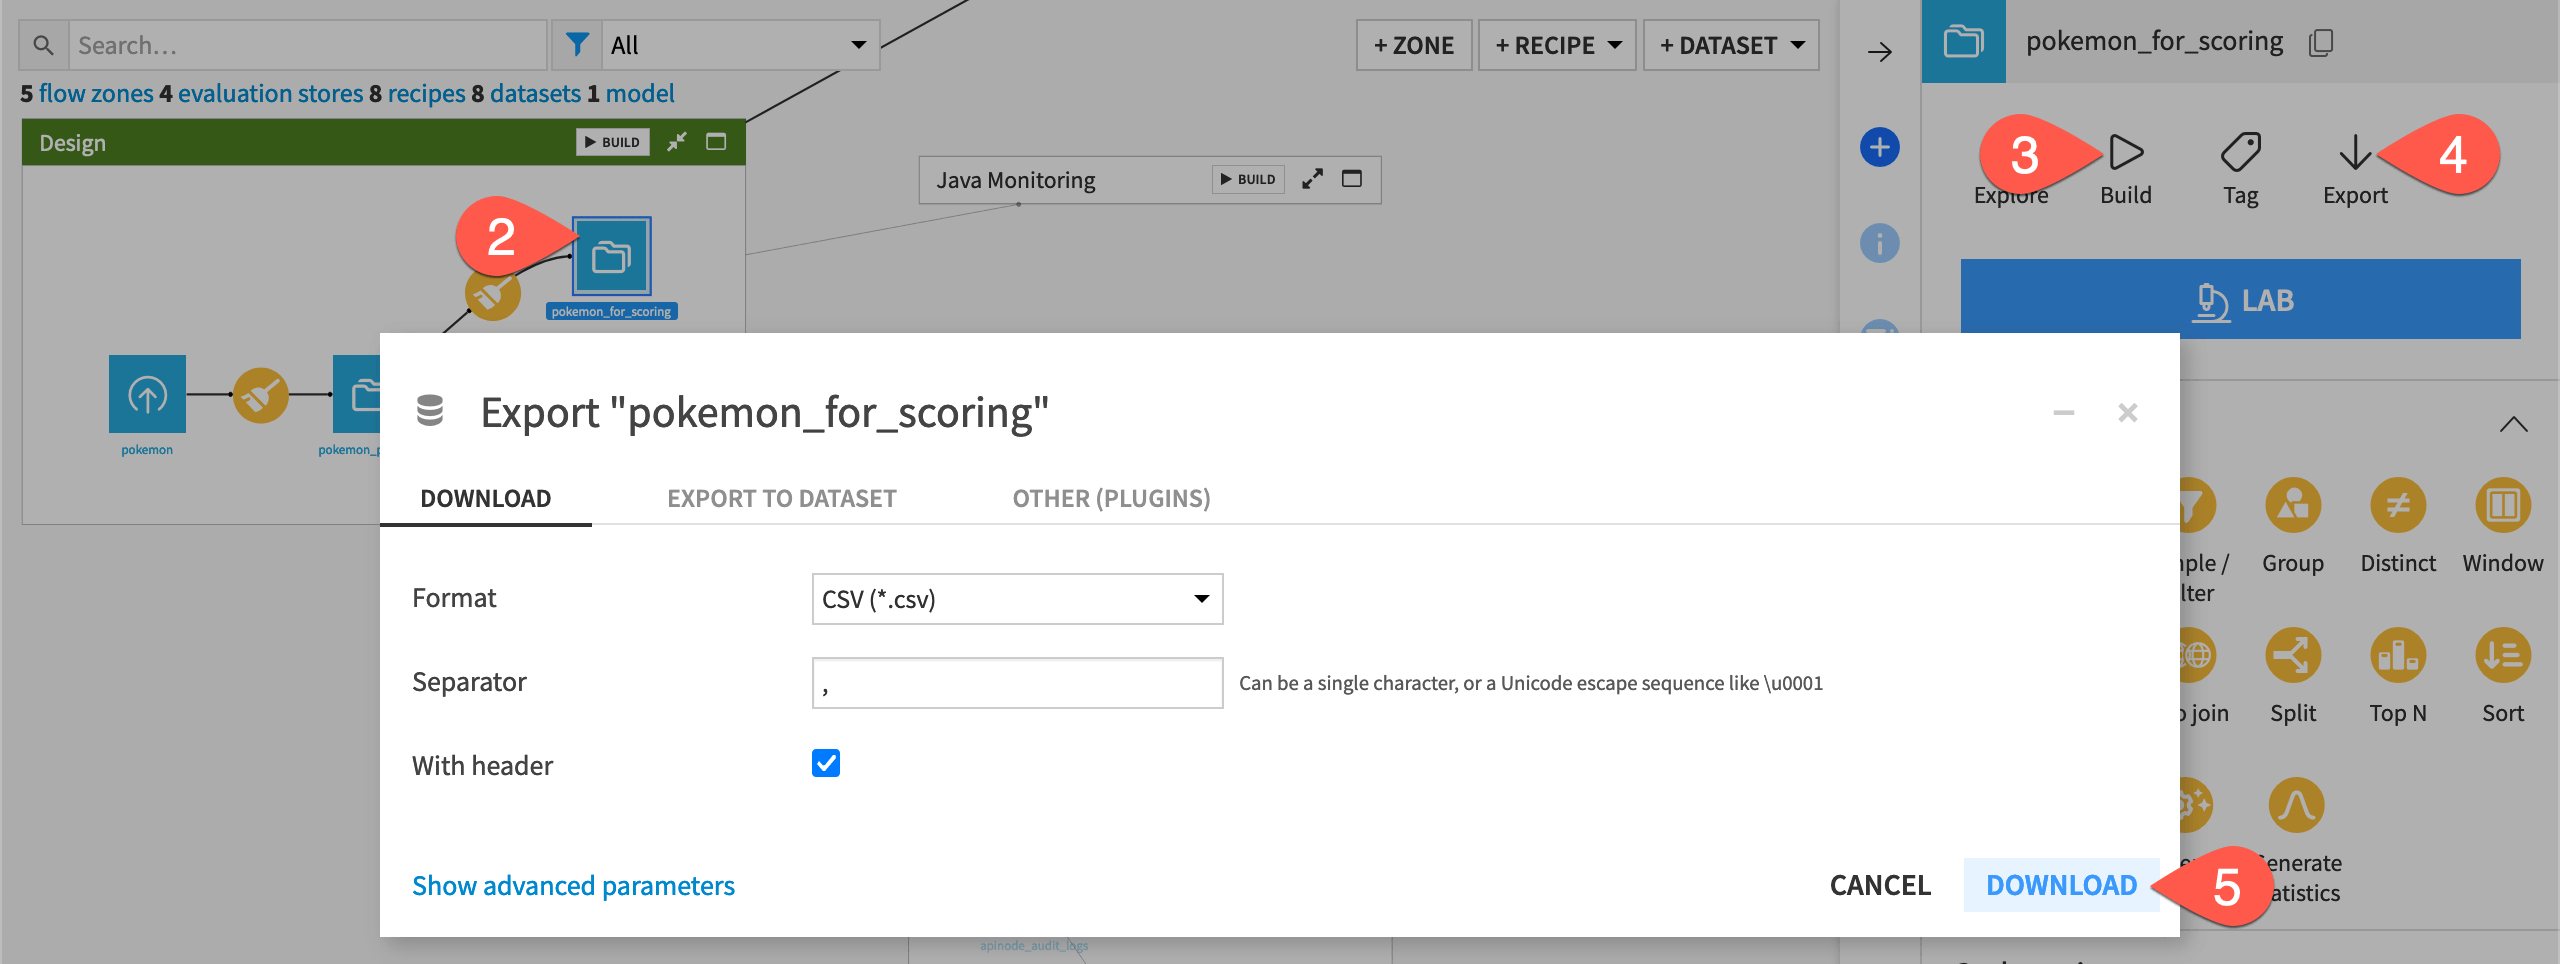
In the Design Flow zone, select the pokemon_for_scoring dataset.
If it’s empty, click Build > Build Dataset with the default Build Only This setting.
Otherwise, click Export in the Actions tab.
Click Download to import a local CSV file on your machine of data ready for scoring.
Move it to the directory containing
model.zip.
Score data with a Python script#
Now that you have a Python model and data for scoring, make a script to generate predictions for that data using the model.
Create a file called
scoring_dataiku.pywith the following code:from dataikuscoring import load_model import pandas as pd # Load the model from current export path model = load_model('model.zip') input_df = pd.read_csv('pokemon_for_scoring.csv') predict_result = model.predict(input_df) output_df = input_df output_df['prediction'] = predict_result print(" Output of model.predict(): {}".format(output_df)) output_df.to_csv('pokemon_scored_python.csv', index=False)
Move the
scoring_dataiku.pyfile to the directory containingmodel.zipandpokemon_for_scoring.csv.Generate predictions on the entire dataset by running:
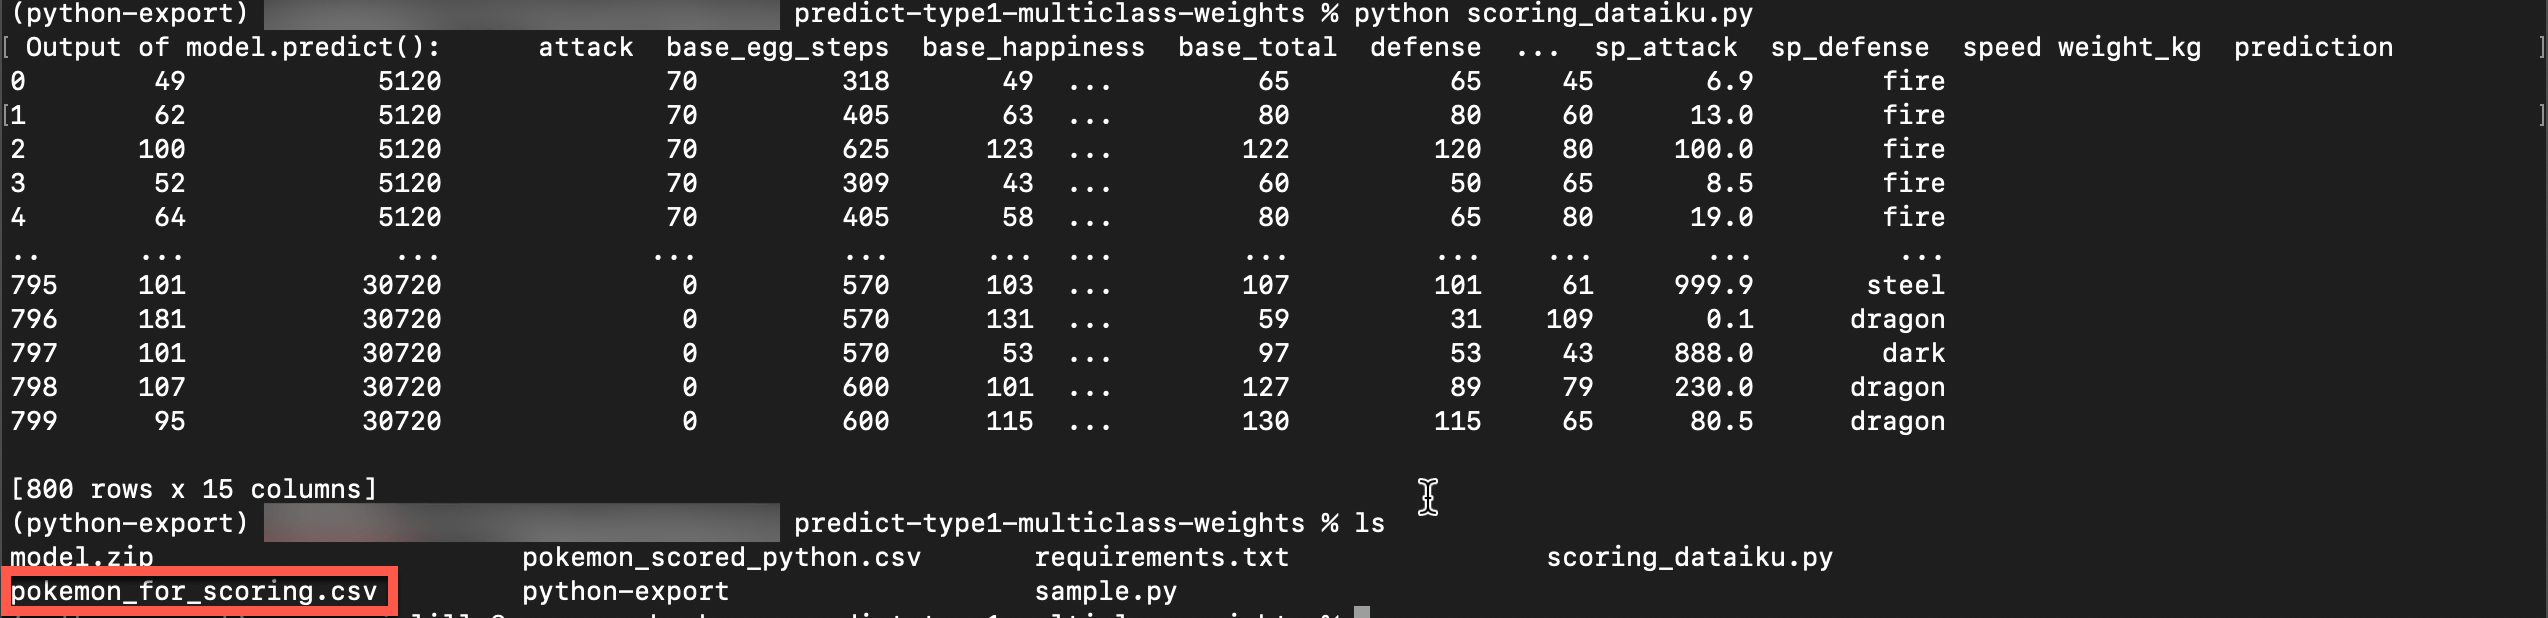
python scoring_dataiku.py
This action should create the following output and a CSV file called pokemon_scored_python.csv.
Import prediction logs for monitoring#
You now have used the model to make predictions and exported these predictions in a usable format. Next, you need to import the prediction data into Dataiku so that you can monitor it in the usual way.
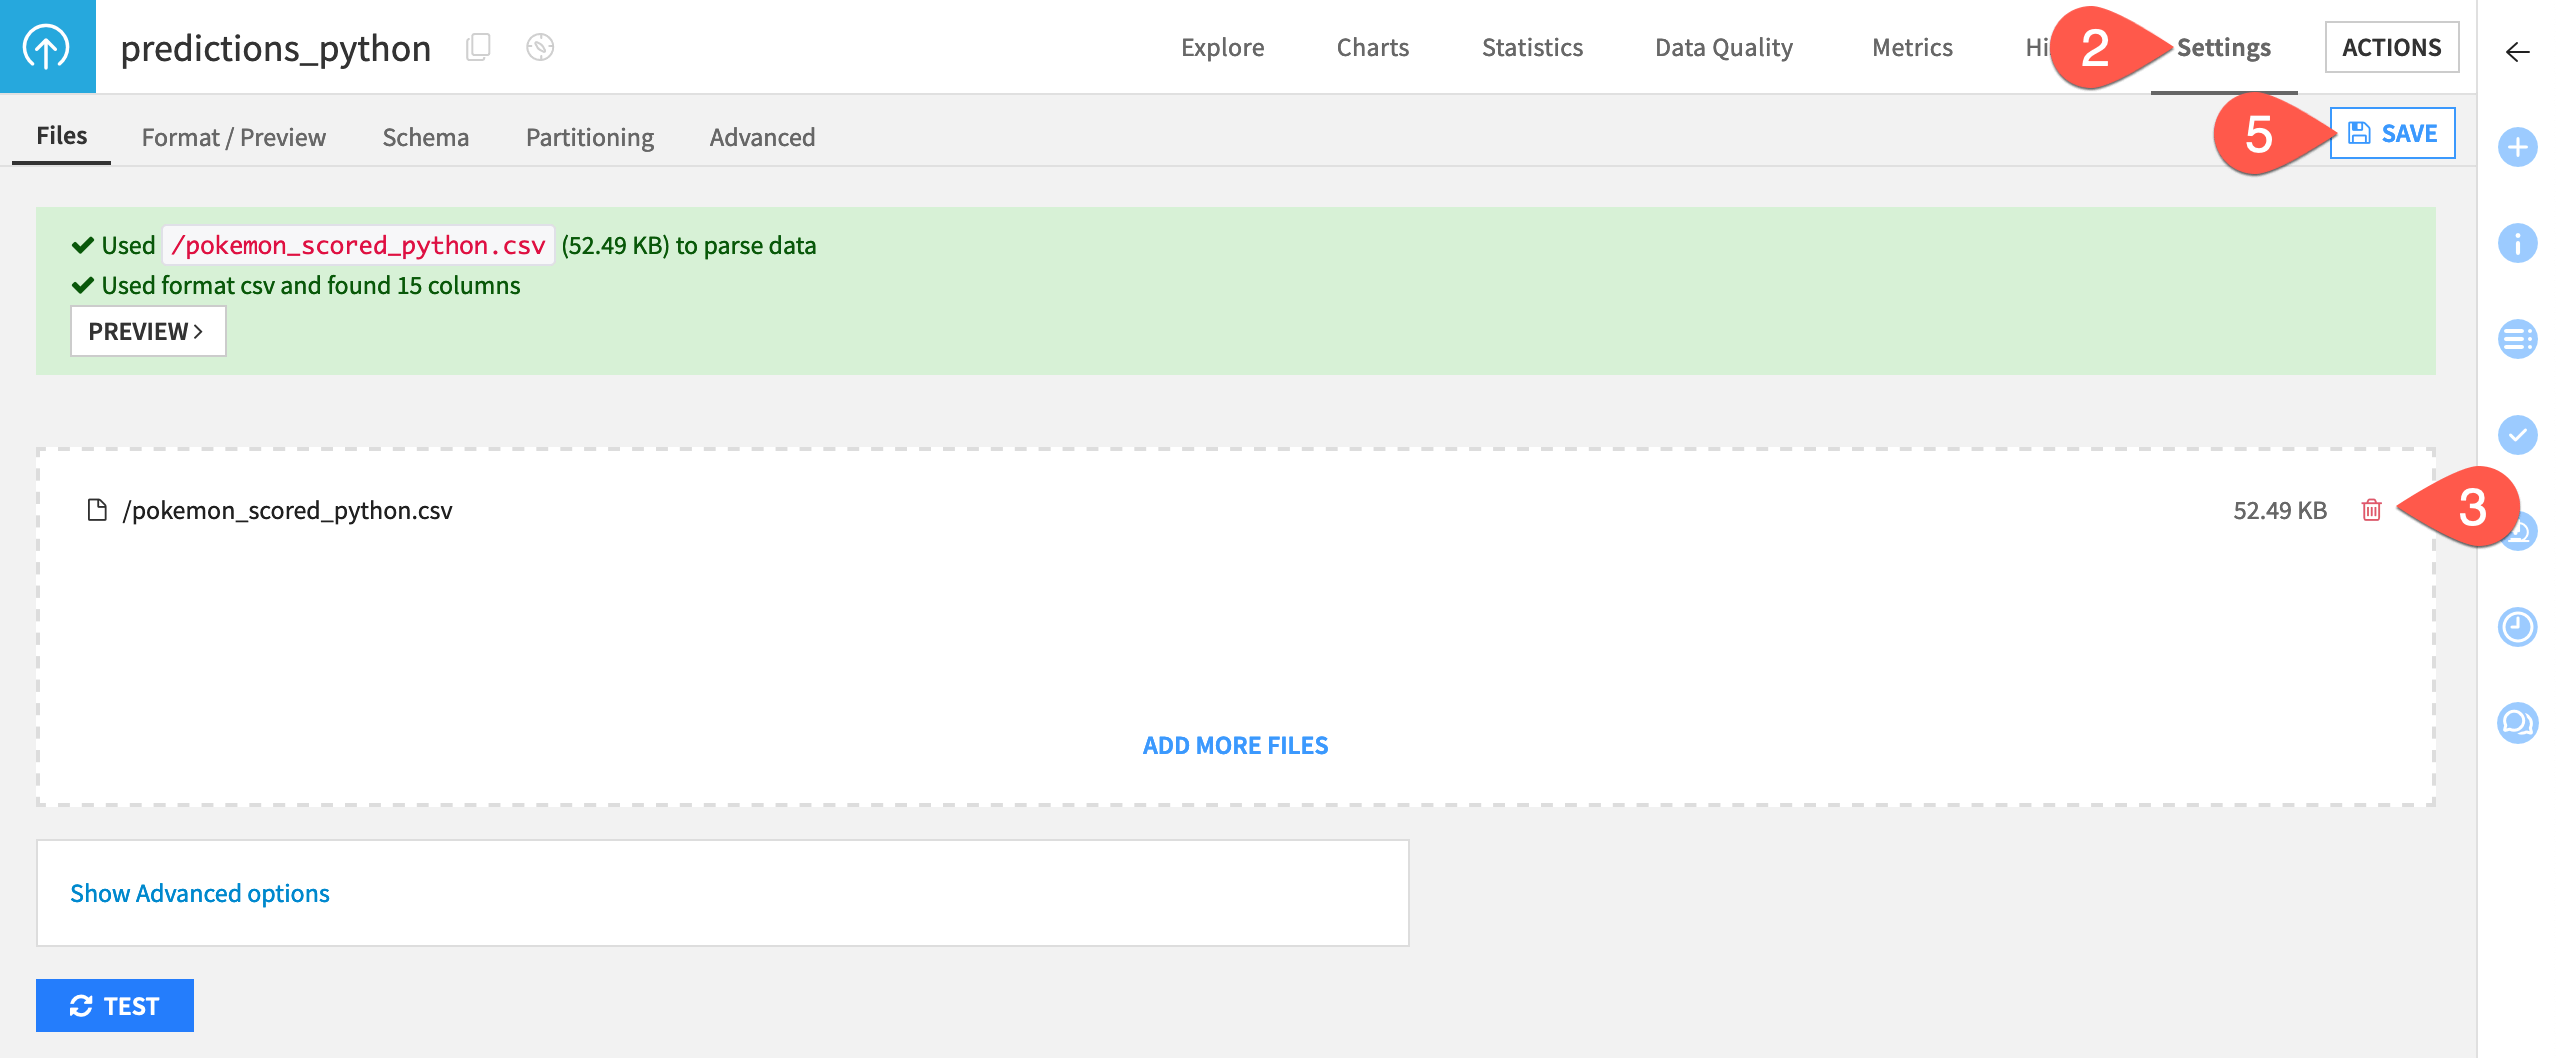
In the Python Monitoring Flow zone, open the predictions_python dataset.
Navigate to the Settings tab.
Delete the existing CSV file.
Click Select Files to replace it with the pokemon_scored_python.csv file that you just created.
Click Save to confirm.
Compute a model evaluation#
Like the other monitoring zones in this project, the Python Monitoring Flow zone includes:
An Evaluate recipe with two inputs: the saved model and a dataset of prediction logs (this time created externally with Python).
A model evaluation store as output computing standard drift metrics between the training dataset of the model and the actual predictions.
Build the model evaluation store to check the drift of the input data and predictions computed externally with Python.
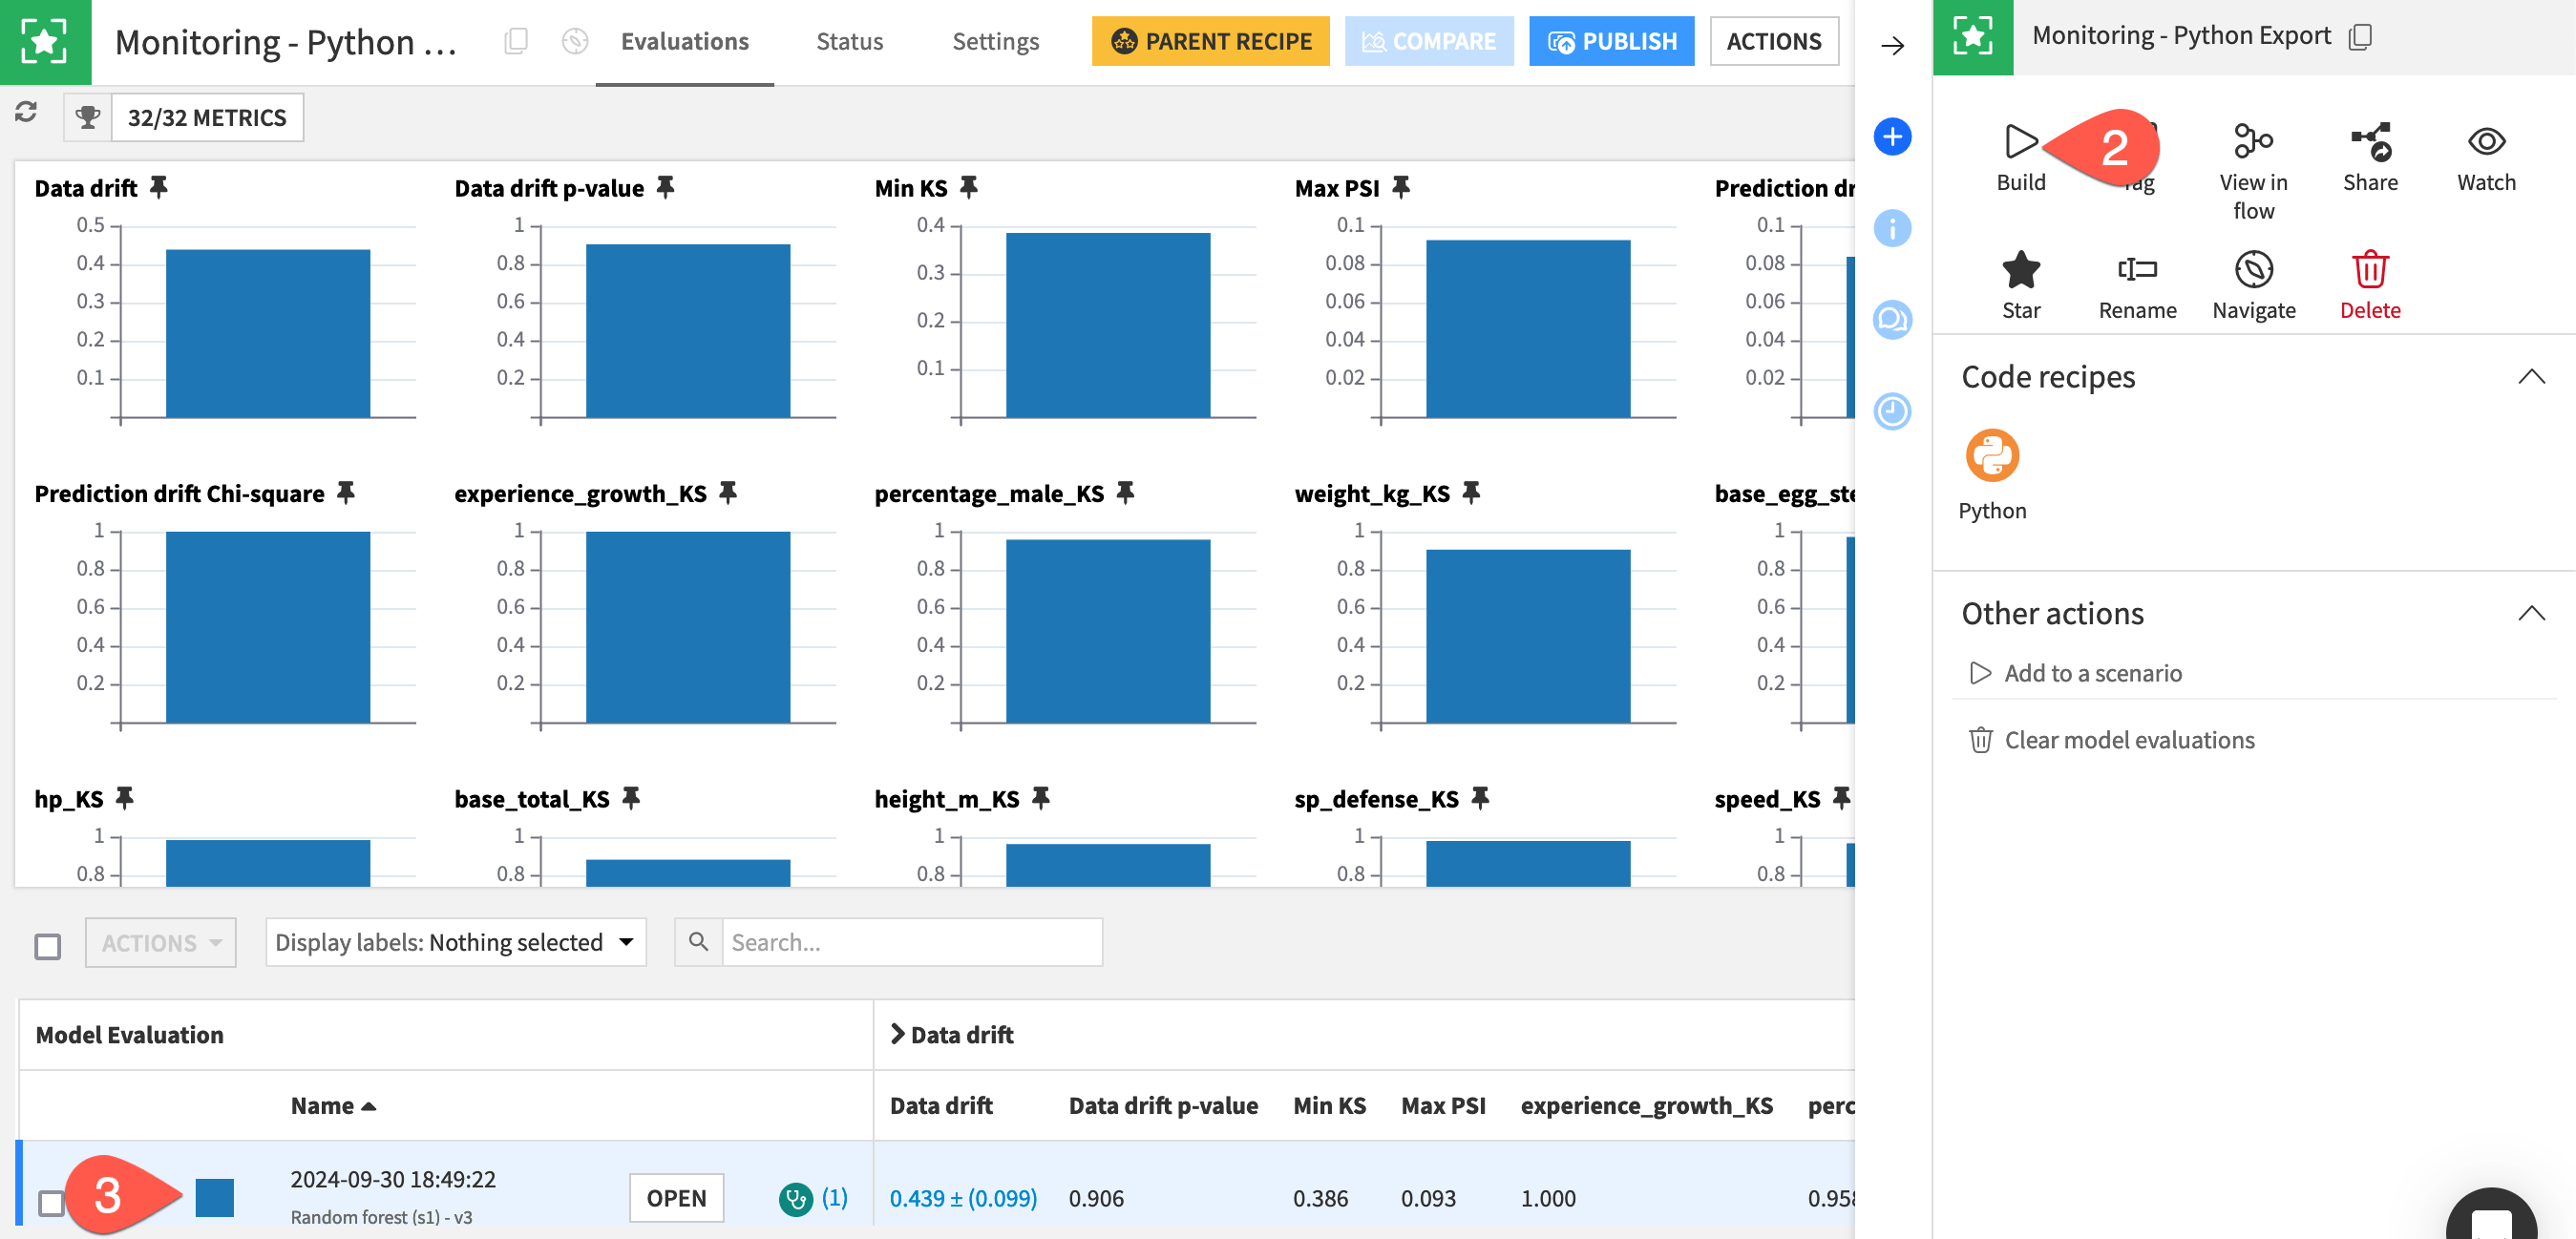
In the Python Monitoring Flow zone, open the empty Monitoring - Python Export model evaluation store.
In the Actions tab, click Build > Build Evaluation Store with the default Build Only This setting.
When finished building, refresh the page to find the same set of metrics you’d find if you built the MES in other Flow zones.
Automate model monitoring#
At this point, you have seen an example of how a model export can generate a log file usable to compute monitoring metrics.
In a real use case, the first point to solve is how to automatically move the prediction file from where it’s generated to a place accessible to Dataiku. Possible solutions include sending it via FTP or directly pushing it to cloud storage. Rather than an all-around solution, this problem should be analyzed on a case-by-case basis.
Once you have configured the retrieval of logs in an accessible place, you can create a simple scenario to run the Evaluate recipe and generate a model evaluation, which you can then enrich with checks to automate alerts as done in this project’s Monitor batch job scenario or explained in more detail in Tutorial | Model monitoring with a model evaluation store.
Automate model deployment (optional)#
It’s perfectly acceptable to keep the deployment of the model as a manual process, as deploying a new model version might not be a frequent operation. However, if you want to do so, you can build a full deployment pipeline by leveraging Dataiku APIs, typically by training a new model version and then downloading the jar file.
Note
See the Developer Guide for a more detailed example that you can adapt for your needs.
An exported Java model scored externally#
Depending on the deployment context, you may wish to export a model designed in Dataiku so that it can run on an external system. For example, a model may need to run on an edge device, such as a drone. However, even if model scoring occurs externally, model monitoring can still occur within Dataiku.
This section presents how to monitor a model within Dataiku in situations where the model is exported to Java and scored externally.
Additional prerequisites#
In addition to the shared prerequisites, you’ll also need:
Basic knowledge of Java.
A JDK installed on your machine.
A Dataiku instance with the Java model export feature.
This tutorial used the IntelliJ IDEA Community edition, but other IDEs are possible.
Export the model#
For scoring to occur outside of Dataiku, you’ll first need to export the model used in the starter project.
Double click to open the saved model deployed to the Flow.
Open the report for the Active version by clicking on the model name Random forest (s1) - v3 at the top left of the tile.
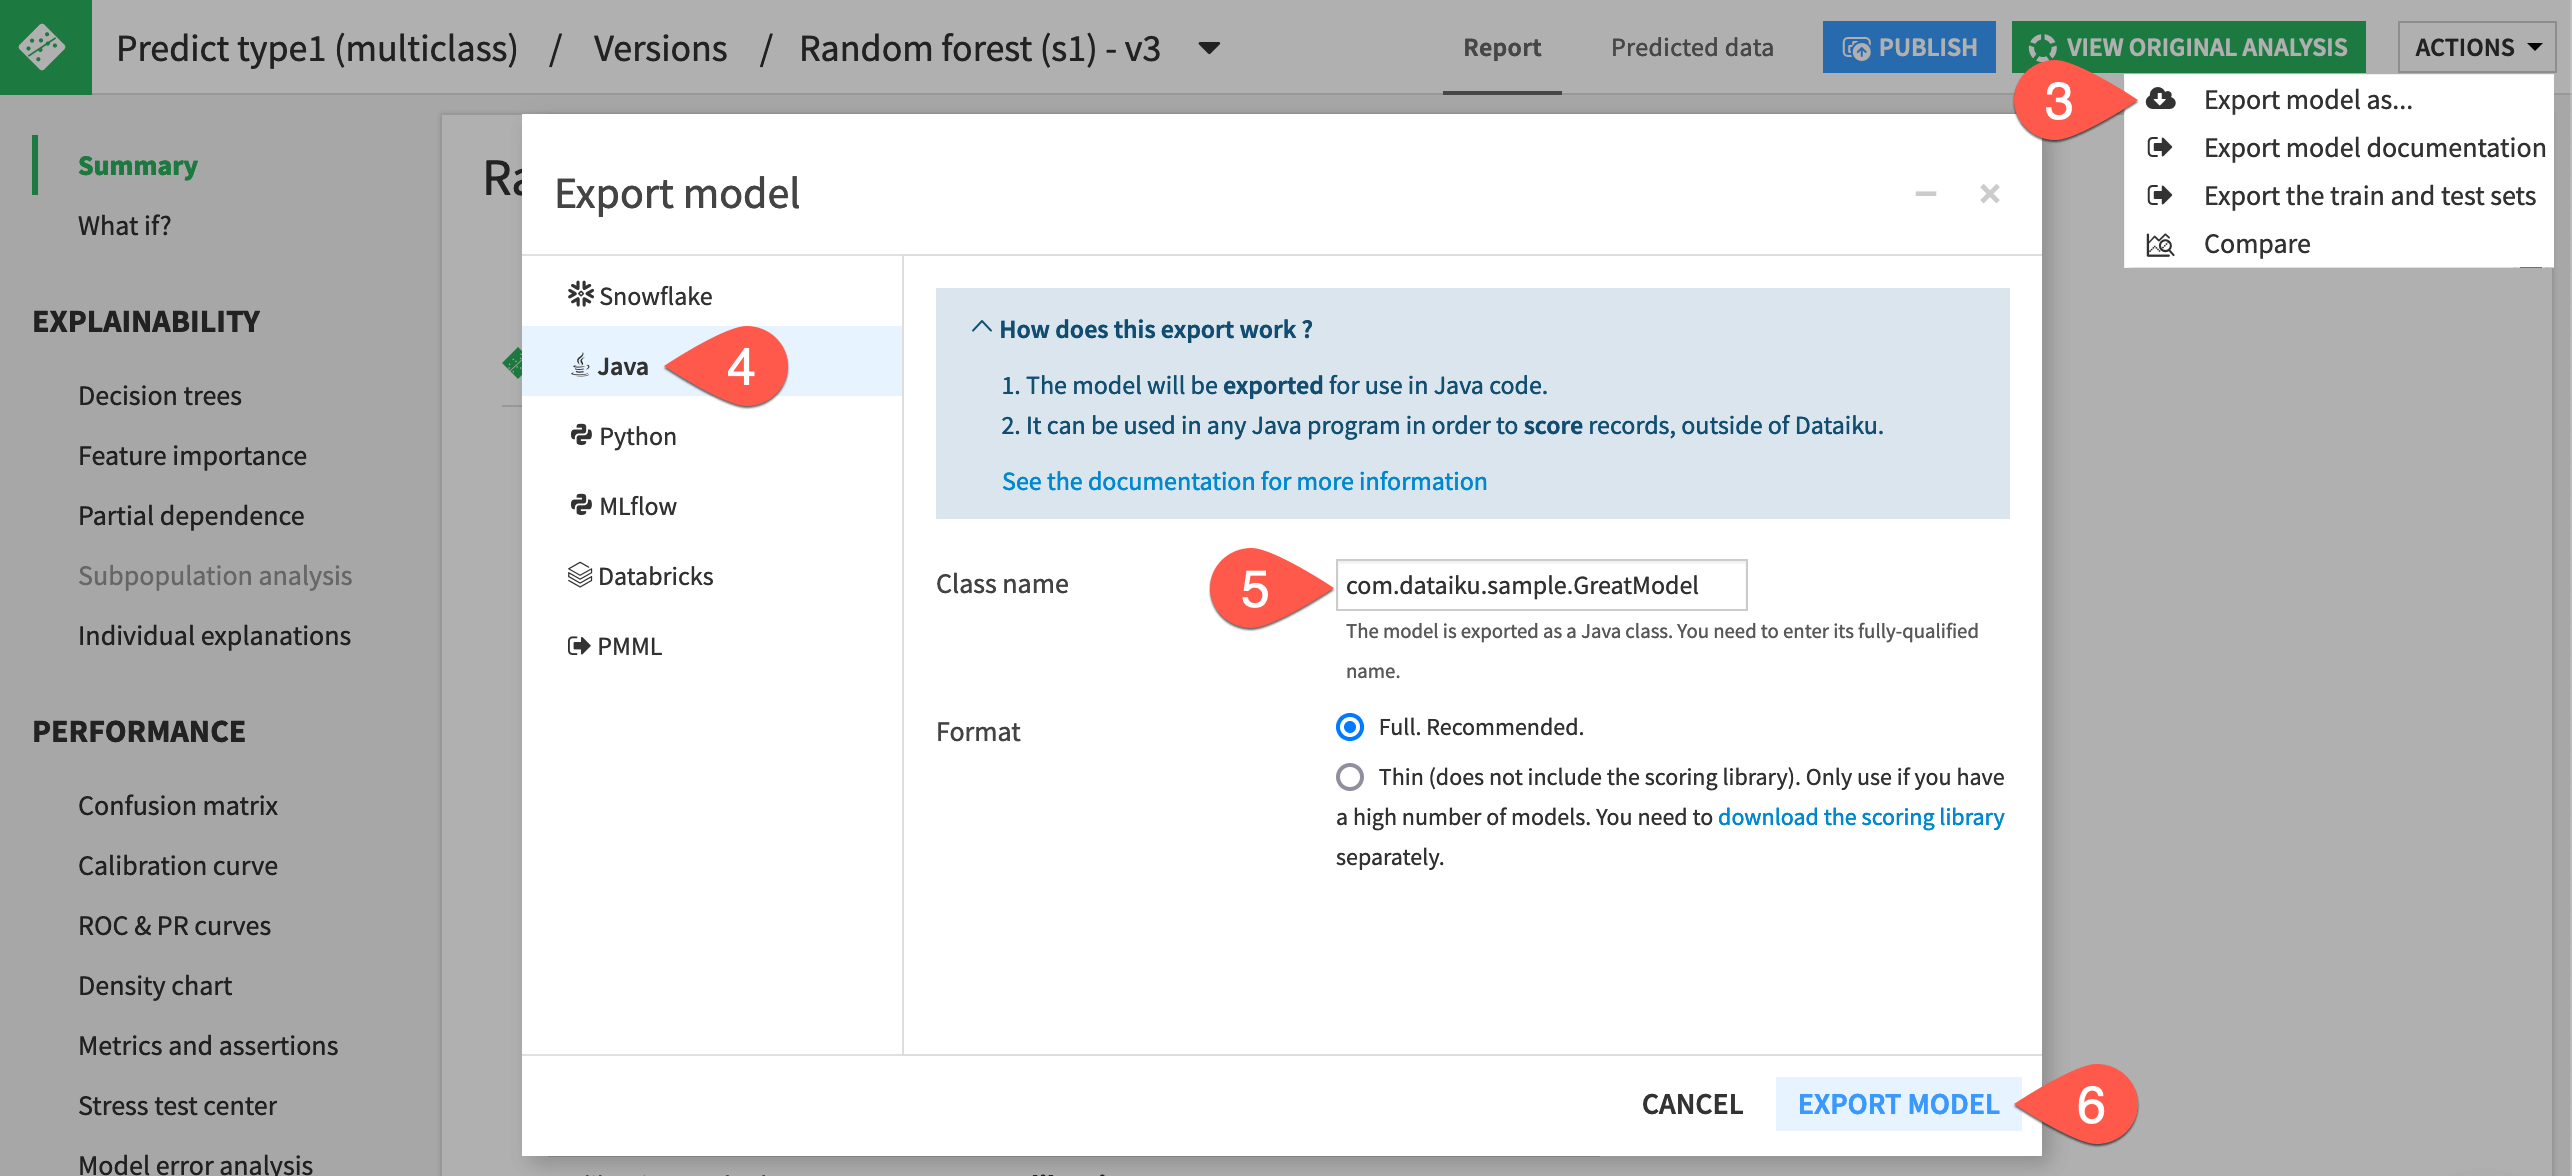
At the top right of the screen, click Actions > Export model as ….
Select the Java panel.
Enter the class name
com.dataiku.sample.GreatModel.With the default full format selected, click Export Model.
See also
See the reference documentation on Java model exports to understand the usage and limitations.
Run the model outside of Dataiku#
Now you have downloaded on your machine a .jar file containing the model and Dataiku Java scoring libraries. Running the model outside of Dataiku requires a Java program that loads the model, takes input data from a folder, scores it, and exports the result as a CSV file.
Import the project to an IDE#
The academy-samples Git repository includes a sample Java project in the monitoring-java folder that meets the above requirements.
Import this project into your favorite IDE. (This tutorial used IntelliJ IDEA Community edition for this test).
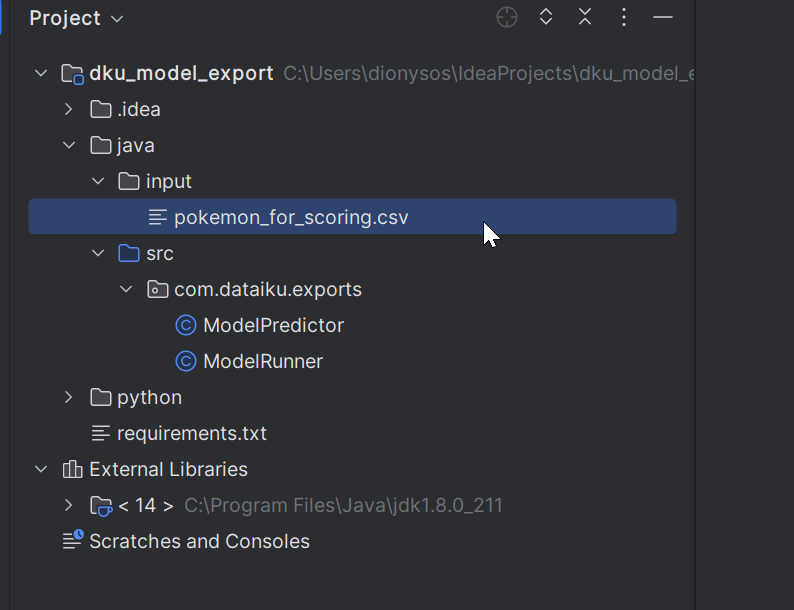
The program consists of two files:
java/src/com/dataiku/exports/ModelPredictor.javaloads the model and scores with it.java/src/com/dataiku/exports/ModelRunner.javaloads the input data, sends it for scoring, and saves the output as a CSV file.
The input data is expected within the project in the java/input folder. The starter project includes a sample file, but you could generate any file you want, provided you respect the schema.
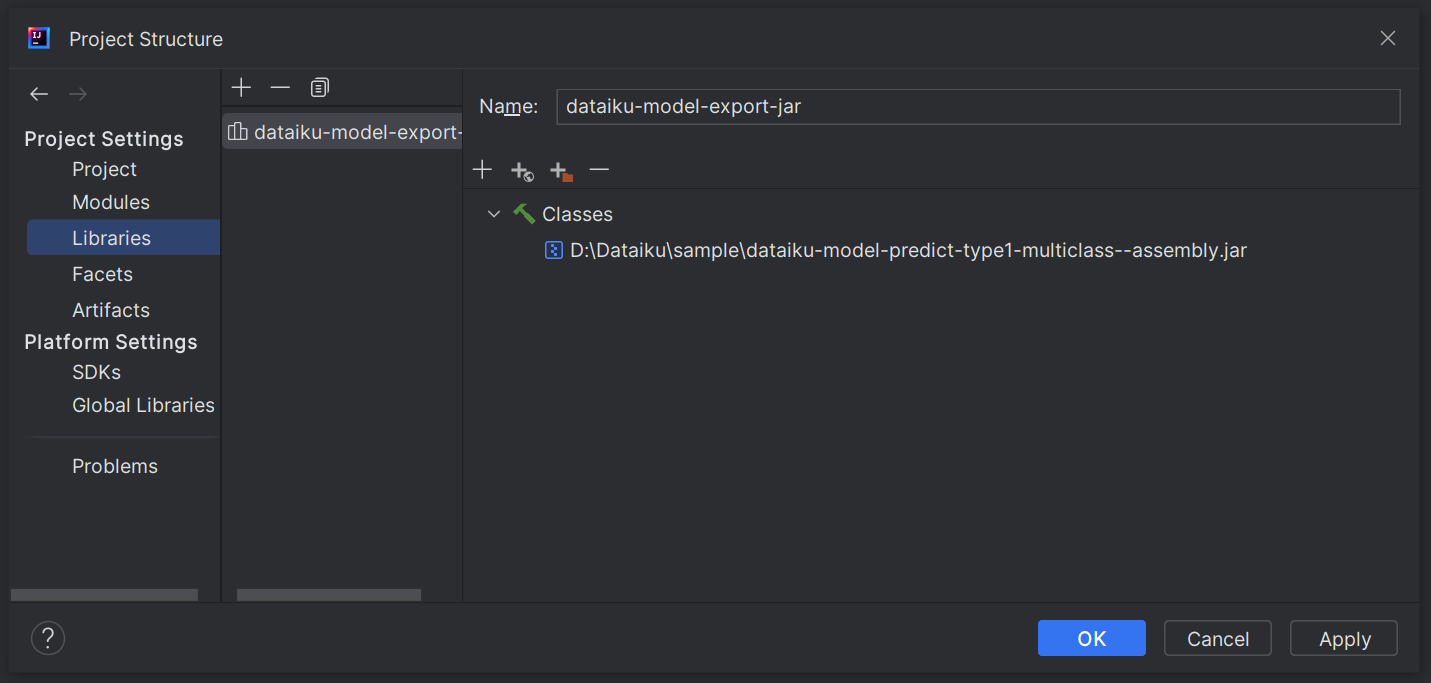
Add the exported JAR file as a library to the project#
If using IntelliJ IDEA, the only missing part is the model itself and the scoring library: in other words, the .jar file previously exported from Dataiku.
Add the
.jarfile as a library in the project.
Run the program#
Now, you need to run the program to generate the prediction log.
In IntelliJ, right-click on ModelRunner.
Select Run ‘ModelRunner.main()’.
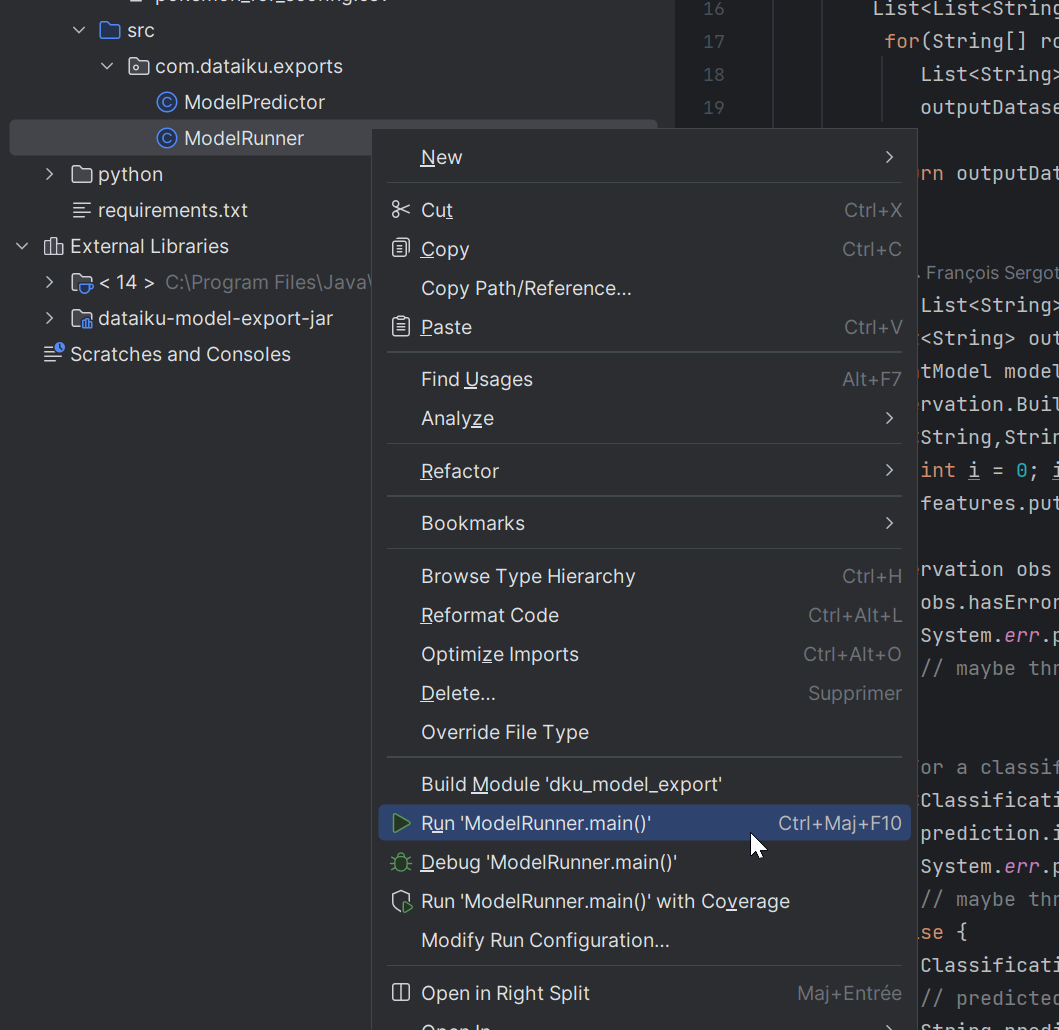
This action should create a CSV file of scored data called pokemon_scored_java.csv. The full path will be java/output/java/pokemon_scored_java.csv. This file is the only thing needed to compute drift monitoring in Dataiku.
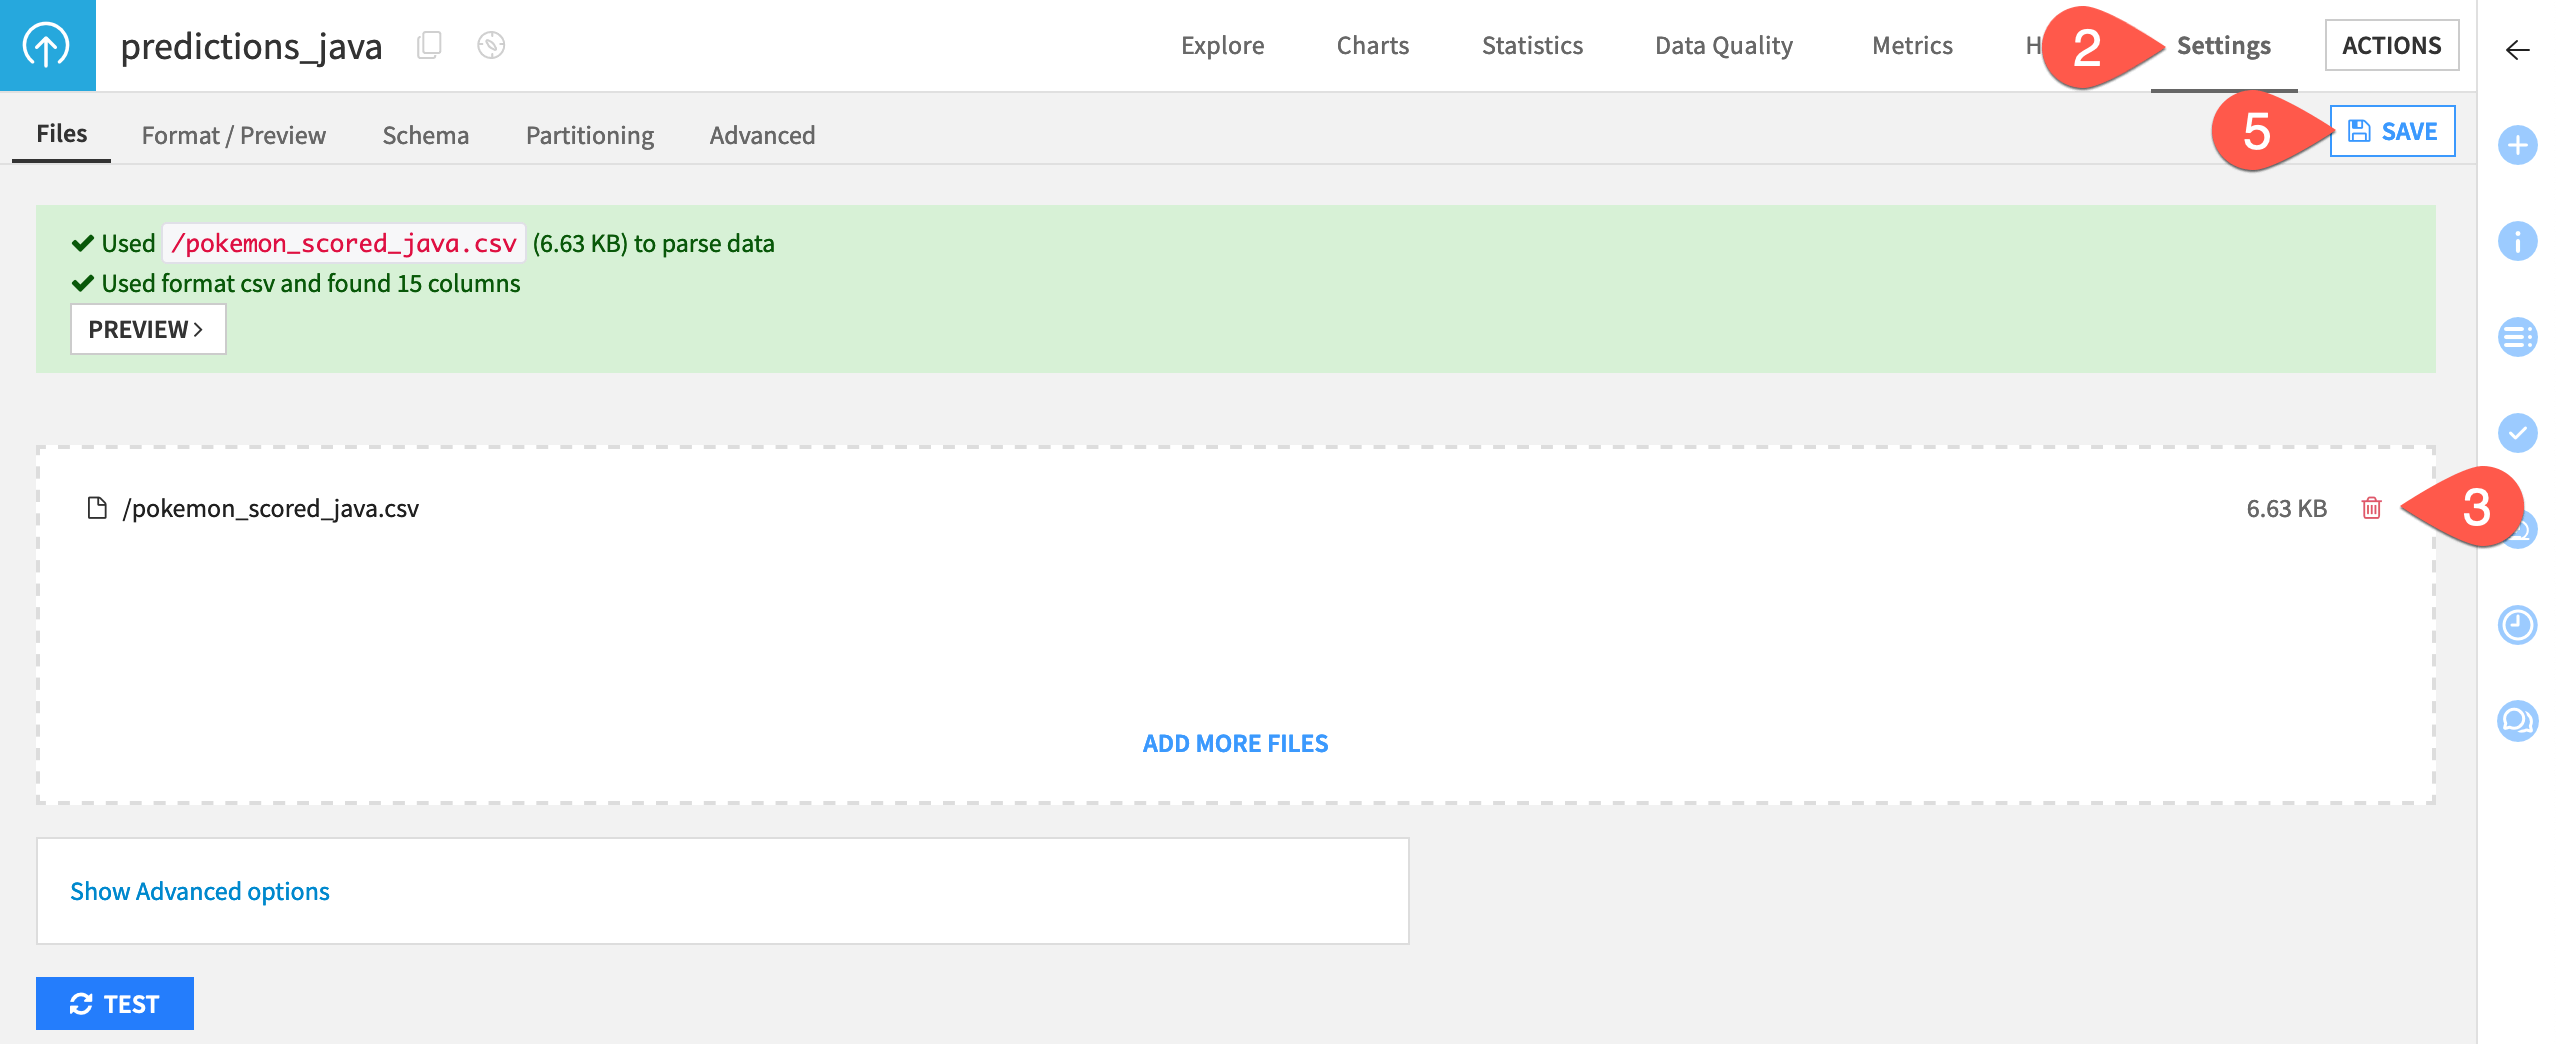
Import prediction logs for monitoring#
You now have used the model to make predictions and exported these predictions in a usable format. Next, you need to import the prediction data into Dataiku so that you can monitor it in the usual way.
In the Python Monitoring Flow zone, open the predictions_python dataset.
Navigate to the Settings tab.
Delete the existing CSV file.
Click Select Files to replace it with the pokemon_scored_java.csv file that you just created.
Click Save to confirm.
Compute a model evaluation#
Like the other monitoring zones in this project, the Java Monitoring Flow zone includes:
An Evaluate recipe with two inputs: the saved model and a dataset of prediction logs (this time created externally with Java).
A model evaluation store as output computing standard drift metrics between the training dataset of the model and the actual predictions (this time done externally with Java).
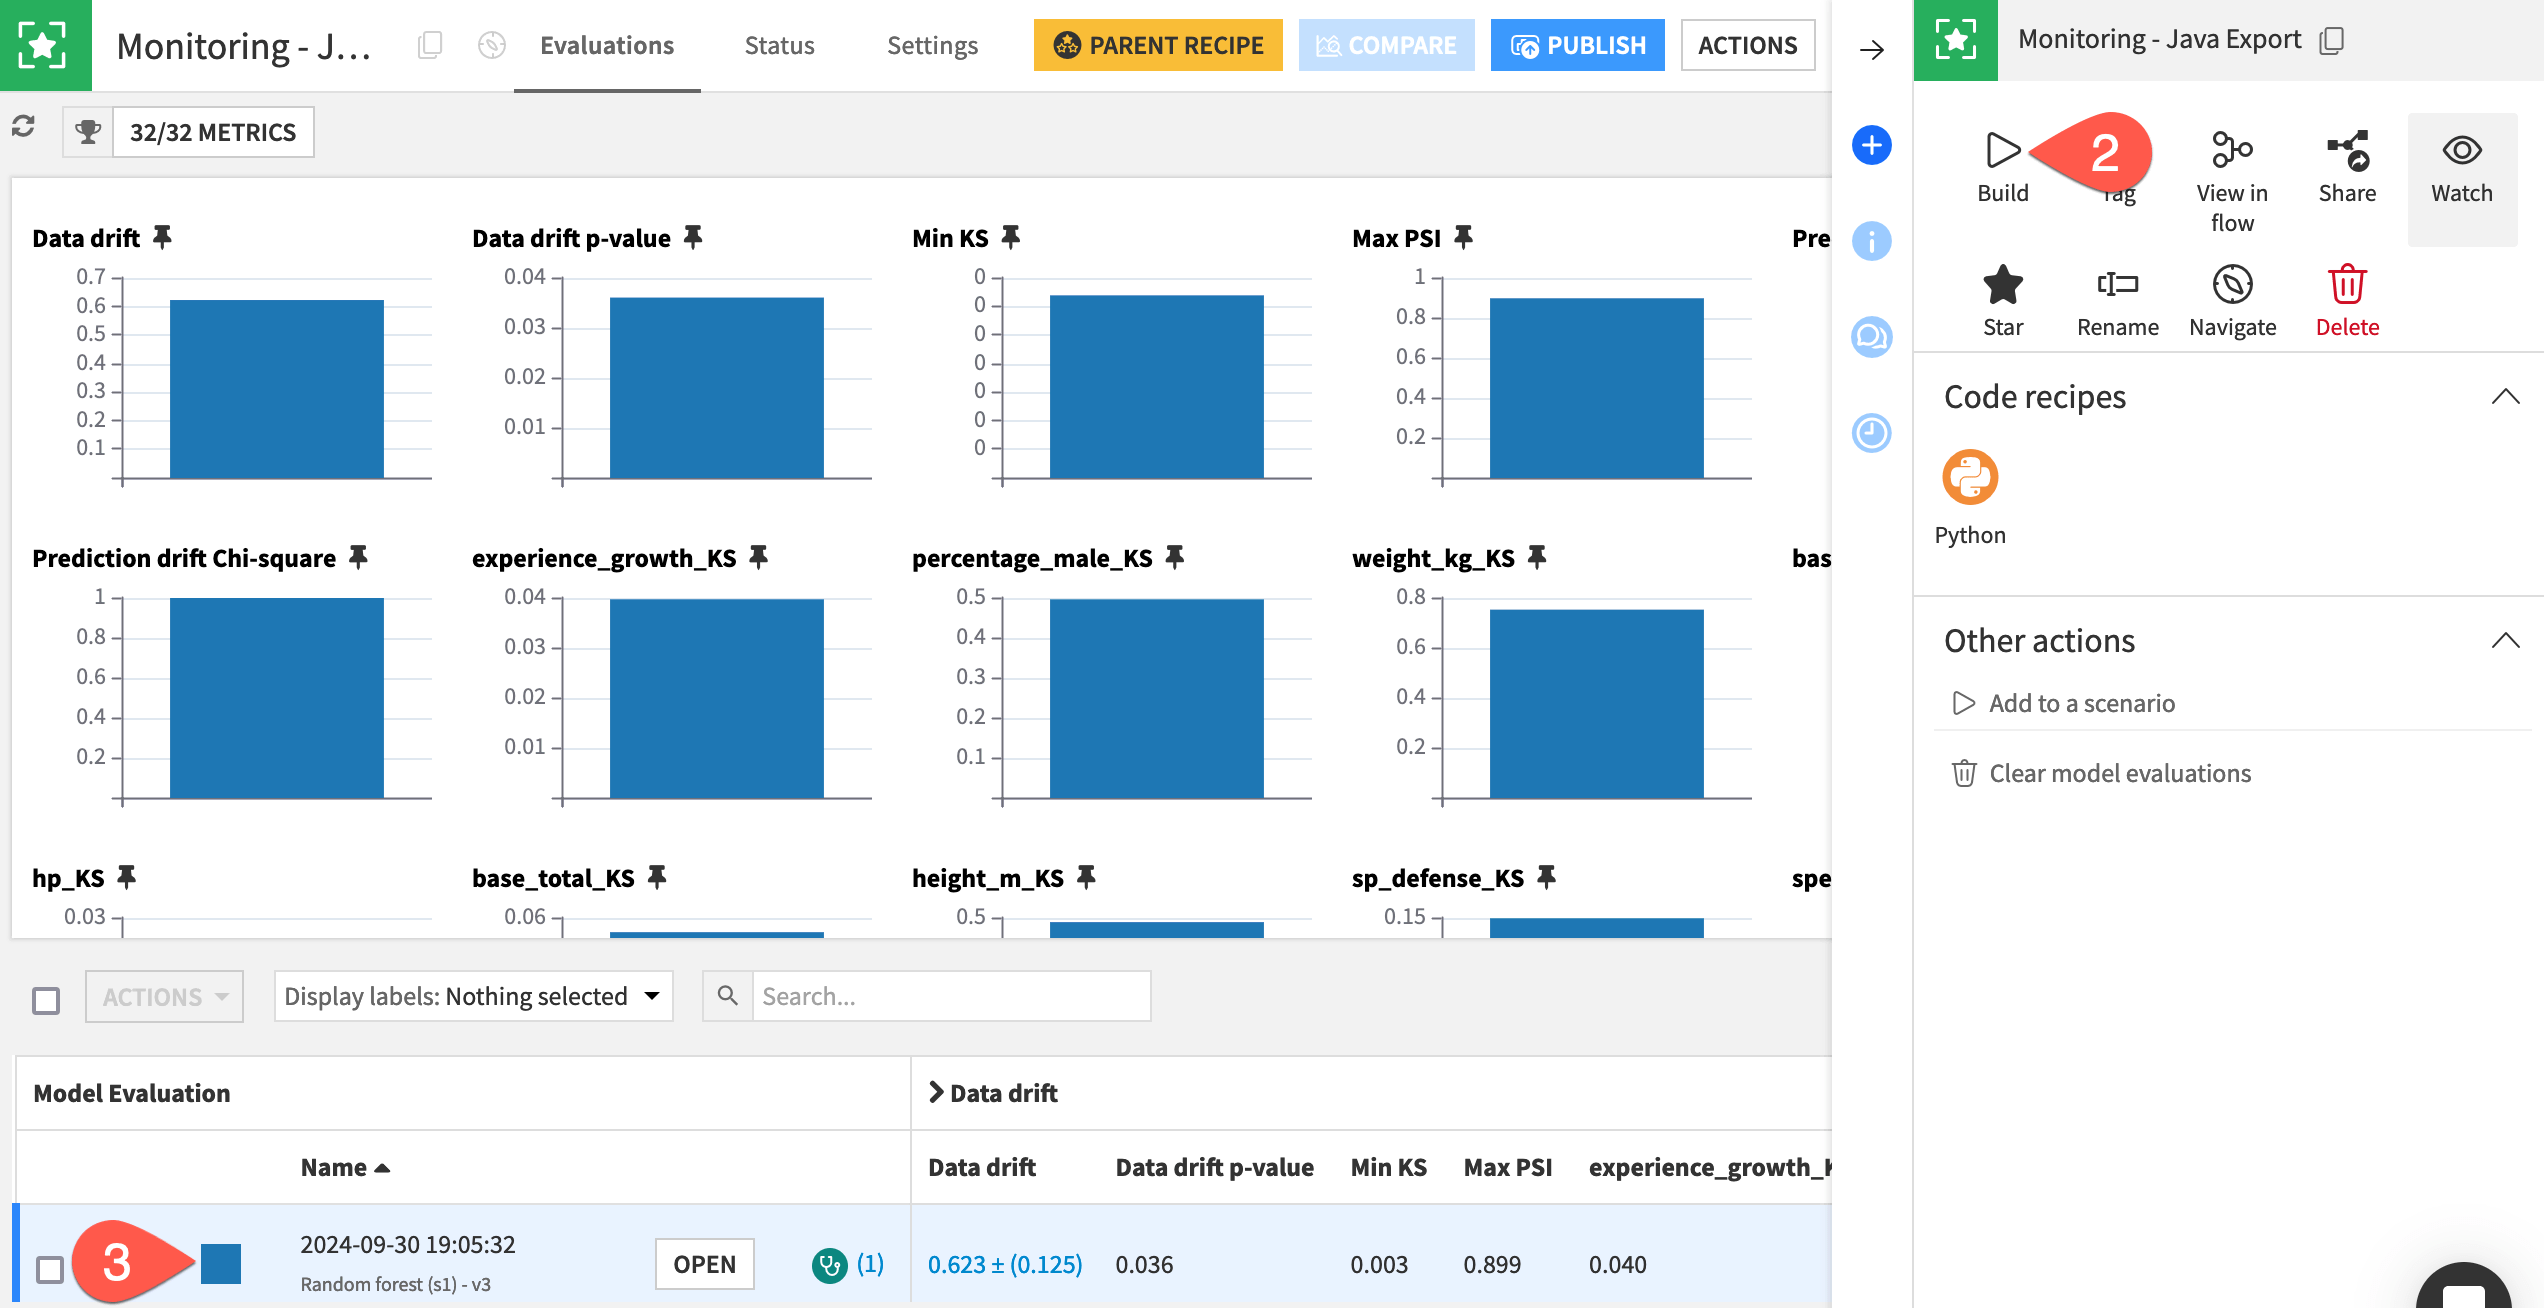
Finally, let’s build the model evaluation store to check the drift of the input data and predictions computed externally with Java.
In the Java Monitoring Flow zone, open the empty Monitoring - Java Export model evaluation store.
In the Actions tab, click Build > Build Evaluation Store with the default Build Only This setting.
When finished building, refresh the page to find the same set of metrics you’d find if you built the MES in other Flow zones.
Automate model monitoring#
At this point, you have seen an example of how a model export can generate a log file usable to compute monitoring metrics.
In a real use case, the first point to solve is how to automatically move the prediction file from where it’s generated to a place accessible to Dataiku. Possible solutions include sending it via FTP or directly pushing it to cloud storage. Rather than an all-around solution, this problem should be analyzed on a case-by-case basis.
Once you have configured the retrieval of logs in an accessible place, you can create a simple scenario to run the Evaluate recipe and generate a model evaluation, which you can then enrich with checks to automate alerts as done in this project’s Monitor batch job scenario or explained in more detail in Tutorial | Model monitoring with a model evaluation store.
Automate model deployment (optional)#
It’s perfectly acceptable to keep the deployment of the model as a manual process, as deploying a new model version might not be a frequent operation. However, if you want to do so, you can build a full deployment pipeline by leveraging Dataiku APIs, typically by training a new model version and then downloading the jar file.
Note
See the Developer Guide for a more detailed example that you can adapt for your needs.
Next steps#
This series of articles has presented the basic setup to monitor a model in heterogeneous ML landscapes.
Dataiku fully supports batch and real-time API workloads within its ecosystem. At the same time, it also accommodates more diverse ML pipelines where scoring may occur externally using Python or Java, for example.
Tip
If you do have a heterogeneous ML landscape, try Tutorial | Surface external models within Dataiku.
See also
See the reference documentation on MLOps to learn more.