Tutorial | Model monitoring with a model evaluation store#
Get started#
Tutorial | Deploy an API service to a production environment demonstrated how to deploy an API service into production. If you plan to use a model in production, you need to consider how to monitor it. As you get further in time from the training data, how do you ensure a model stays relevant? Let’s tackle those questions now.
Objectives#
In this tutorial, you will:
Use the Evaluate recipe and a model evaluation store (MES) to monitor model metrics in situations where you do and don’t have access to ground truth data.
Conduct drift analysis to interpret how well the model is performing compared to its initial training.
Create a scenario to retrain the model based on a metric collected in the MES.
Create a model monitoring dashboard.
Prerequisites#
To reproduce the steps in this tutorial, you’ll need:
Dataiku 12.0 or later.
A Full Designer user profile on the Dataiku for AI/ML or Enterprise AI packages.
The Reverse Geocoding plugin (version 2.1 or above) installed on your Dataiku instance. (This plugin is installed by default on Dataiku Cloud).
Broad knowledge of Dataiku (ML Practitioner + Advanced Designer level or equivalent).
Create the project#
From the Dataiku Design homepage, click + New Project.
Select Learning projects.
Search for and select Model Monitoring Basics.
If needed, change the folder into which the project will be installed, and click Create.
From the project homepage, click Go to Flow (or type
g+f).
Note
You can also download the starter project from this website and import it as a ZIP file.
Use case summary#
You’ll work with a simple credit card fraud use case. Using data about transactions, merchants, and cardholders, the Flow includes a model that predicts which transactions to authorize and which are potentially fraudulent.
A score of 1 for the target variable, authorized_flag, represents an authorized transaction.
A score of 0, on the other hand, is a transaction that failed authorization.
Putting this model into production can enable two different styles of use cases commonly found in machine learning workflows:
Scoring framework |
Example use case |
Production environment |
|---|---|---|
Batch |
A bank employee creates a monthly fraud report. |
Automation node |
Real-time |
A bank’s internal systems authorize each transaction as it happens. |
API node |
Tip
This use case is just an example to practice deploying and monitoring MLOps projects in production. Rather than thinking about the data here, consider how you’d apply the same techniques and Dataiku features to solve problems that matter to you!
Review the Score recipe#
Before using the Evaluate recipe for model monitoring, let’s review the purpose of the Score recipe.
Tip
If the Score recipe is unfamiliar to you, see the Scoring Basics Academy course in the ML Practitioner learning path.
The project creators trained the classification model in the Flow on three months of transaction data between January and March 2017. The new_transactions dataset currently holds the next month of transactions (April 2017).
In the Model Scoring Flow zone, verify the contents of the new_transactions dataset by navigating to its Settings tab.
Click List Files to find /transactions-prepared-2017-04.csv as the only included file.
Note
The new_transaction_data folder feeding the new_transactions dataset holds nine CSV files: one for each month following the model’s training data. This monthly data has already been prepared using the same transformations as the model’s training data, and so it’s ready for scoring or evaluation.
It also is already labeled. In other words, it has known values for the target authorized_flag column. However, you can ignore these known values, for example, when it comes to scoring or input drift monitoring.
For this quick review, assume the new_transactions dataset has empty values for authorized_flag. If this were the case, the next step would be to input these new unknown records and the model to the Score recipe. The Score recipe would then output a prediction of how likely each record is to be fraudulent.
In the Model Scoring Flow zone, select the test_scored dataset.
In the Actions (
) tab of the right panel, select Build.
Click Build Dataset with the Build Only This setting.
When finished, compare the schema of new_transactions and test_scored. The Score recipe adds three new columns (proba_0, proba_1, and prediction) to the test_scored dataset.
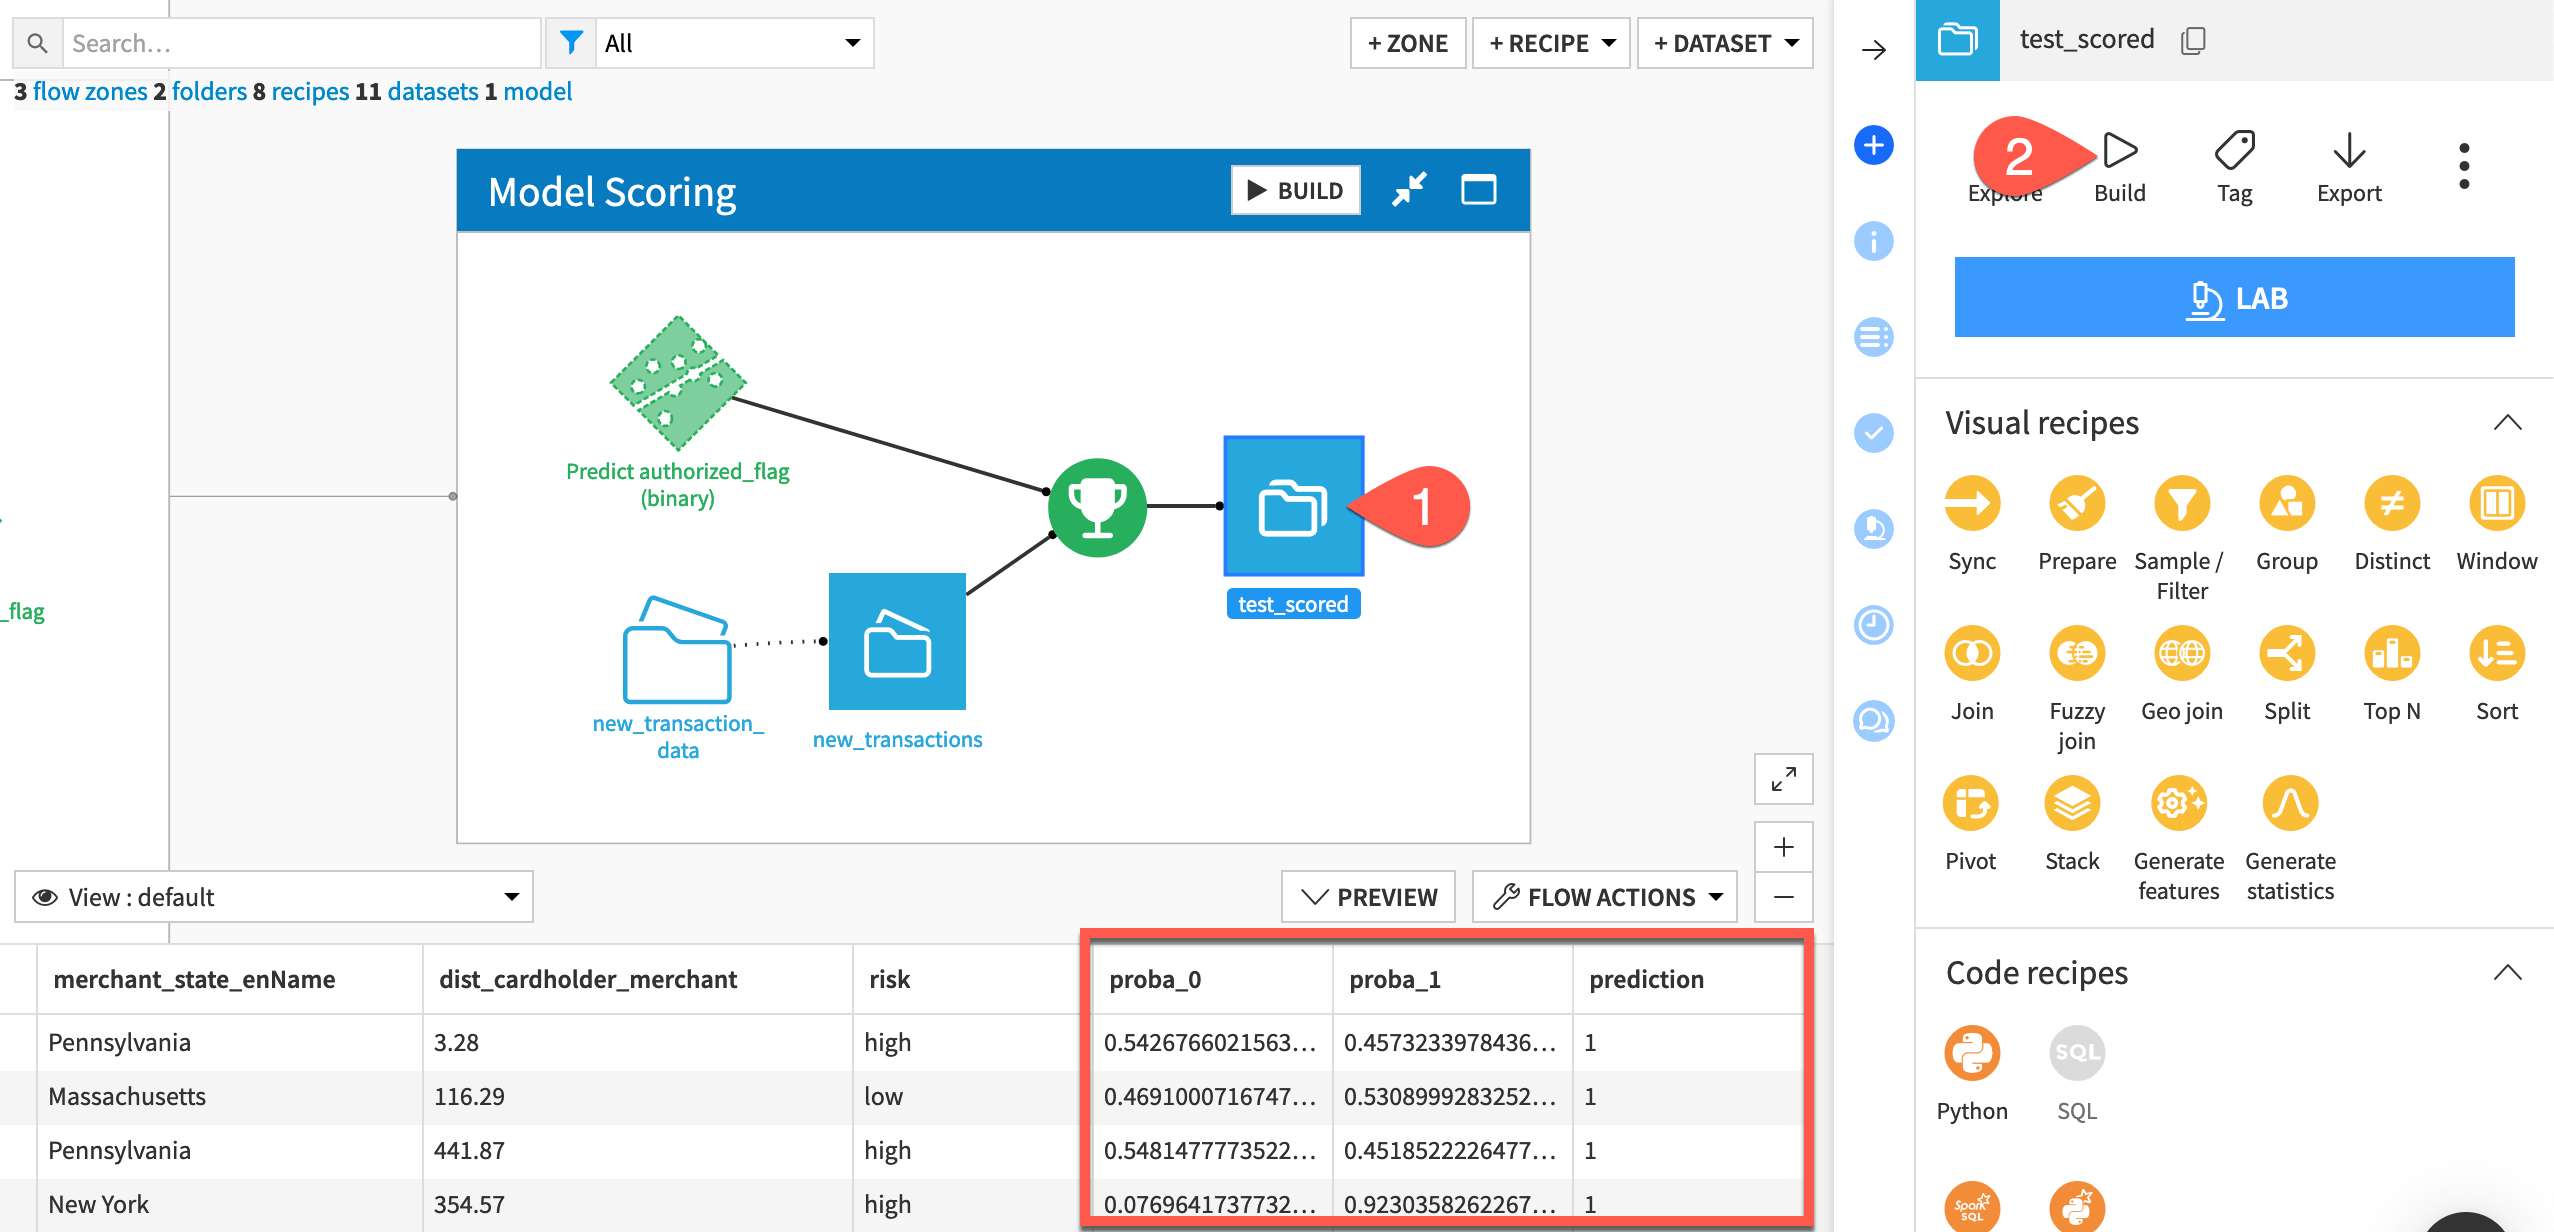
The Score recipe outputs predictions for new records, but how do you know if these predictions are similar to those produced during model training? That’s the key question your monitoring setup will try to address.
Create two model monitoring pipelines#
There are two basics approaches to model monitoring, and you’ll need a separate pipeline for each one.
Ground truth vs. input drift monitoring#
Over time, a model’s input data may trend differently from its training data. Therefore, a key question for MLOps practitioners is whether a model is still performing well or if it has degraded after deployment. In other words, is there model drift?
Definitively answering this question requires the ground truth, or the correct model output. However, obtaining the ground truth can often be slow, costly, or incomplete.
In such cases, you must instead rely on input drift evaluation. This approach compares the model’s training data to the new production data to see if there are significant differences.
See also
See Concept | Monitoring model performance and drift in production to learn more about ground truth vs. input drift monitoring.
For many real life use cases, these two approaches aren’t mutually exclusive:
Input drift and prediction drift (defined below) are computable as soon as one has enough data to compare. Depending on the use case, you might calculate it daily or weekly.
Ground truth data, on the other hand, typically comes with a delay and may often be incomplete or require extra data preparation. Therefore, true performance drift monitoring is less frequent. You might only be able to calculate it monthly or quarterly.
Keeping this reality in mind, set up two separate model monitoring pipelines that can run independently of each other.
A model evaluation store for ground truth monitoring#
Start by creating the model monitoring pipeline for cases where the ground truth is available. For this, you’ll need the scored dataset.
From the Model Scoring Flow zone, select both the saved model and the test_scored dataset.
In the Actions (
) tab of the right panel, select the Evaluate recipe.
For Outputs, Set an evaluation store named
mes_for_ground_truth.Click Create Evaluation Store, and then Create Recipe.
For the settings of the Evaluate recipe, adjust the sampling method to Random (approx. nb. records), and keep the default of 10,000.
Instead of running the recipe, click Save.
Take a moment to organize the Flow.
From the Flow, select the mes_for_ground_truth
In the Actions (
) tab, select Move.
Select New Zone.
Name the new zone
Ground Truth Monitoring.Click Confirm.
Tip
See the following image below to check your work once you have both pipelines in place.
A model evaluation store for input drift monitoring#
Now create a second model evaluation store for cases where the ground truth isn’t present following the same process. This time though, you’ll need the “new” transactions, which you can assume have an unknown target variable.
From the Model Scoring Flow zone, select both the saved model and the new_transactions dataset.
In the Actions (
) tab of the right panel, select the Evaluate recipe.
For Outputs, Set an evaluation store named
mes_for_input_drift.Click Create Evaluation Store, and then Create Recipe.
As before, adjust the sampling method to Random (approx. nb. records), and keep the default of 10,000.
Because this tutorial makes the assumption that the input data is unlabeled, there is one important difference in the configuration of the Evaluate recipe for input drift monitoring.
In the Output tile of the Evaluate recipe’s Settings tab, check the box Skip performance metrics computation.
Caution
If you don’t have the ground truth, you won’t be able to compute performance metrics. The recipe would return an error without changing this setting.
Click Save, and then return to the Flow.
Following the steps above, move the mes_for_input_drift into a new Flow zone called
Input Drift Monitoring.
Review the two monitoring zones#
You now have one Flow zone dedicated to model monitoring using the ground truth and another Flow zone for the input drift approach. Both use the same model as input to the Evaluate recipe, but there are two important differences.
One difference is the input data to the Evaluate recipe:
The ground truth monitoring zone uses labeled, scored records.
The input drift monitoring zone uses unlabeled records (even though in this case, the actual data is labeled).
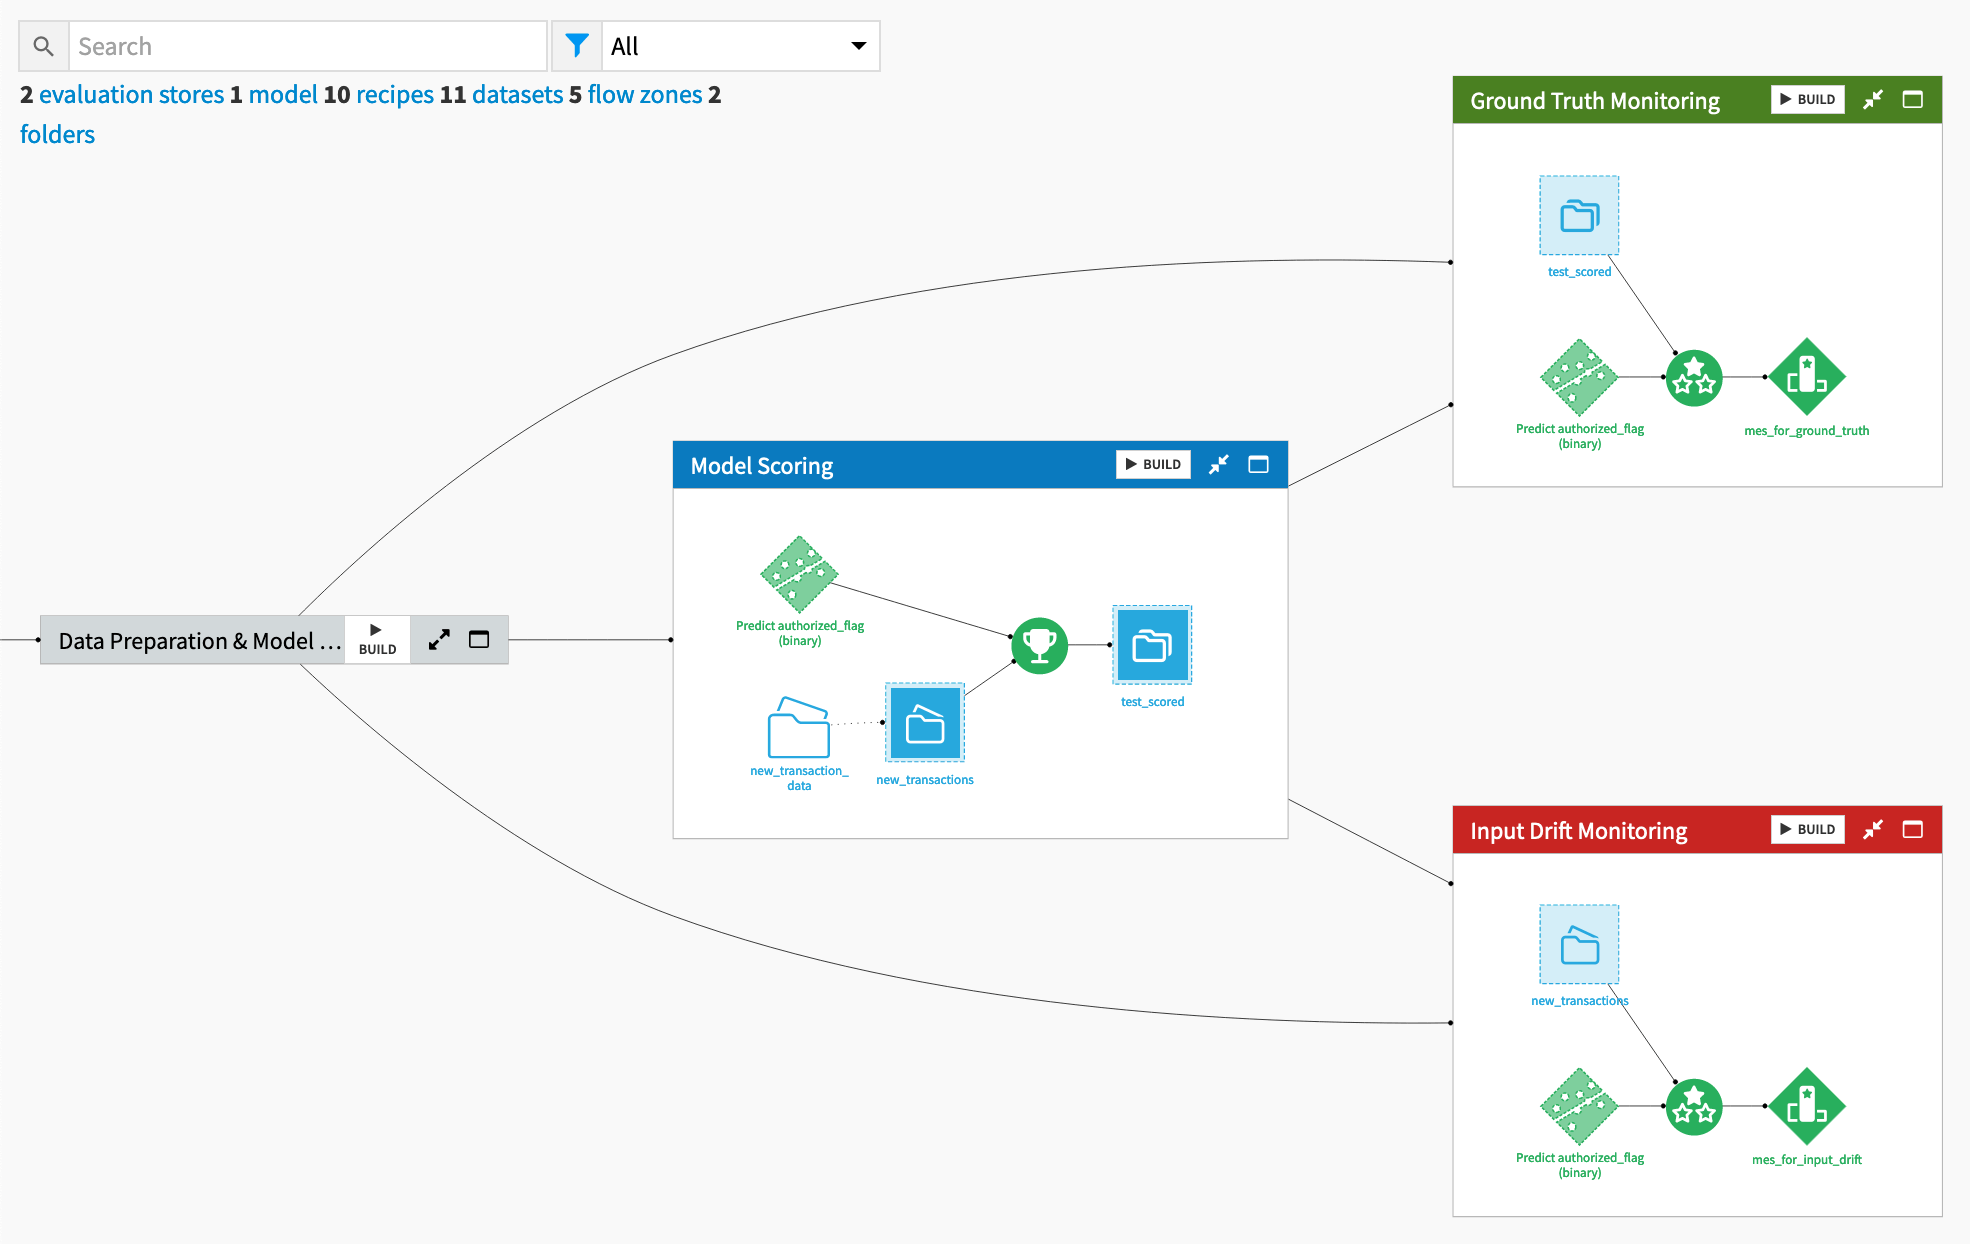
The second difference is that the Evaluate recipe in the input drift monitoring zone doesn’t compute performance metrics. The tutorial assumes the ground truth isn’t present.
See also
See the reference documentation to learn more about the Evaluate recipe.
Compare and contrast model monitoring pipelines#
These model evaluation stores are still empty! Let’s evaluate the April 2017 data, the first month beyond the model’s training data.
Build the MES for ground truth monitoring#
Start with the model evaluation store that will have all performance metrics.
In the Ground Truth Monitoring Flow zone, select the mes_for_ground_truth.
In the Actions (
) tab of the right panel, select Build.
Click Build Evaluation Store with the Build Only This setting.
When the job finishes, open the mes_for_ground_truth.
For the single model evaluation at the bottom, scroll to the right, and observe a full range of performance metrics.
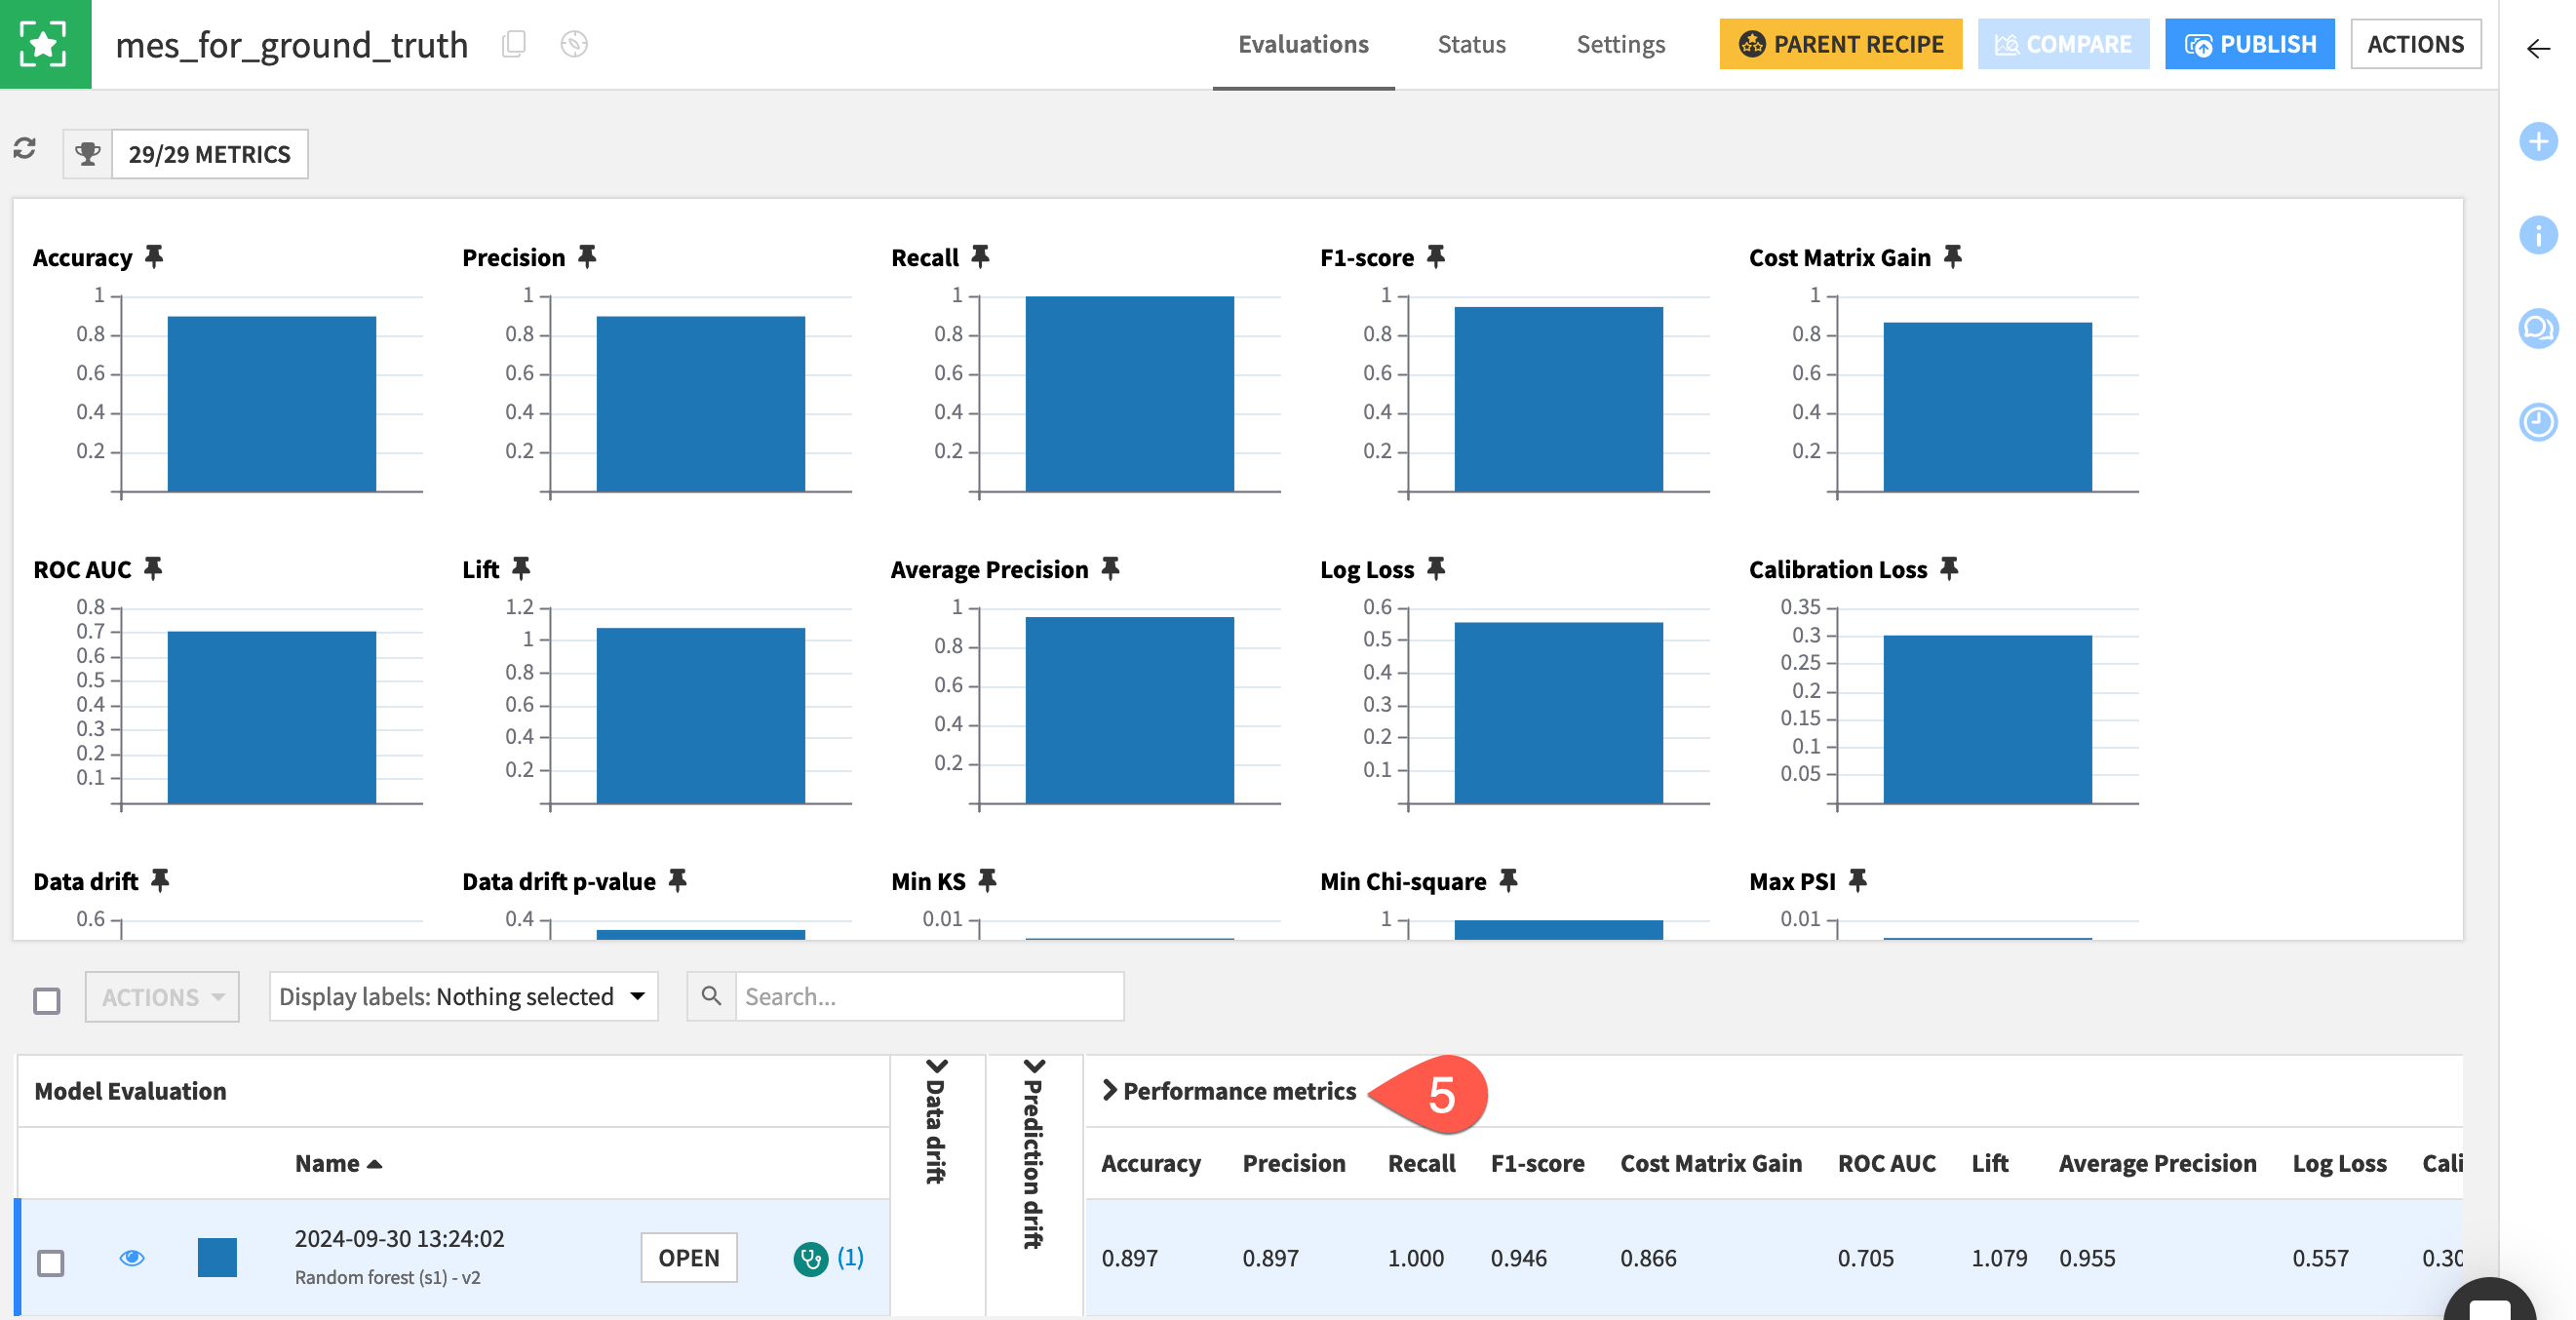
Important
One run of the Evaluate recipe produces one model evaluation.
A model evaluation contains both metadata on the model and input, but also the computed metrics (in this case on data, prediction, and performance).
Build the MES for input drift monitoring#
Now compare it the model evaluation store without performance metrics.
In the Input Drift Monitoring Flow zone, select the mes_for_input_drift.
In the Actions (
) tab of the right panel, select Build.
Click Build Evaluation Store with the Build Only This setting.
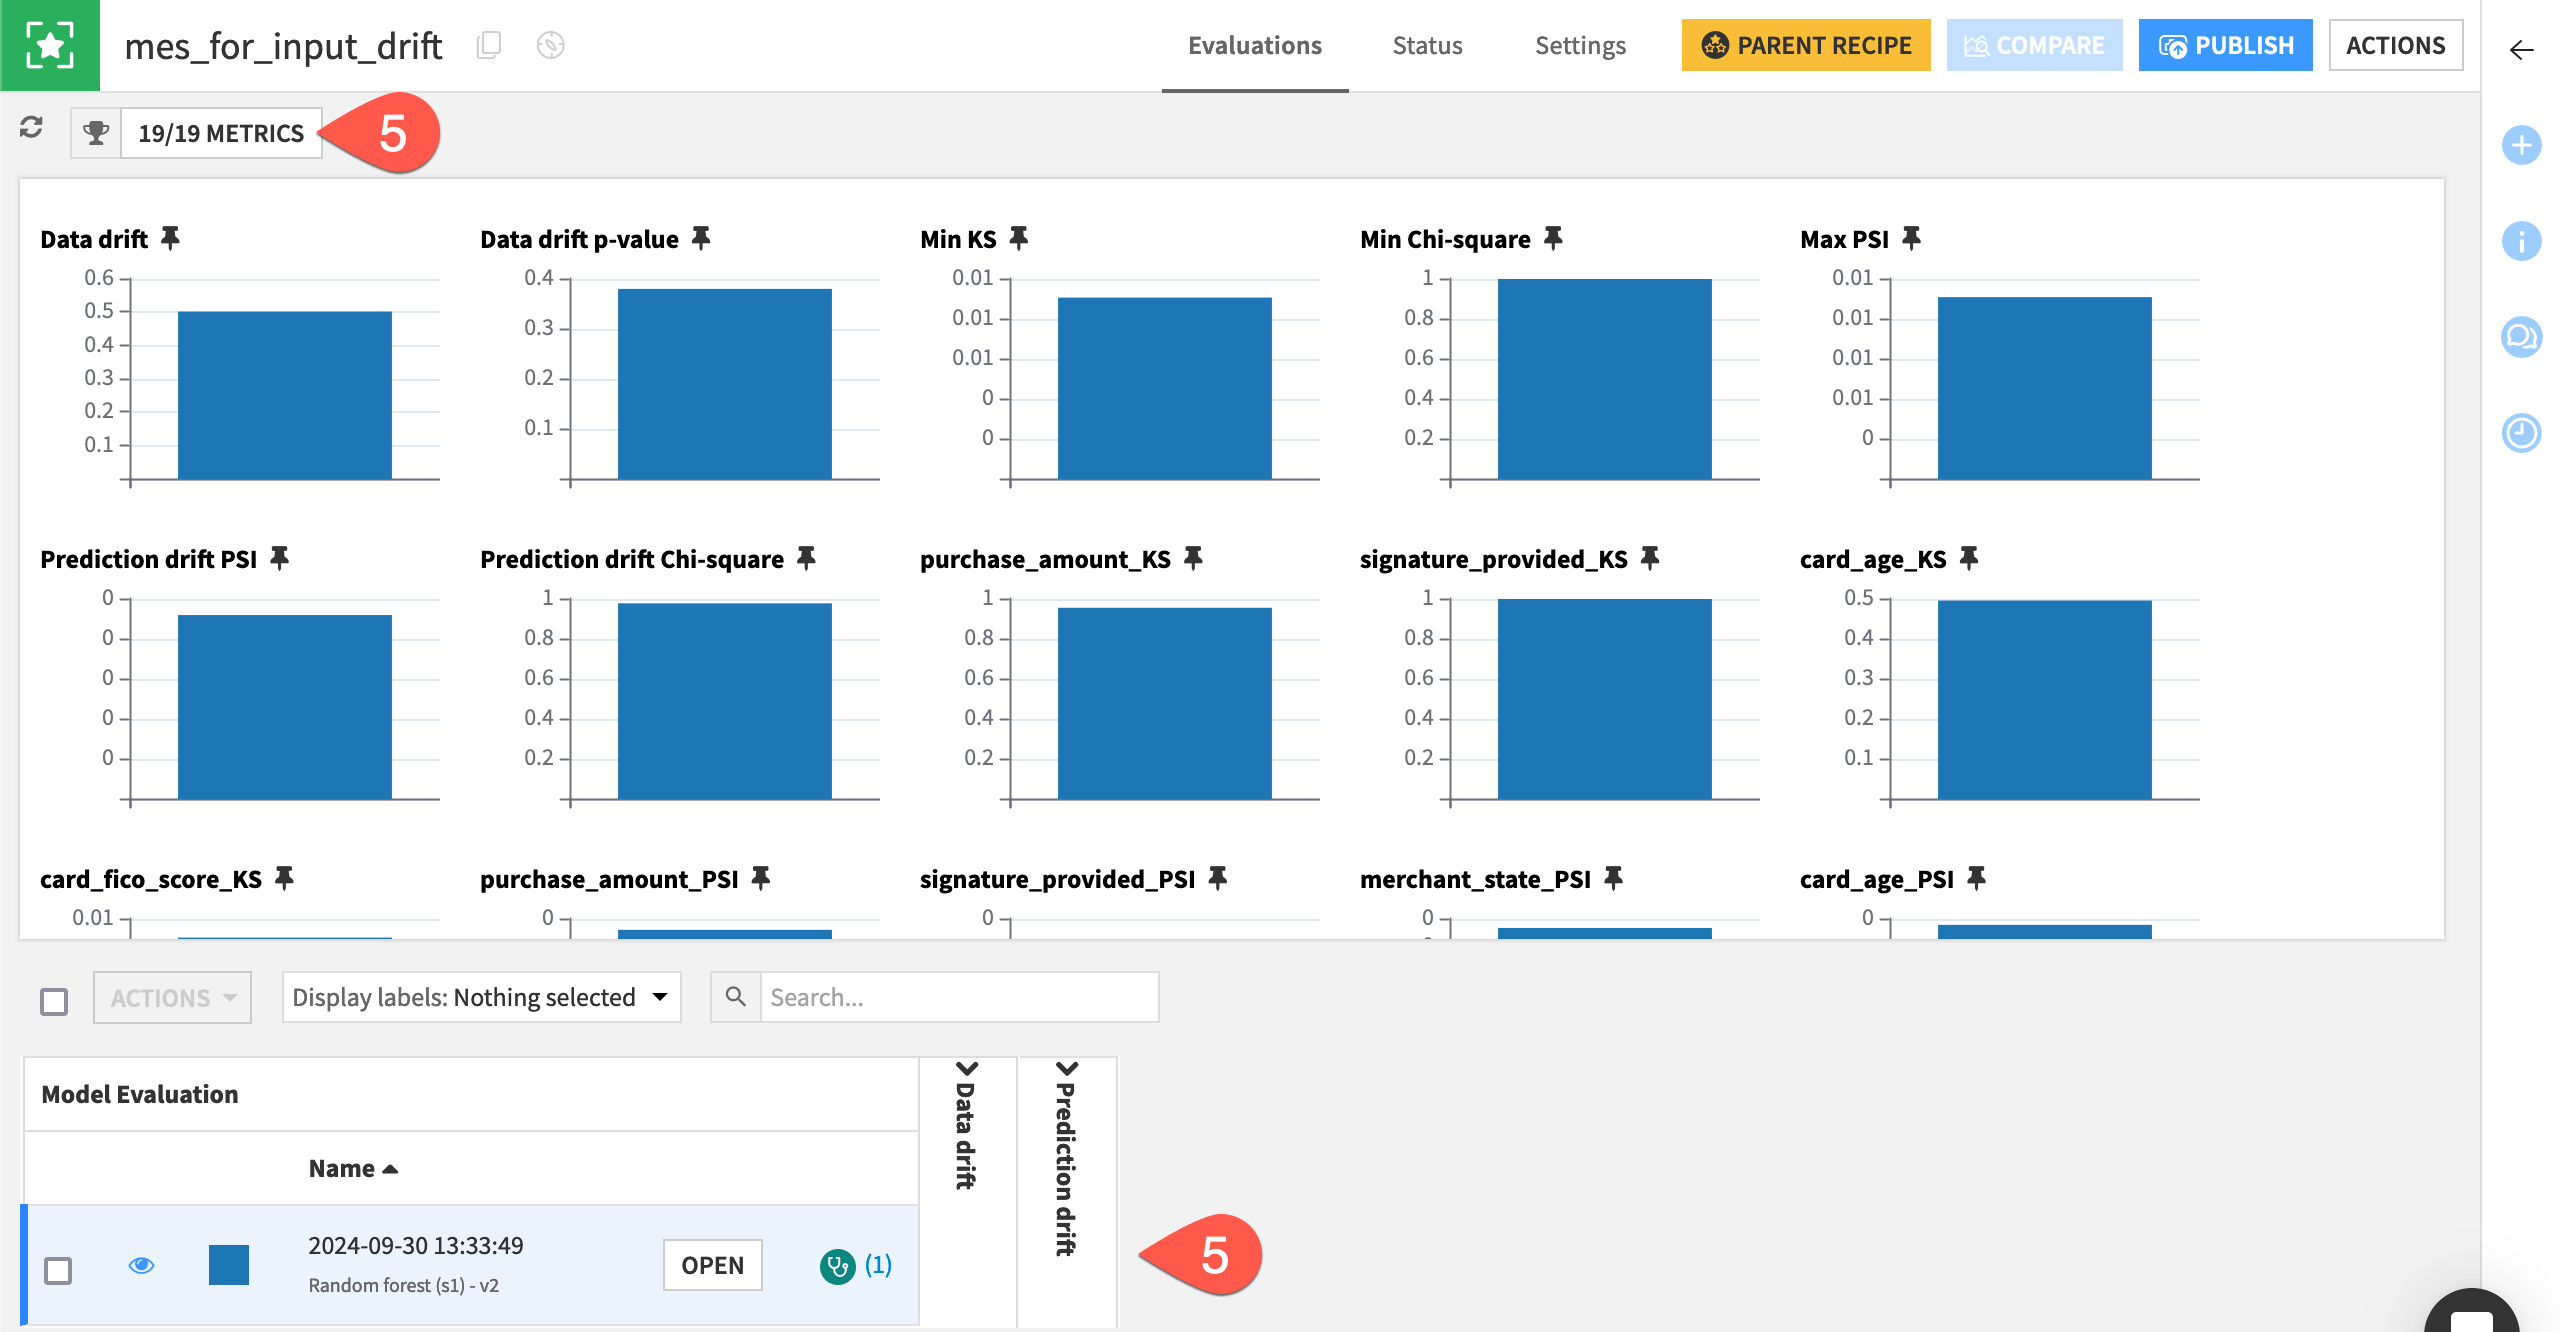
When the job finishes, open the mes_for_input_drift.
In the model evaluation row, or the “Metrics to display” window, observe how performance metrics aren’t available.
Note
If you examine the job log for building either MES, you may notice an ML diagnostic warning — in particular, a dataset sanity check. As this tutorial doesn’t focus on the actual quality of the model, you can ignore this warning. In a real situation, you’d want to play close attention to such warnings.
Run more model evaluations#
Before diving into the meaning of these metrics, let’s add more data to the pipelines. This will enable more comparisons between the model’s training data and the new “production” data found in the new_transaction_data folder.
Get a new month of transactions#
In the Model Scoring Flow zone, navigate to the Settings tab of the new_transactions dataset.
In the Files subtab, confirm that the Files selection field is set to Explicitly select files.
Click the trash can (
) to remove /transactions_prepared_2017_04.csv.
On the right, click List Files to refresh.
Check the box to include /transactions_prepared_2017_05.csv.
Click Save.
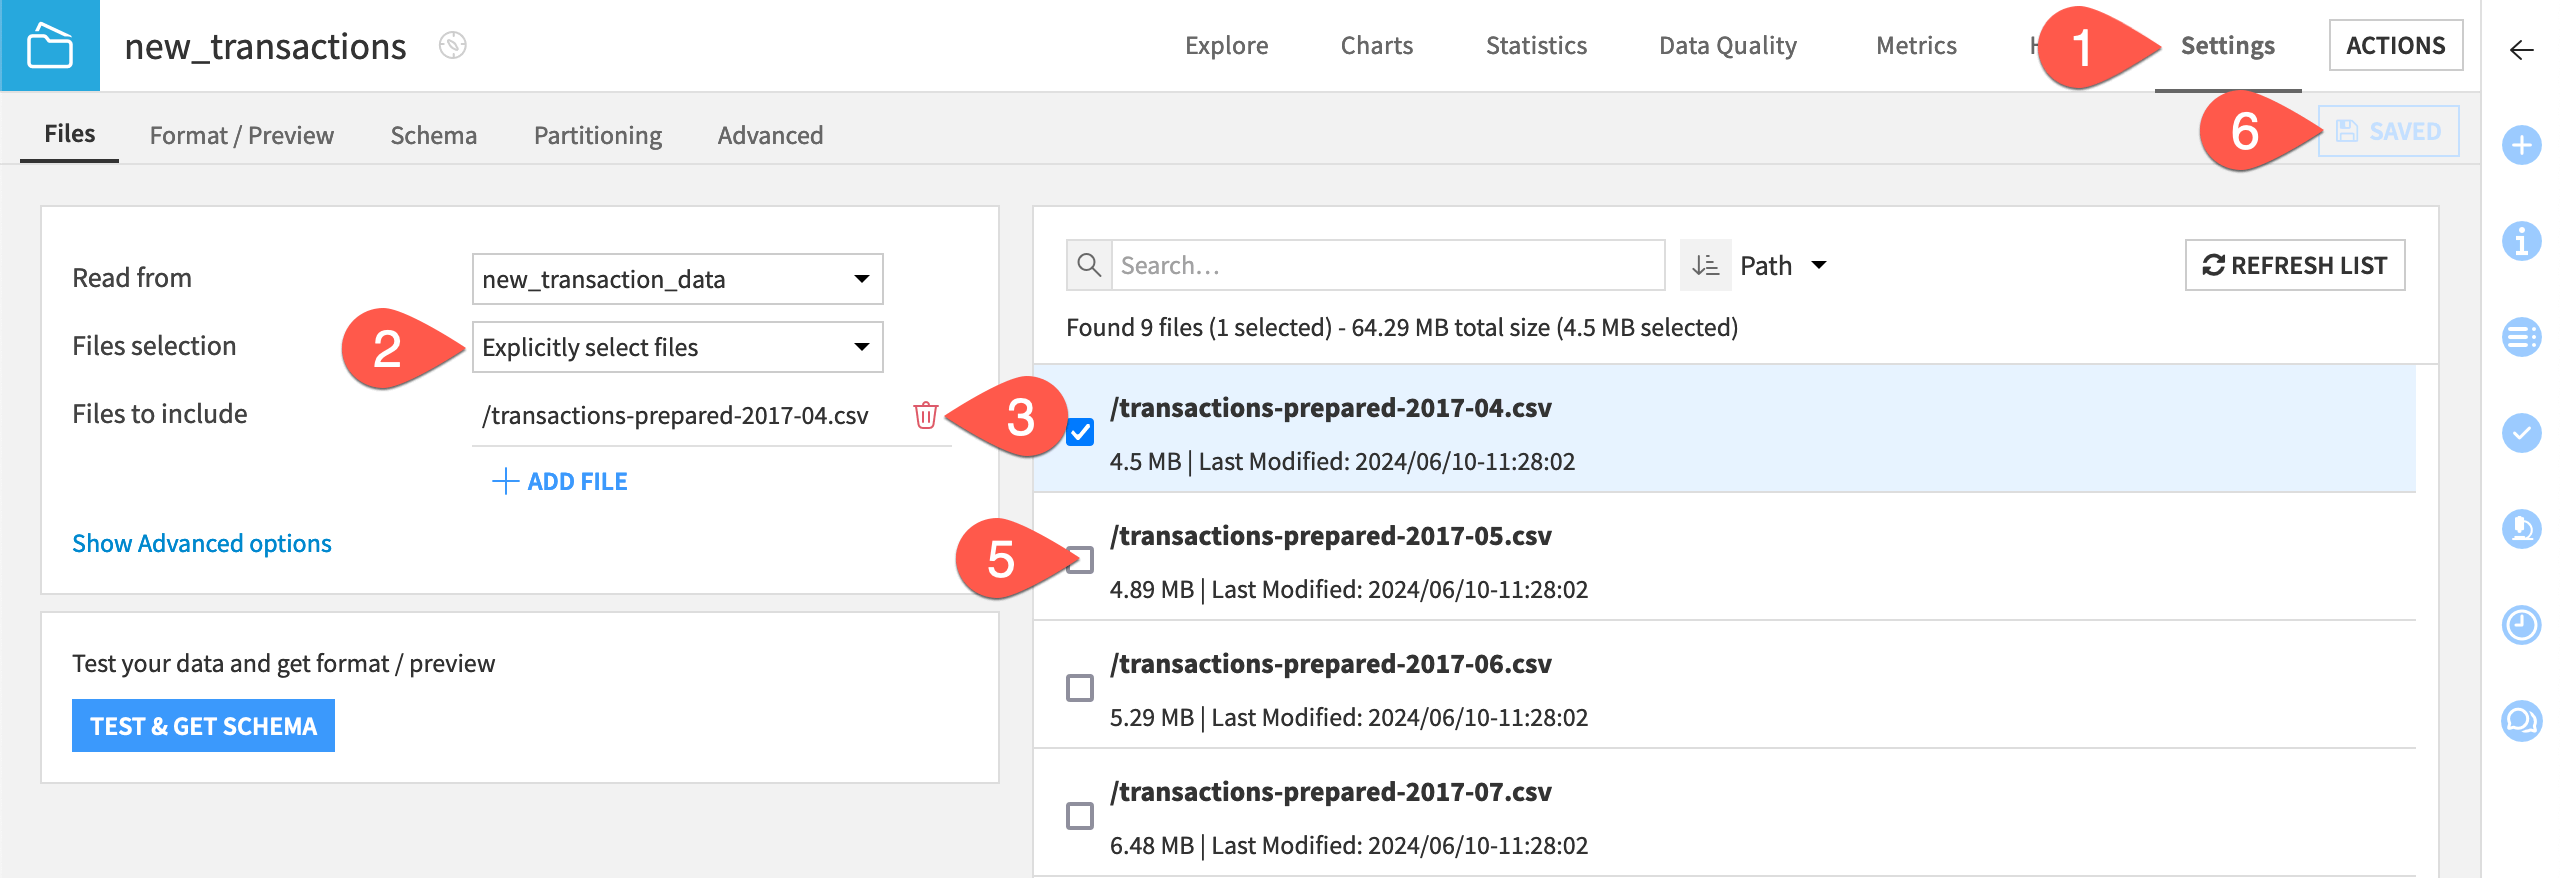
Refresh the page to confirm that the dataset now only contains data from May.
Rebuild the MES for input drift monitoring#
You can immediately evaluate the new data in the Input Drift Monitoring Flow zone.
In the Input Drift Monitoring Flow zone, select the mes_for_input_drift.
In the Actions (
) tab of the right panel, select Build.
Click Build Evaluation Store with the Build Only This setting.
Rebuild the MES for ground truth monitoring#
For ground truth monitoring, you first need to send the data through the Score recipe to maintain consistency.
In the Ground Truth Monitoring Flow zone, select the mes_for_ground_truth.
In the Actions (
) tab of the right panel, select Build.
Select Build Upstream.
Click Preview to confirm that the job will run first the Score recipe and then the Evaluate recipe.
Click Run.
Open the mes_for_ground_truth to find a second model evaluation when the job has finished.
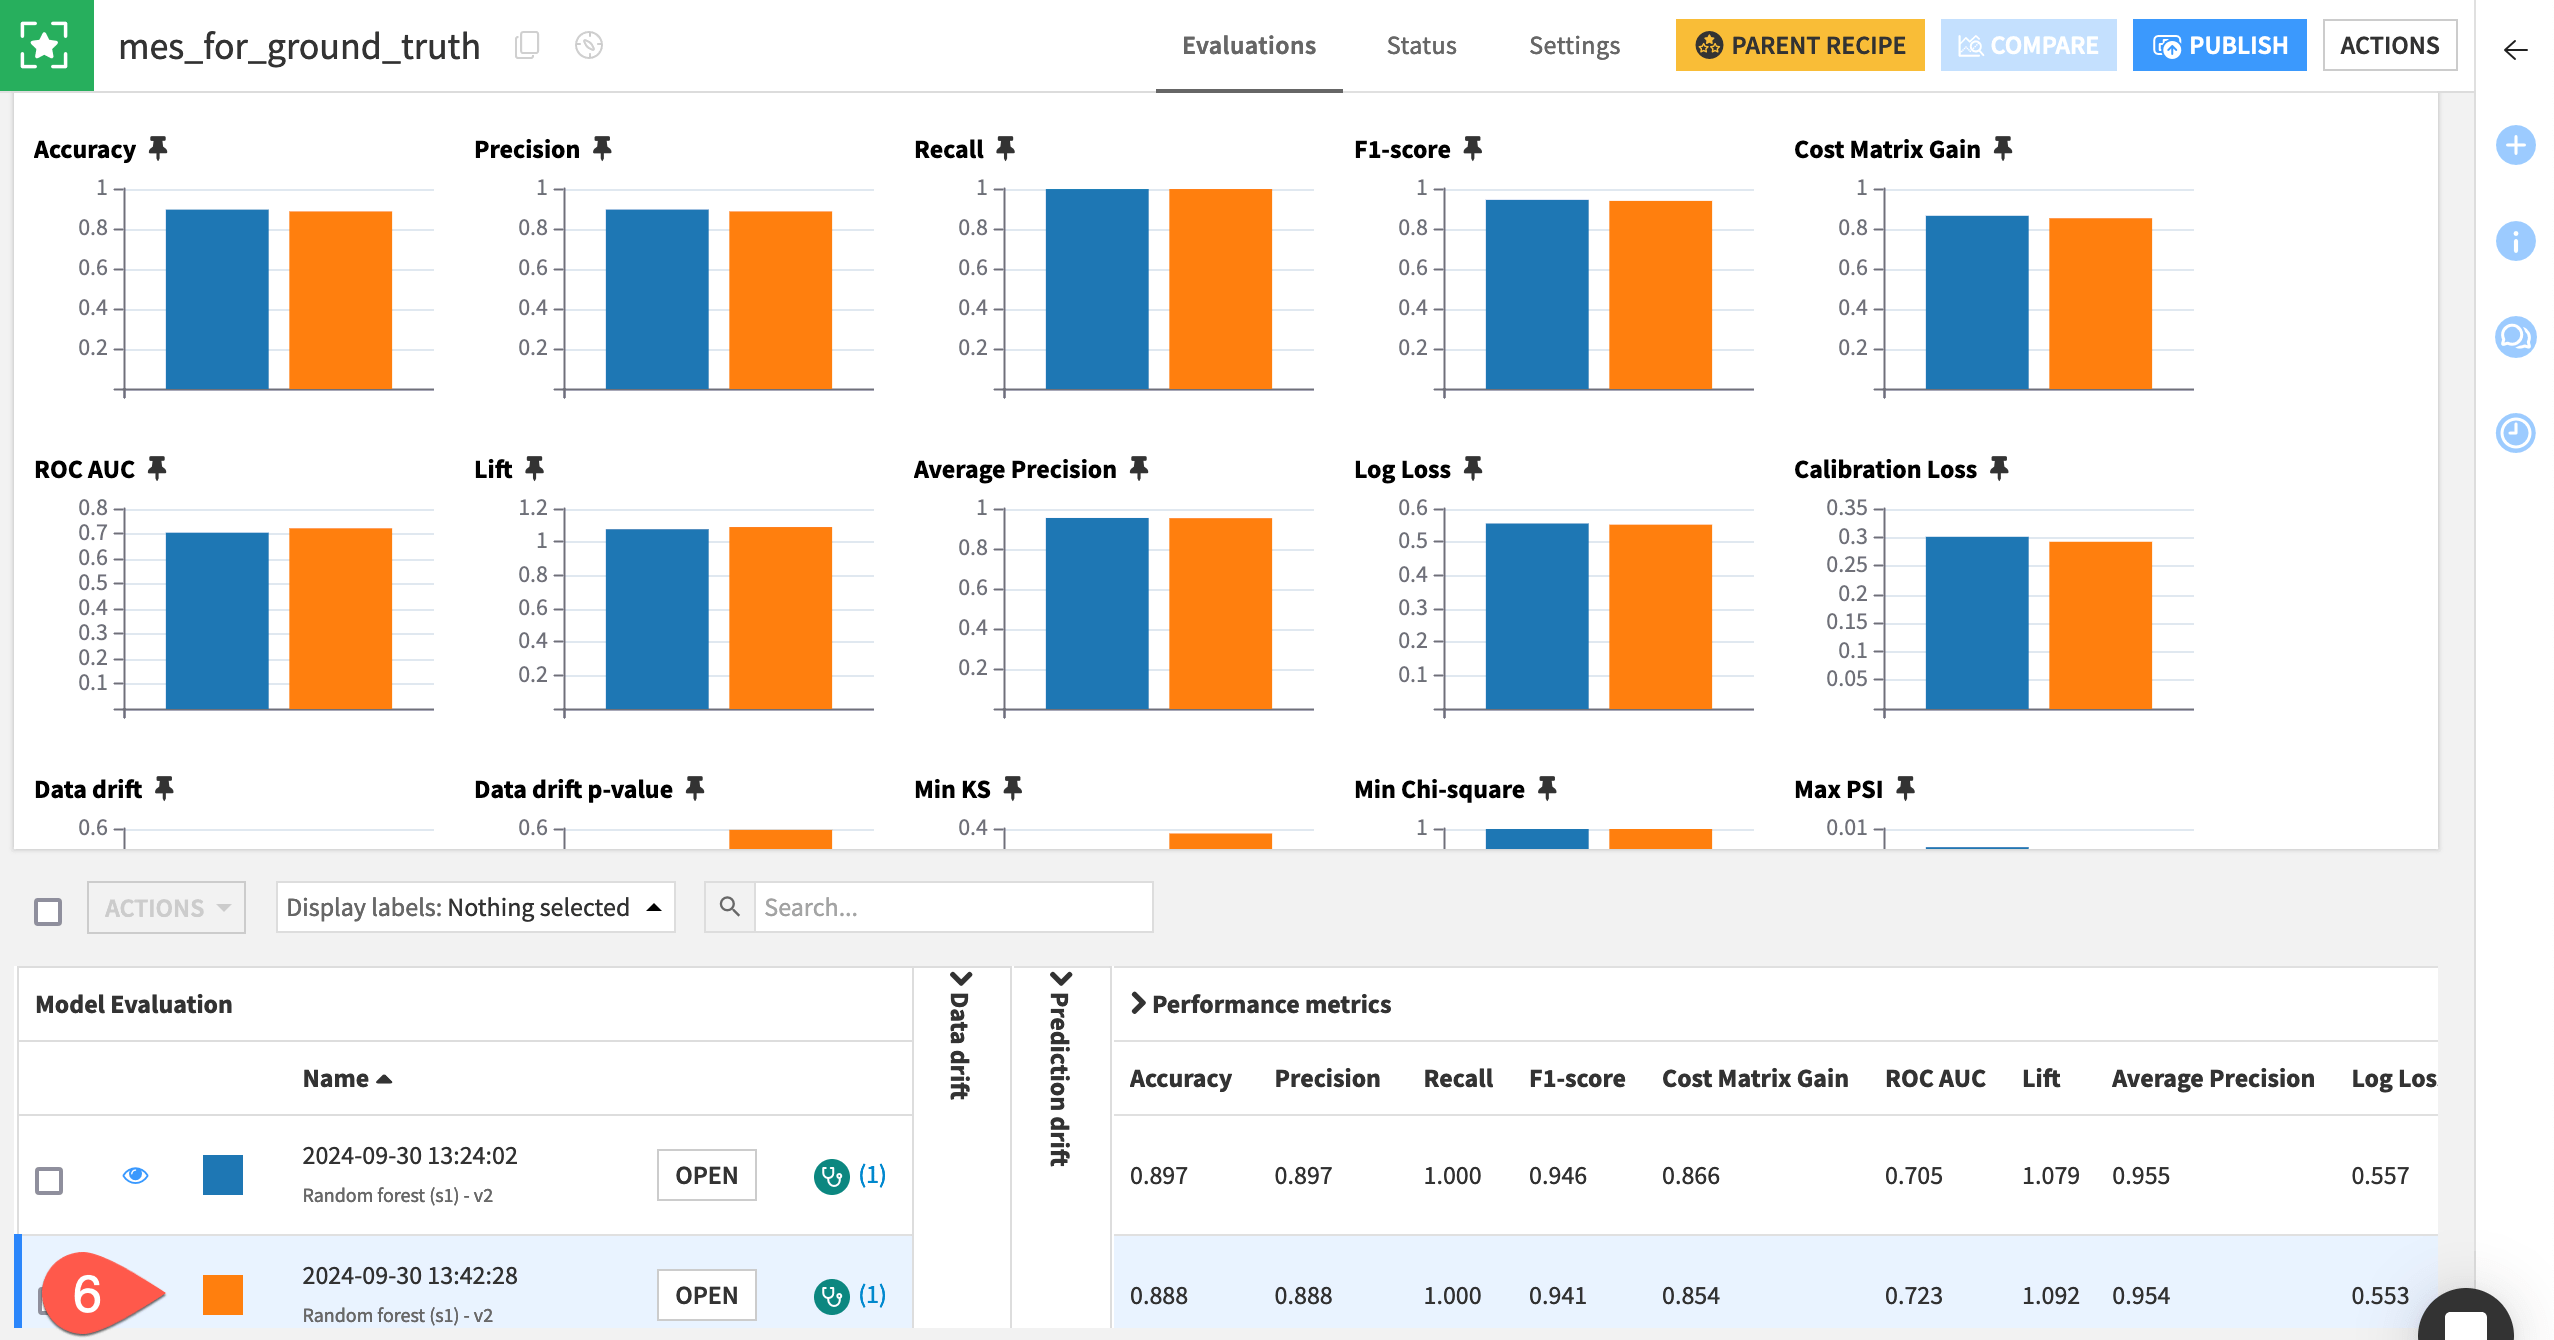
Tip
At this point, both model evaluation stores should have two rows (two model evaluations). Feel free to repeat the process above for the months of June and beyond so that your model evaluation stores have more data to compare.
Conduct drift analysis#
Now that you have some evaluation data to examine, let’s dive into what information the model evaluation store contains. Recall that the main concern is the model becoming obsolete over time.
The model evaluation store enables monitoring of three different types of model drift:
Input data drift
Prediction drift
Performance drift (when ground truth is available)
See also
See the reference documentation to learn more about Drift analysis in Dataiku.
Input data drift#
Input data drift analyzes the distribution of features in the evaluated data.
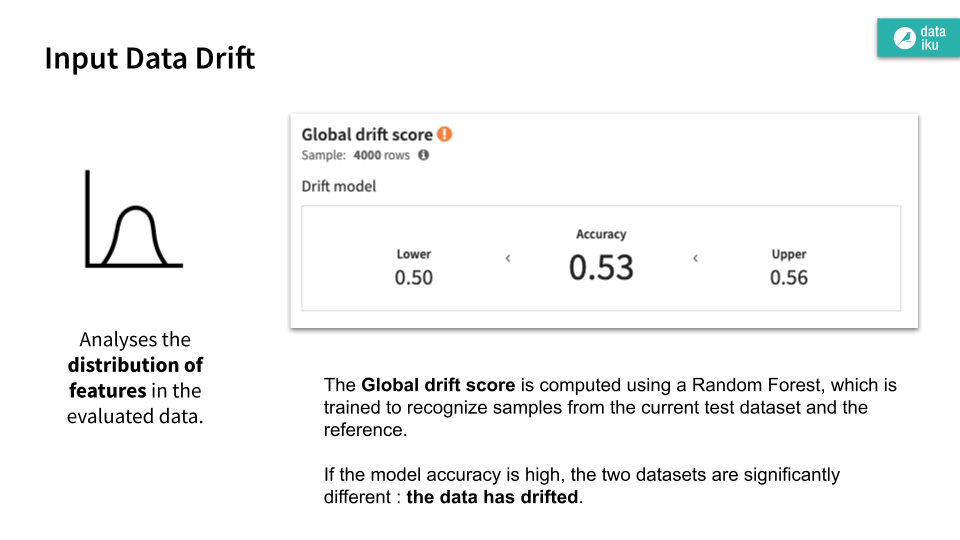
Open the mes_for_ground_truth.
For the most recent model evaluation at the bottom, click Open.
Navigate to the Input data drift panel.
Explore the visualizations, clicking Compute as needed.
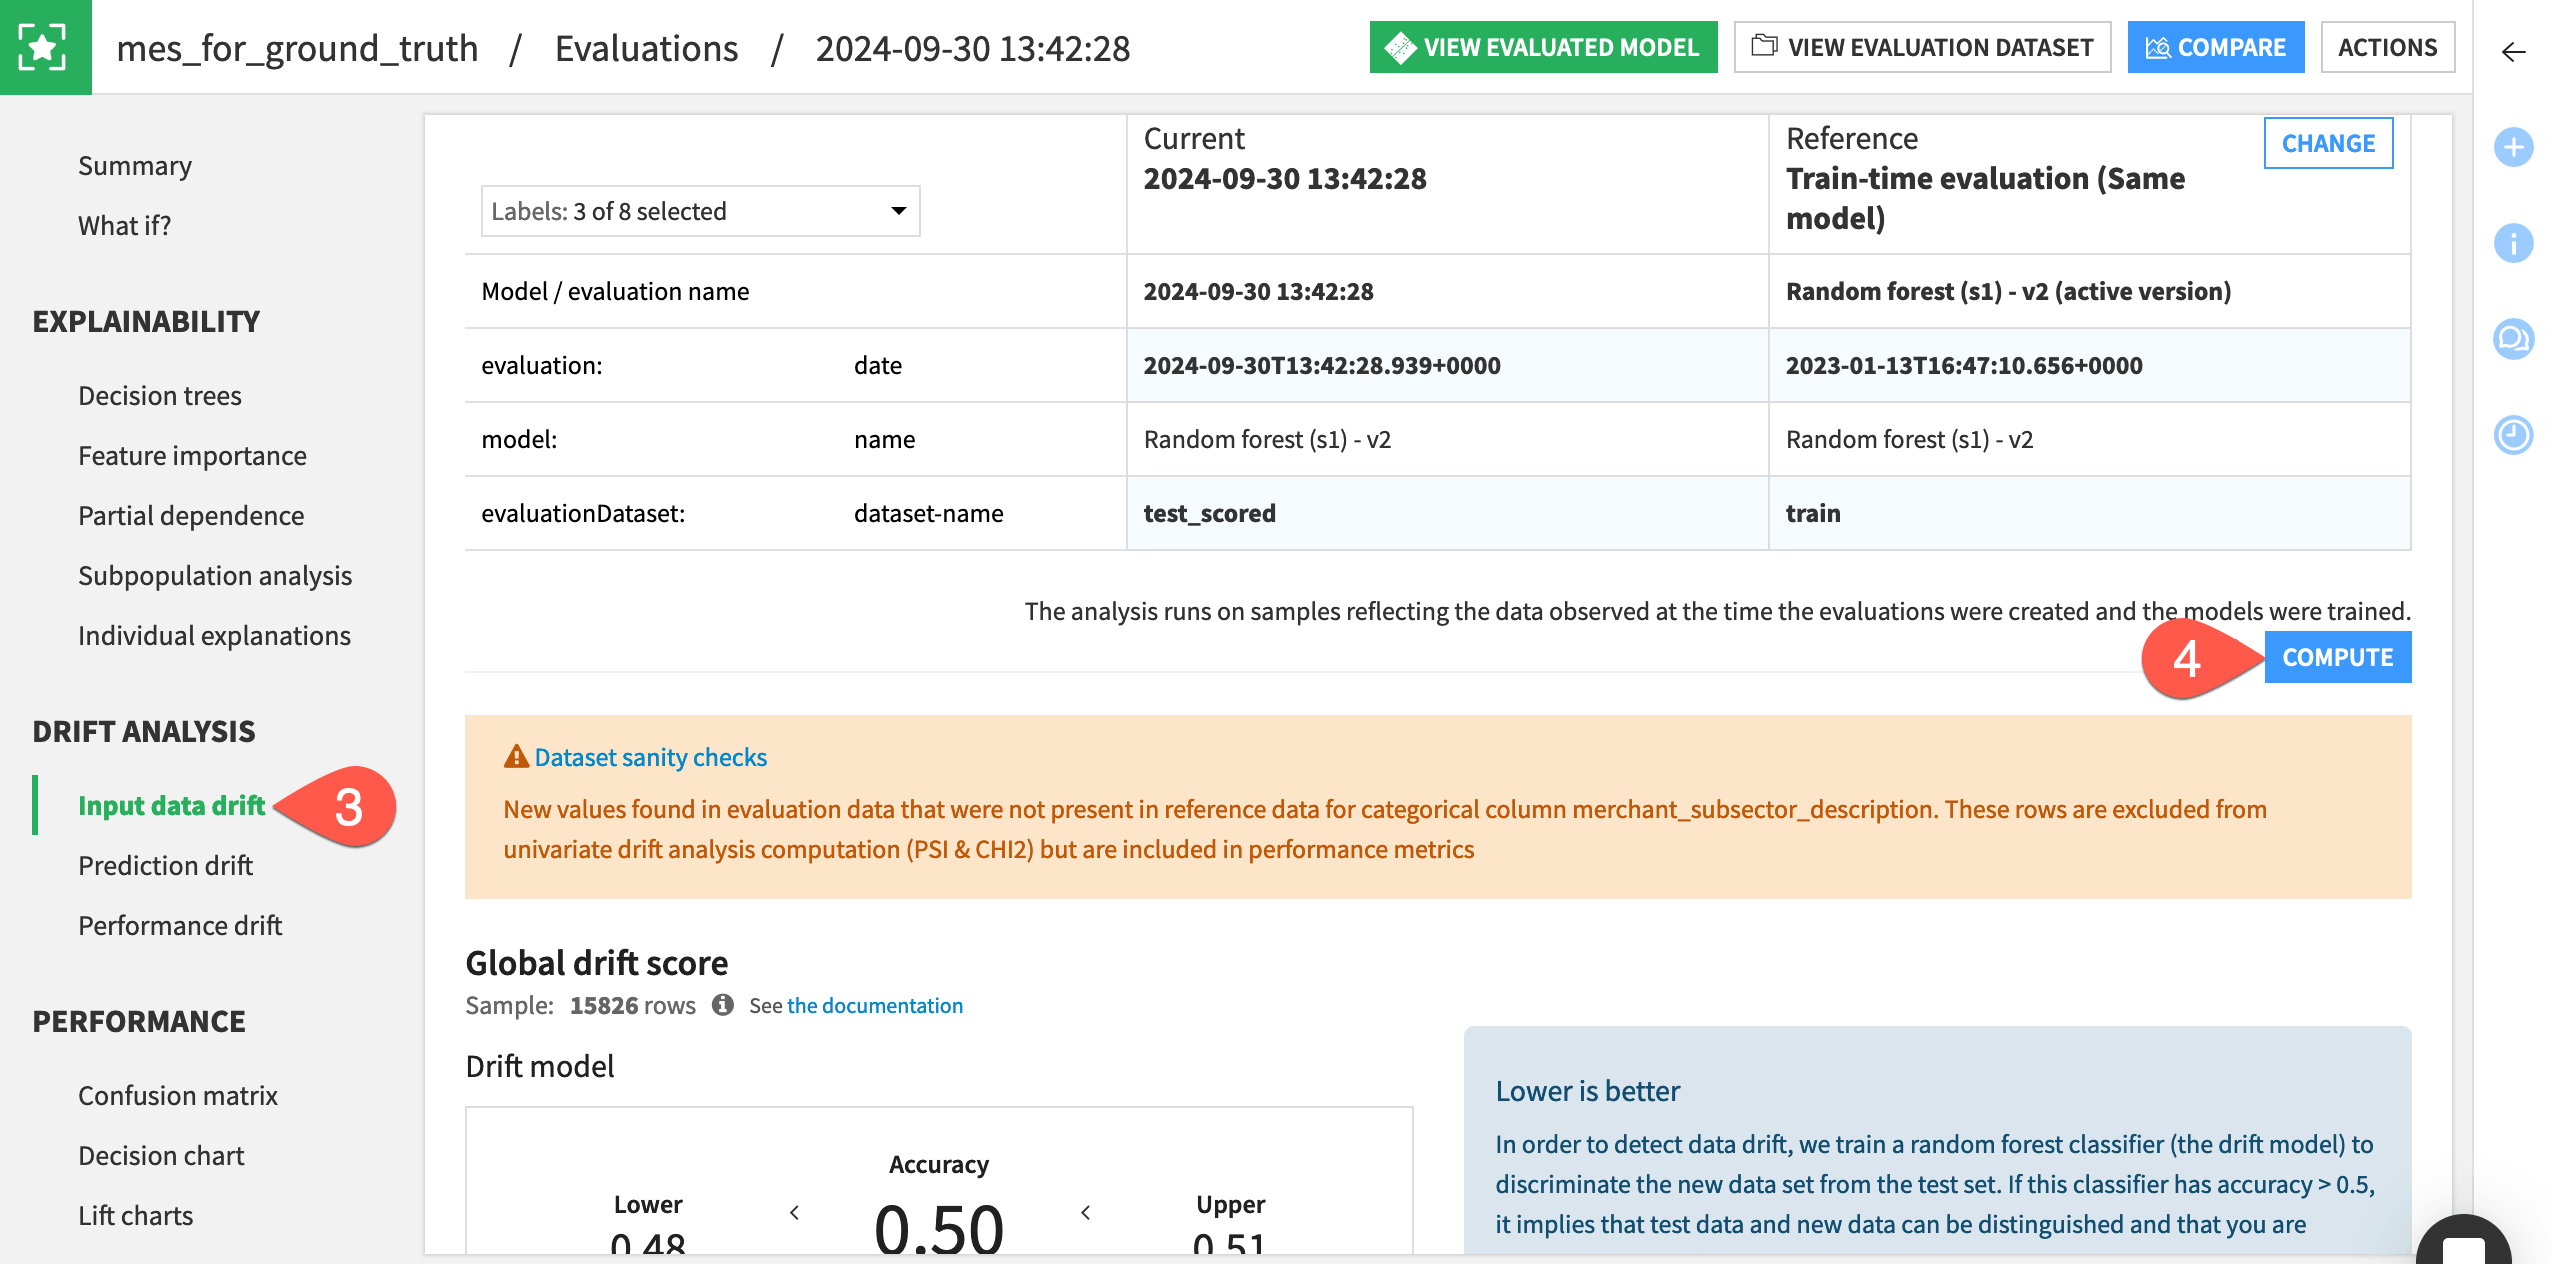
See also
See the reference documentation on Input Data Drift to understand how these figures can provide an early warning sign of model degradation.
Prediction drift#
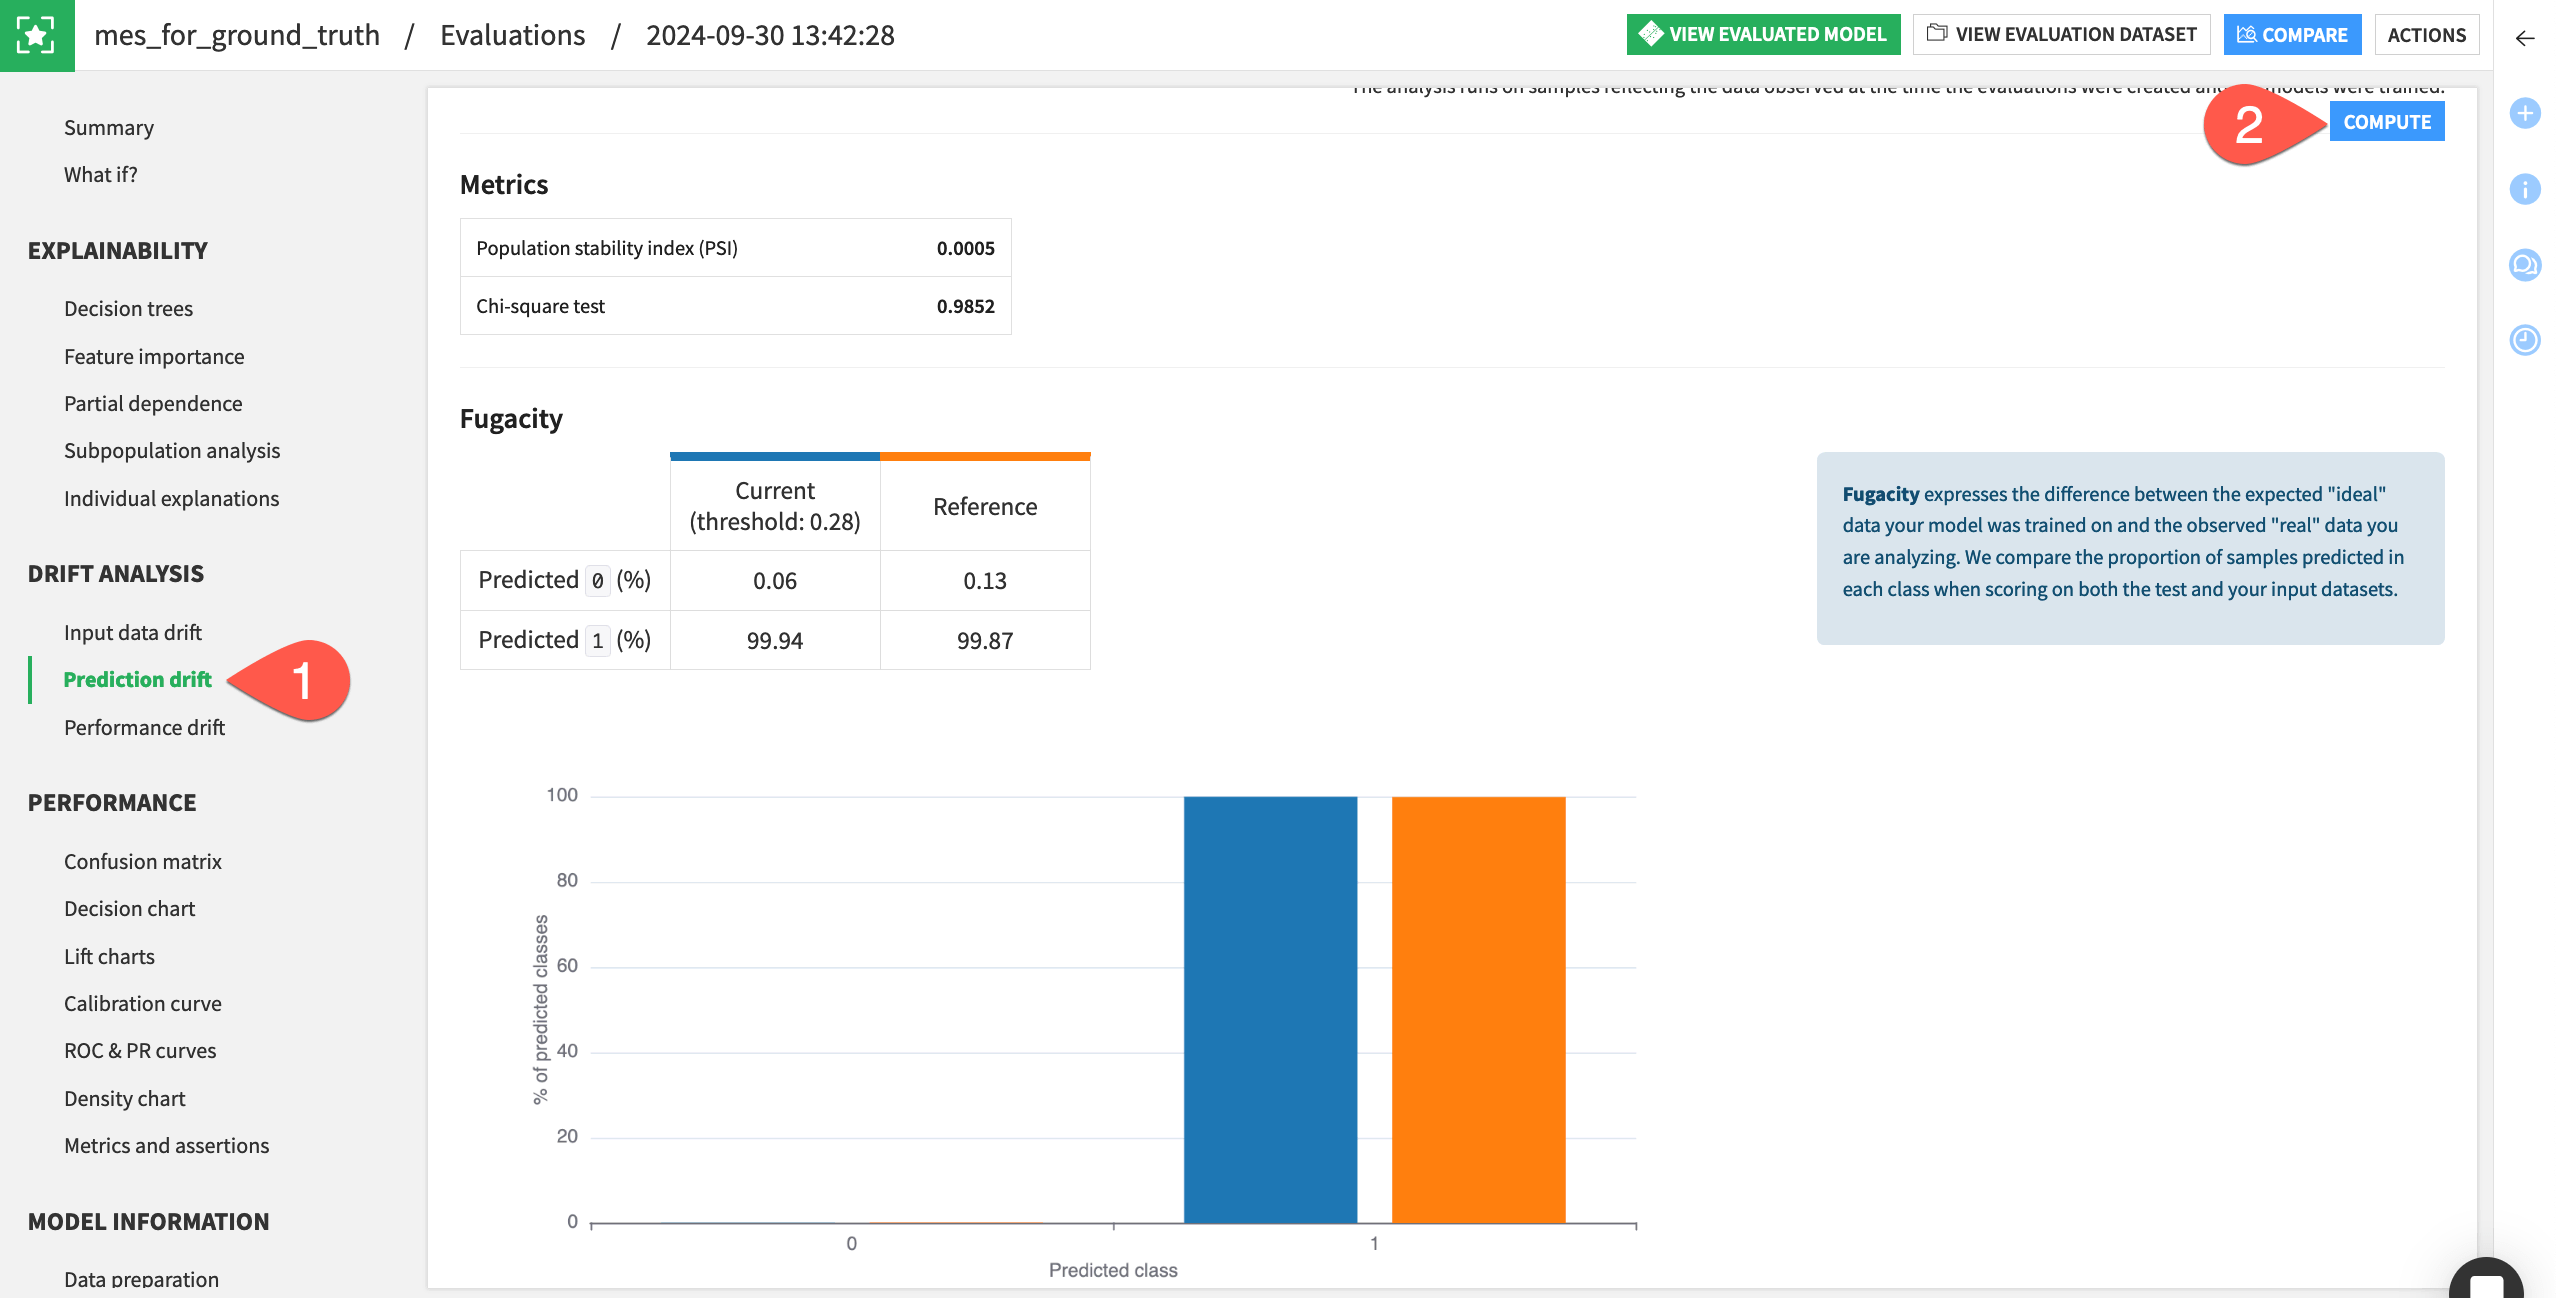
Prediction drift analyzes the distribution of predictions on the evaluated data.
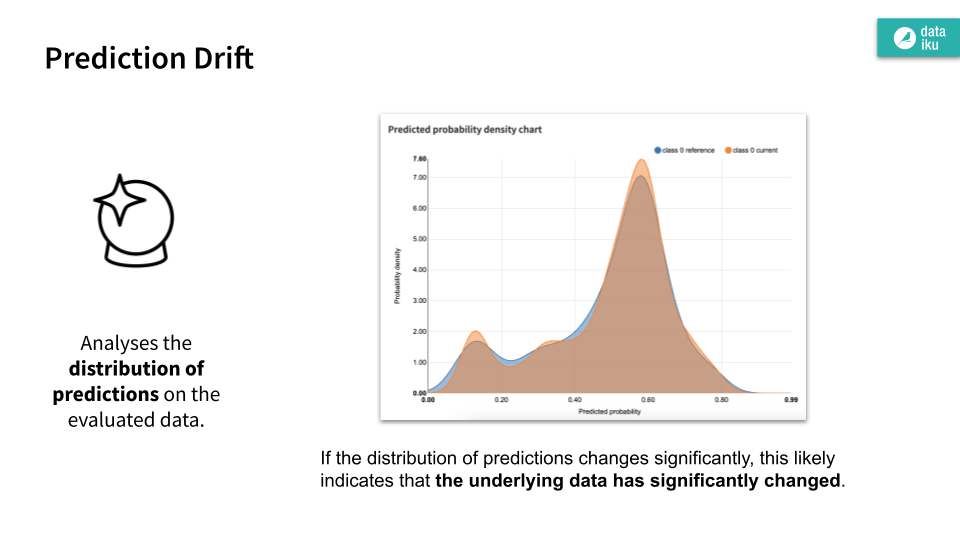
Remaining within the mes_for_ground_truth, navigate to the Prediction drift panel.
If not already present, click Compute, and explore the output in the fugacity and predicted probability density chart.
Performance drift#
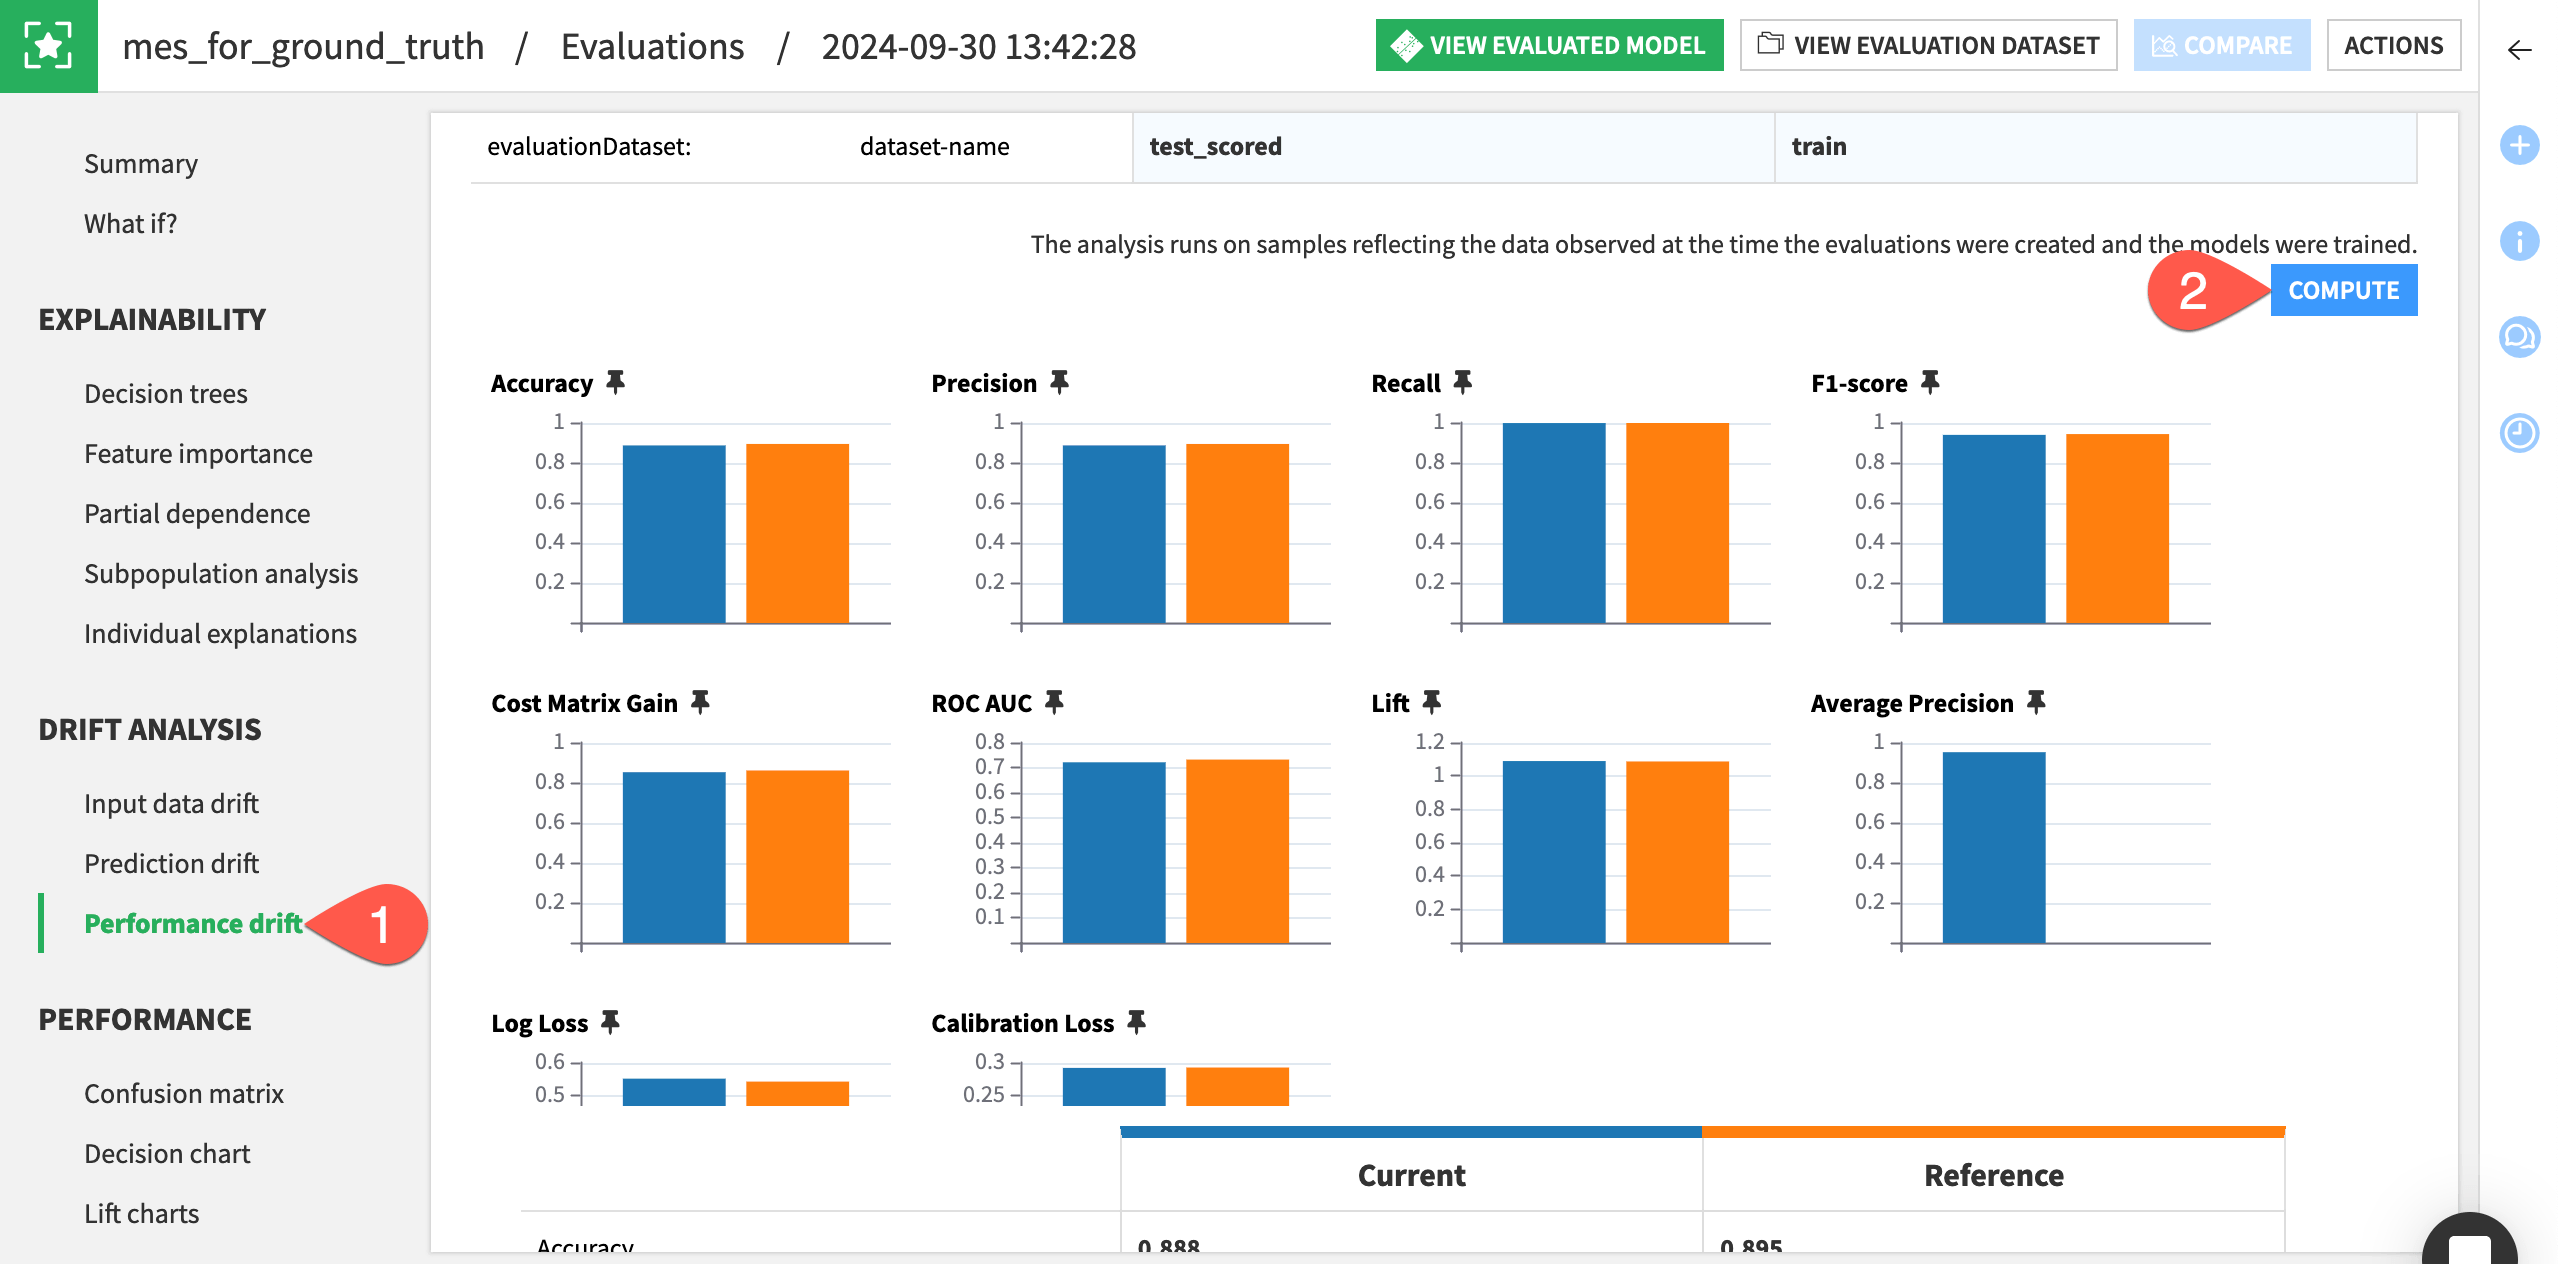
Performance drift analyzes whether the actual performance of the model changes.
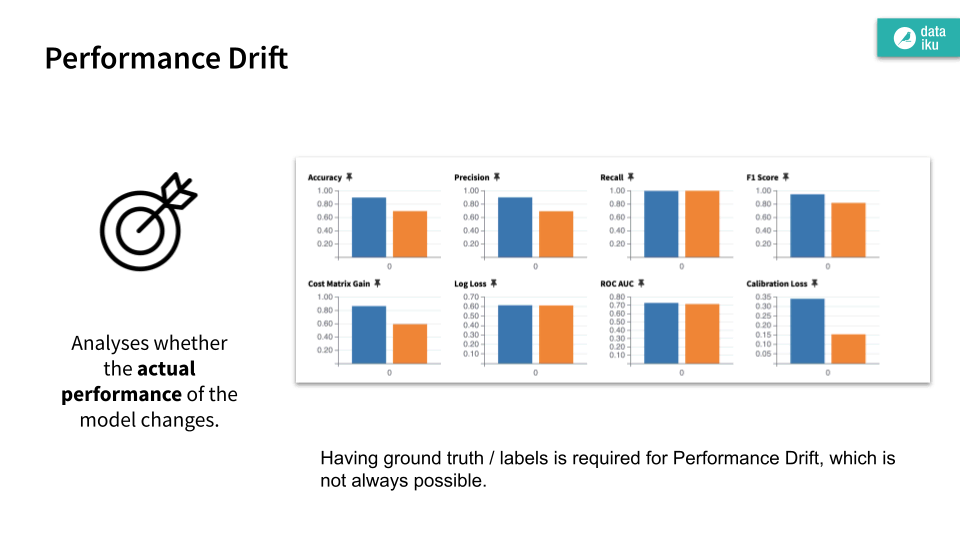
Lastly, navigate to the Performance drift panel of the mes_for_ground_truth.
If not already present, click Compute, and explore the table and charts comparing the performance metrics of the current test_scored dataset and reference training data.
Important
Thus far, you’ve only examined the drift analysis for the MES that computes performance metrics. Check the other MES to confirm that performance drift isn’t available.
Automate model monitoring#
You don’t want to manually build the model evaluation stores every time new data is available. You can automate this task with a scenario.
In addition to scheduling the computation of metrics, you can also automate actions based on the results. For example, the goal may be to retrain the model if a metric such as data drift exceeds a certain threshold. Let’s create the bare bones of a scenario to accomplish this kind of objective.
Note
This case monitors a MES metric using a check. You can also monitor datasets with data quality rules.
Create a check on a MES metric#
The first step is to choose a metric important to the use case. Since it’s one of the most common, let’s choose data drift.
Tip
This example chooses a data drift threshold to demonstrate an error. Defining an acceptable level of data drift is dependent on your use case.
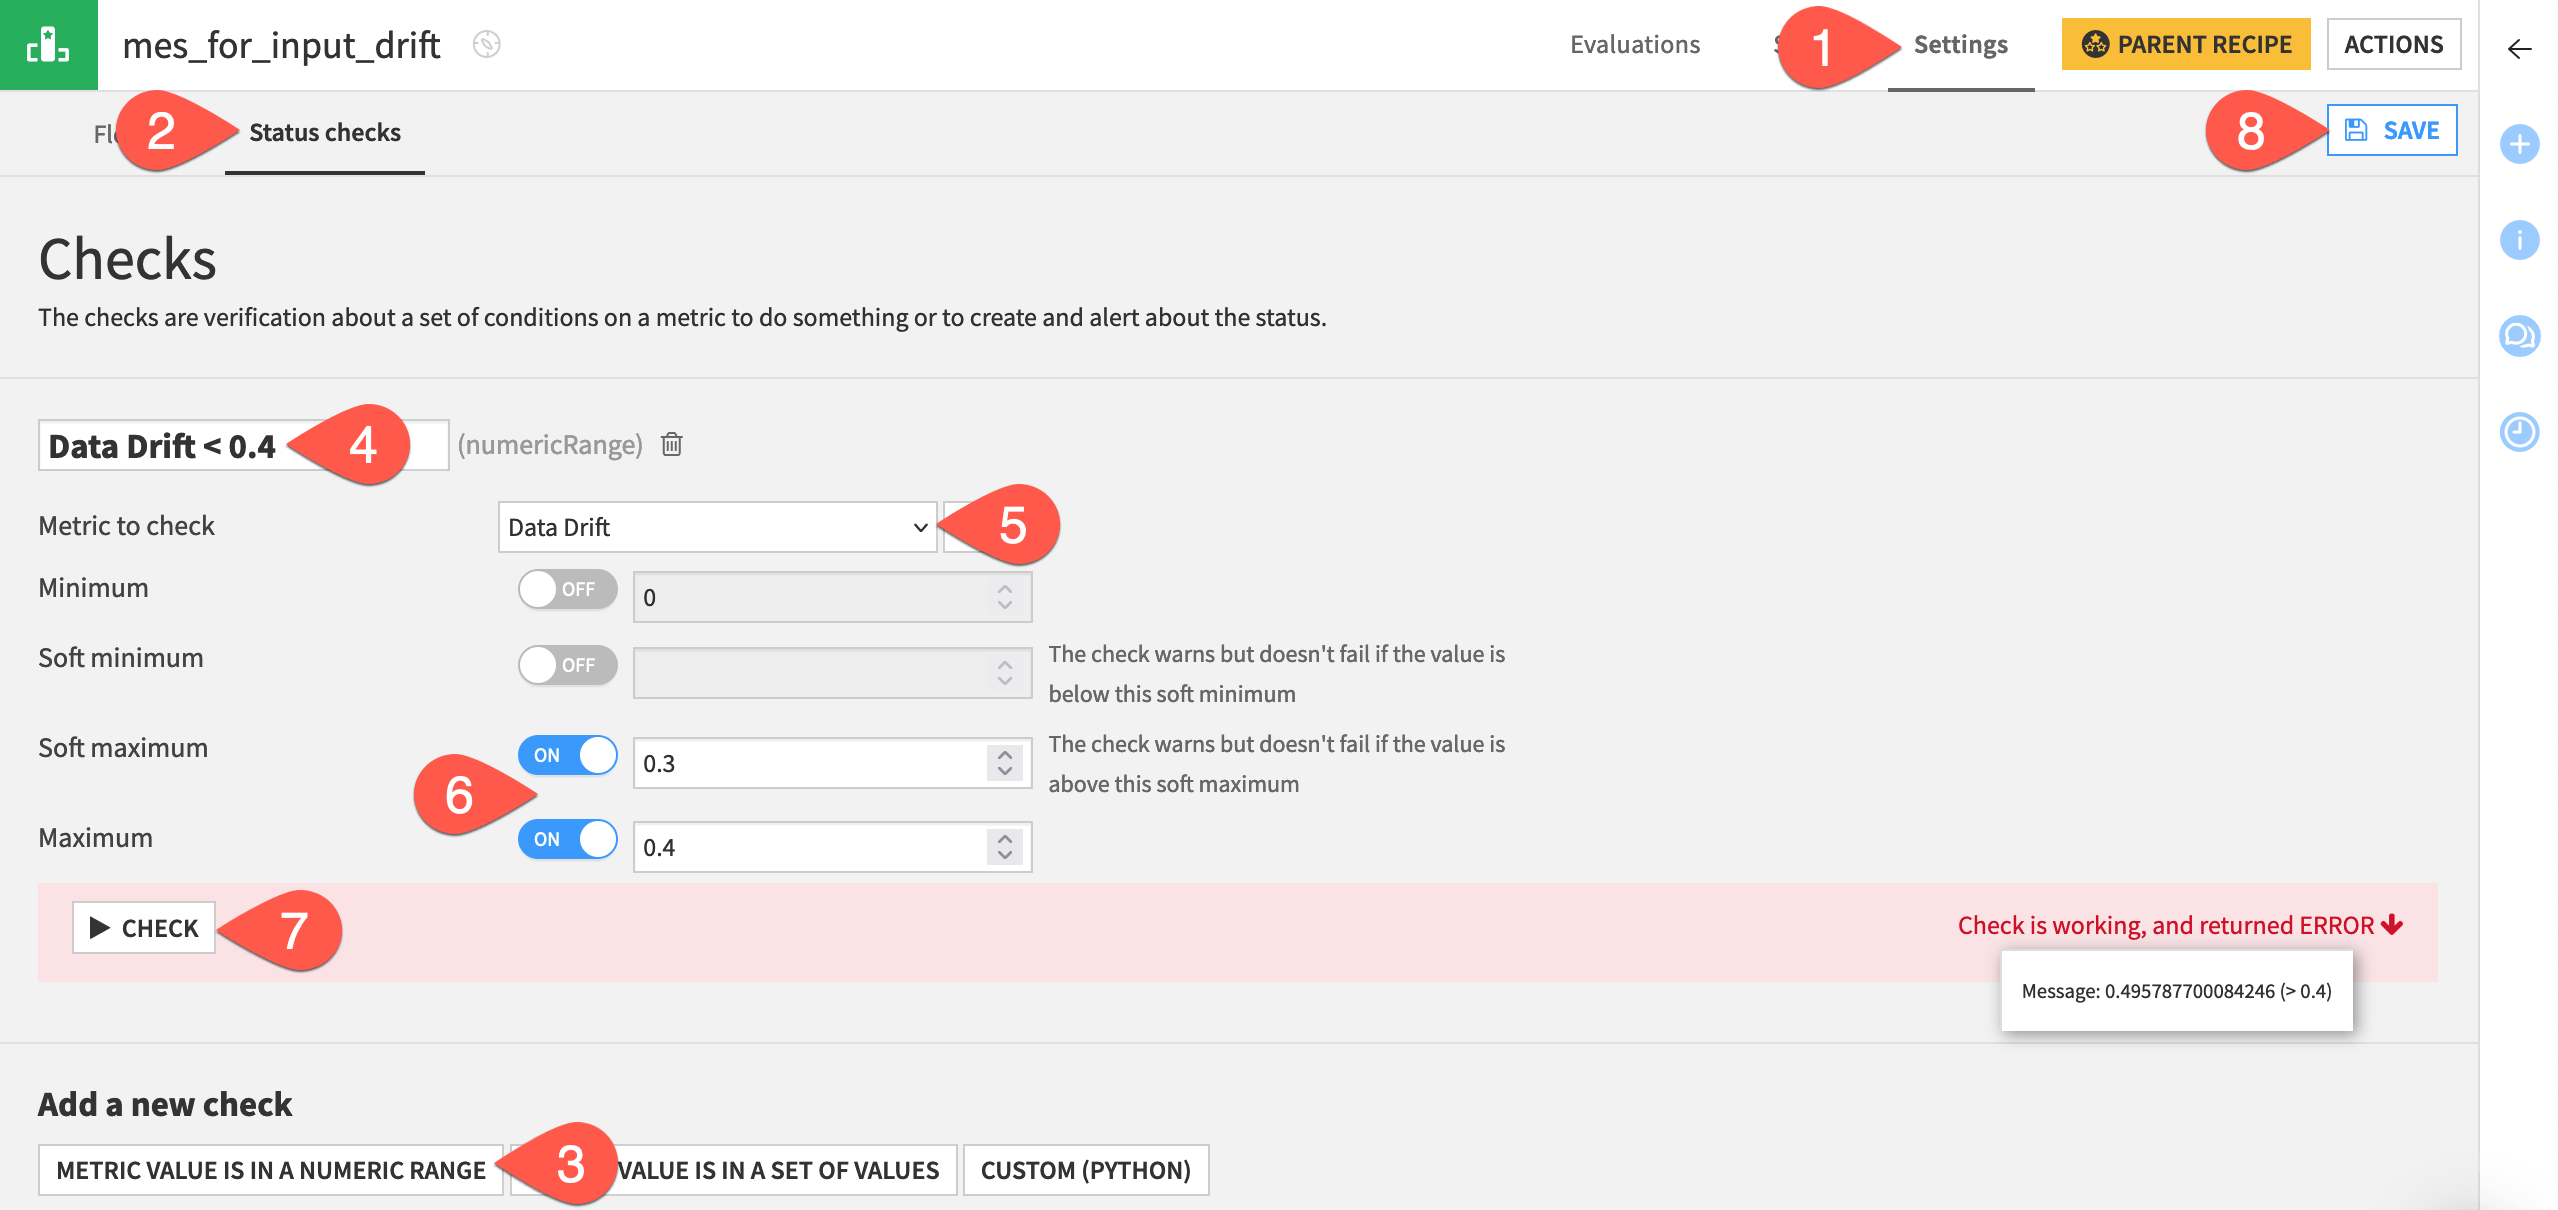
From the Flow, open the mes_for_input_drift, and navigate to the Settings tab.
Go to the Status checks subtab.
Click Metric Value is in a Numeric Range.
Name the check
Data Drift < 0.4.Choose Data Drift as the metric to check.
Set the Soft maximum to
0.3and the Maximum to0.4.Click Check to confirm it returns an error.
Click Save.
Now add this check to the display of metrics for the MES.
Navigate to the Status tab of the input drift MES.
Click X/Y Metrics.
Add both the data drift metric and the new check to the display.
Click Save once more.

Design the scenario#
Just like any other check, you now can use this MES check to control the state of a scenario run.
From the Jobs (
) menu in the top navigation bar, open the Scenarios page.
Click + New Scenario.
Name the scenario
Retrain Model.Click Create.
First, you need the scenario to build the MES.
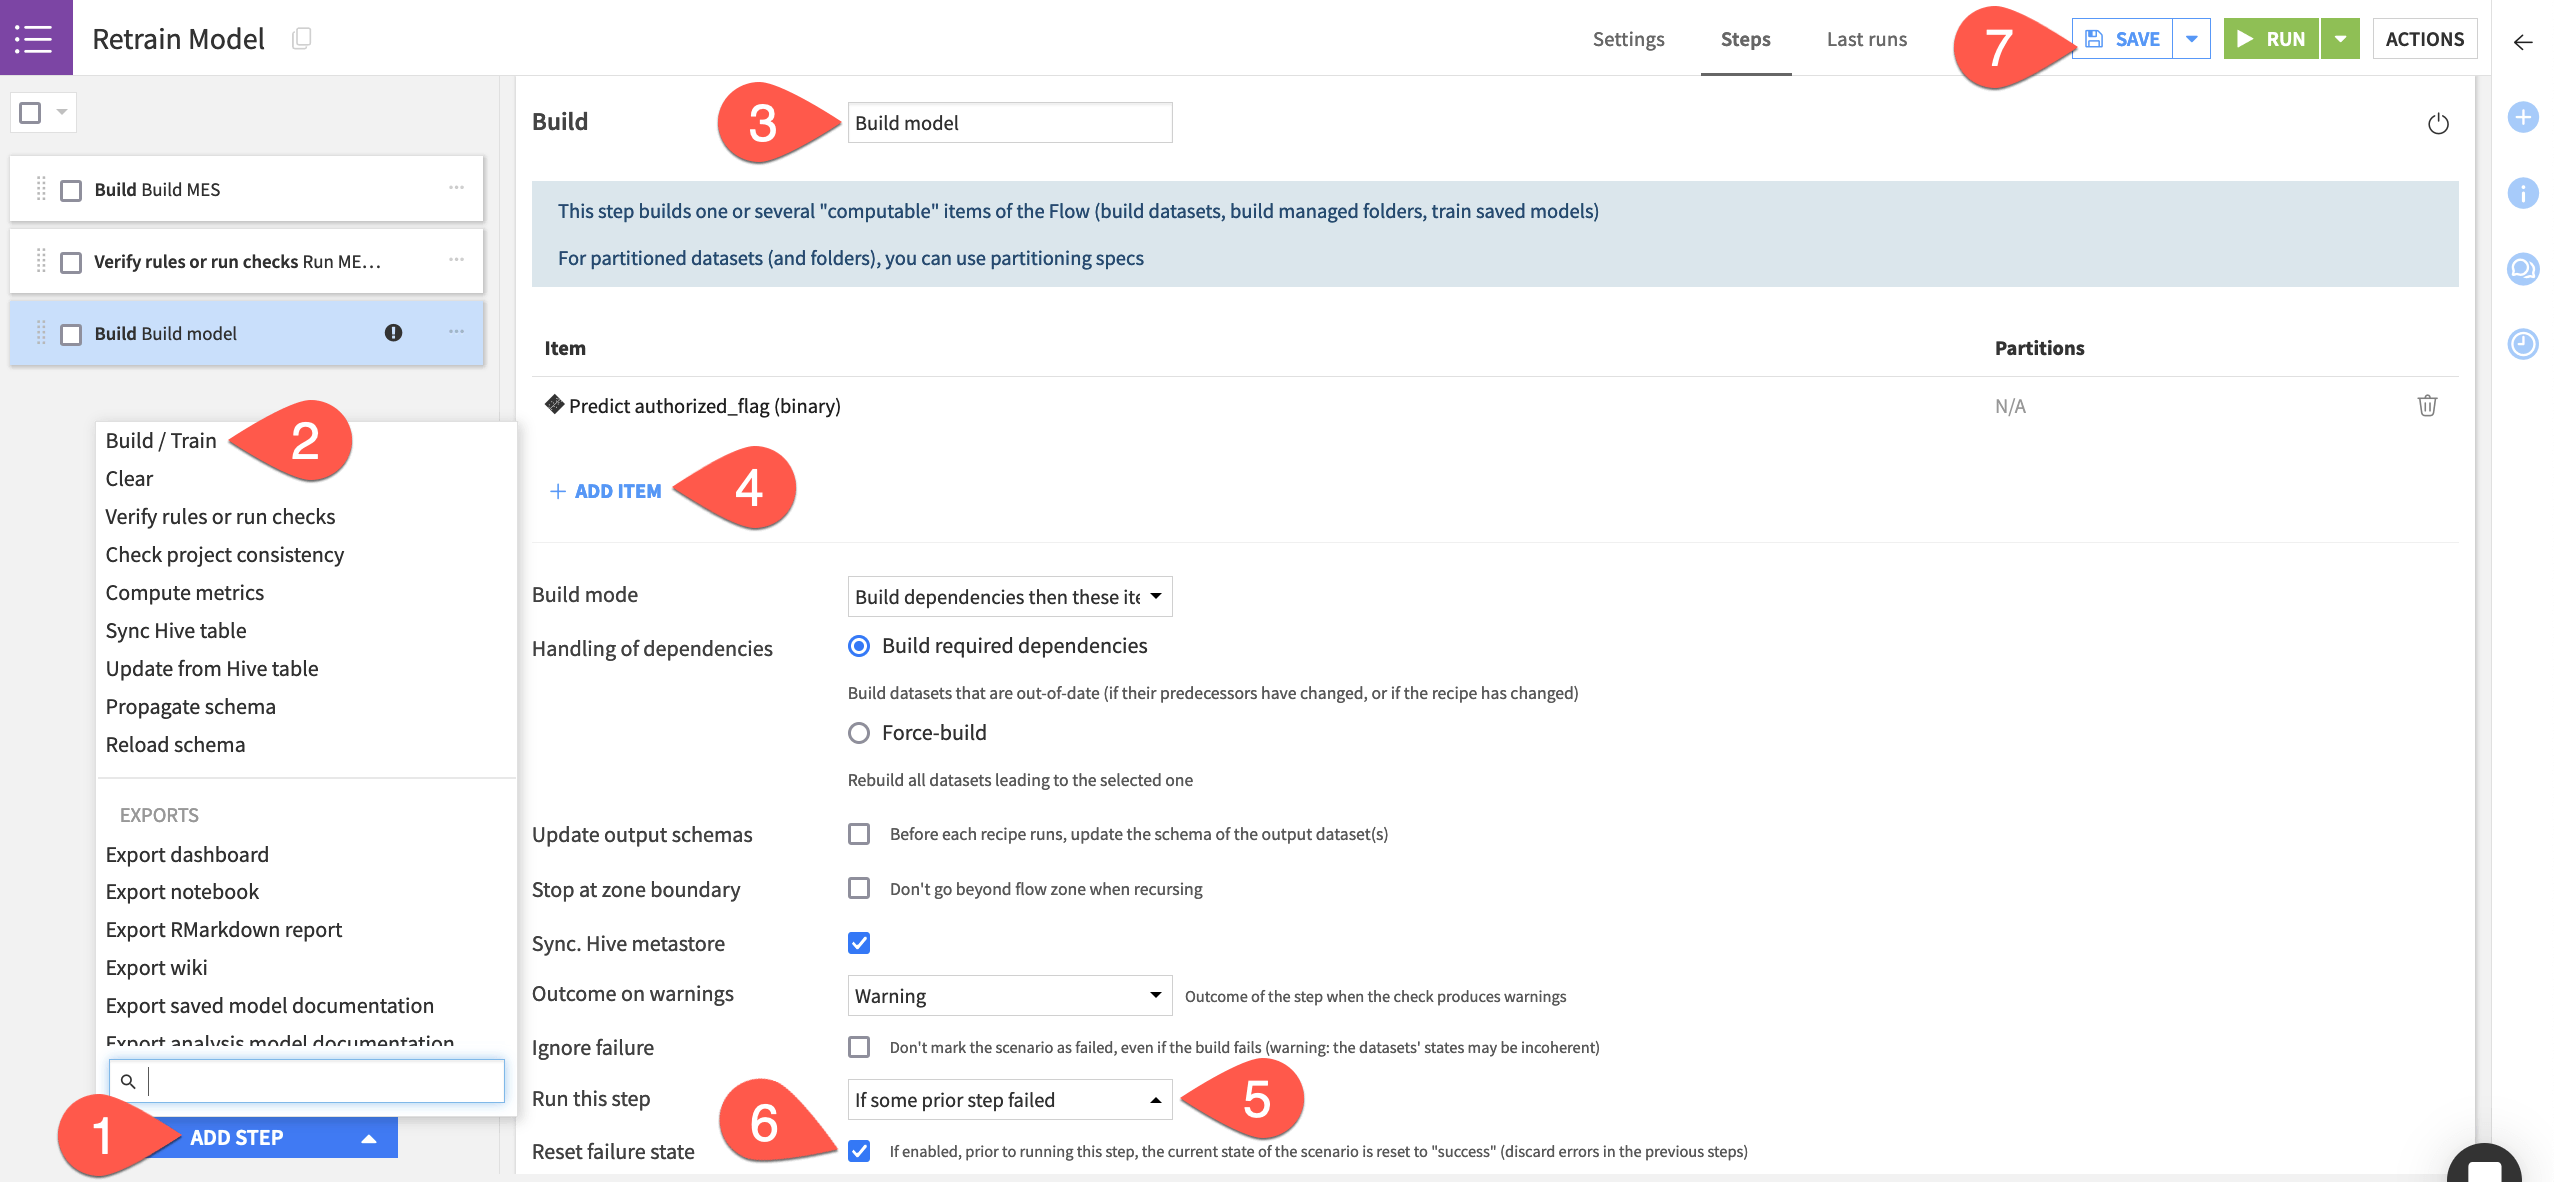
Navigate to the Steps tab of the new scenario.
Click Add Step.
Select Build / Train.
Name the step
Build MES.Click Add Item > Evaluation store > mes_for_input_drift > Add.
Next, the scenario should run the check you’ve created on the MES.
Still in the Steps tab, click Add Step.
Select Verify rules or run checks.
Name the step
Run MES checks.Click Add Item > Evaluation store > mes_for_input_drift > Add.
Finally, you need to build the model, but only in cases where the checks fail.
Click Add Step.
Select Build / Train.
Name the step
Build model.Click Add Item > Model > Predict authorized_flag (binary) > Add.
Change the Run this step setting to If some prior step failed (that step being the Run checks step).
Check the box to Reset failure state.
Click Save when finished.
Tip
For this demonstration, you’ll trigger the scenario manually. In real cases, you’d create a trigger and a reporter. Try these features out in Tutorial | Automation scenarios and Tutorial | Scenario reporters.
Run the scenario#
Introduce another month of data to the pipeline, and then run the scenario.
In the Model Scoring Flow zone, return to the new_transactions dataset.
On the Settings tab, switch the file to the next month as done previously.
Return to the Retrain Model scenario.
Click Run to manually trigger the scenario.
Go to the Last Runs tab to observe its progression.
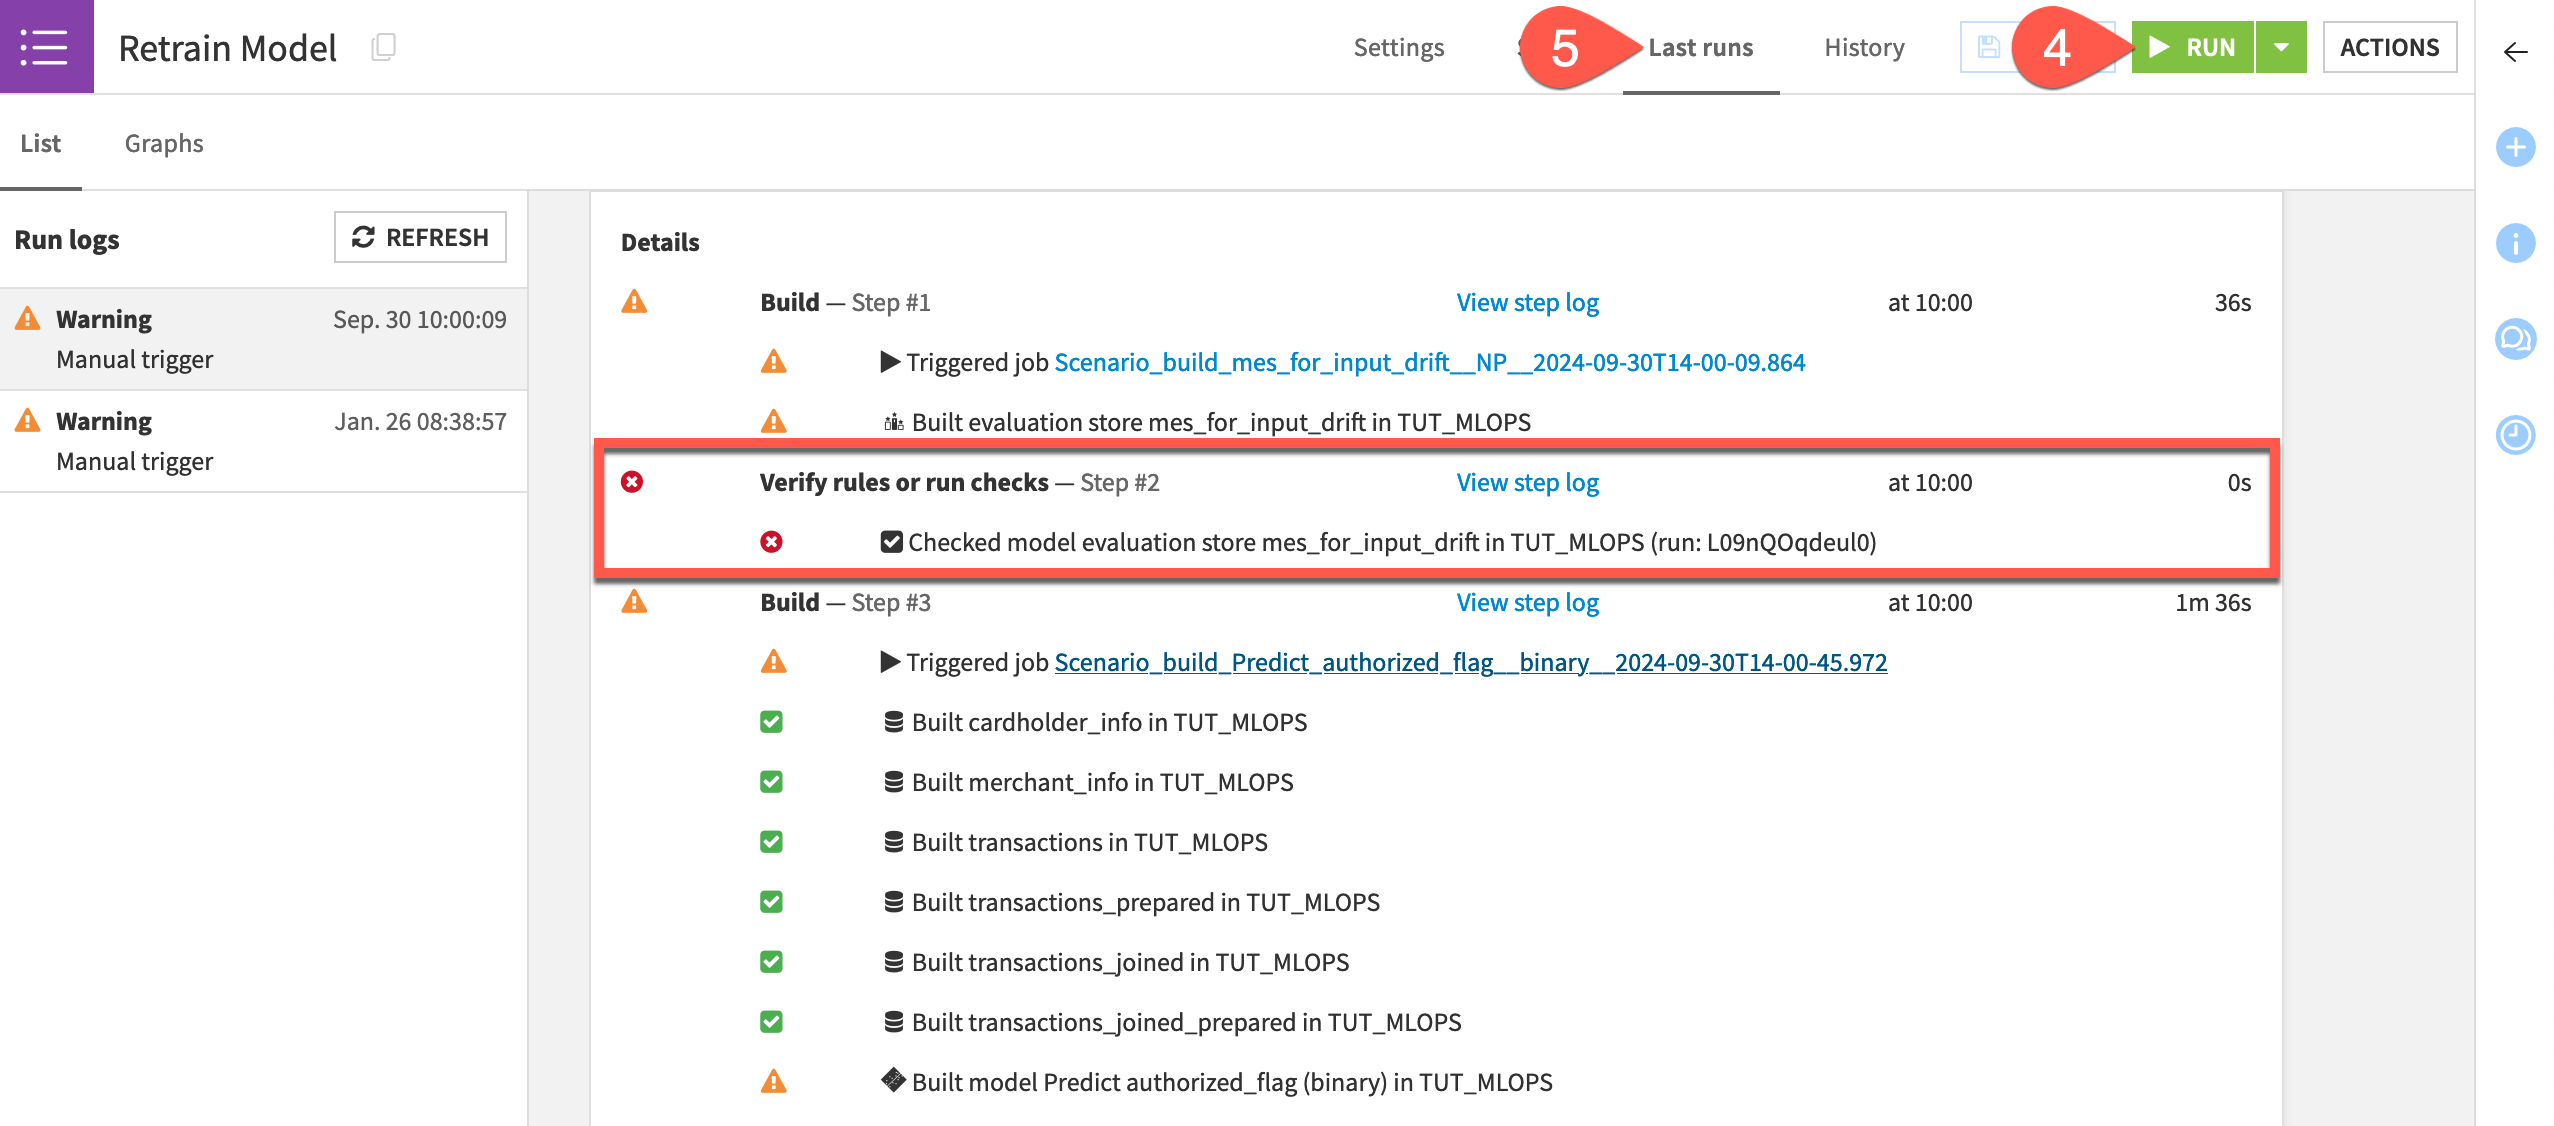
Assuming your MES check failed as intended, open the saved model in the Flow to see a new active version!
Note
This goal of this tutorial is to cover the foundations of model monitoring. But you can also think about how this specific scenario would fail to meet real world requirements.
For one, it retrained the model on the original data!
Secondly, model monitoring is a production task, and so you should move this kind of scenario to the Automation node.
Create additional model monitoring assets#
Once you have your model monitoring setup in place, you can start building informative assets on top of it to bring more users into the model monitoring arena.
Create a model monitoring dashboard#
Initially the visualizations inside the MES may be sufficient. However, you may soon want to embed these metrics inside a dashboard to share results with collaborators in an easier way.
From the Dashboards (
) page (
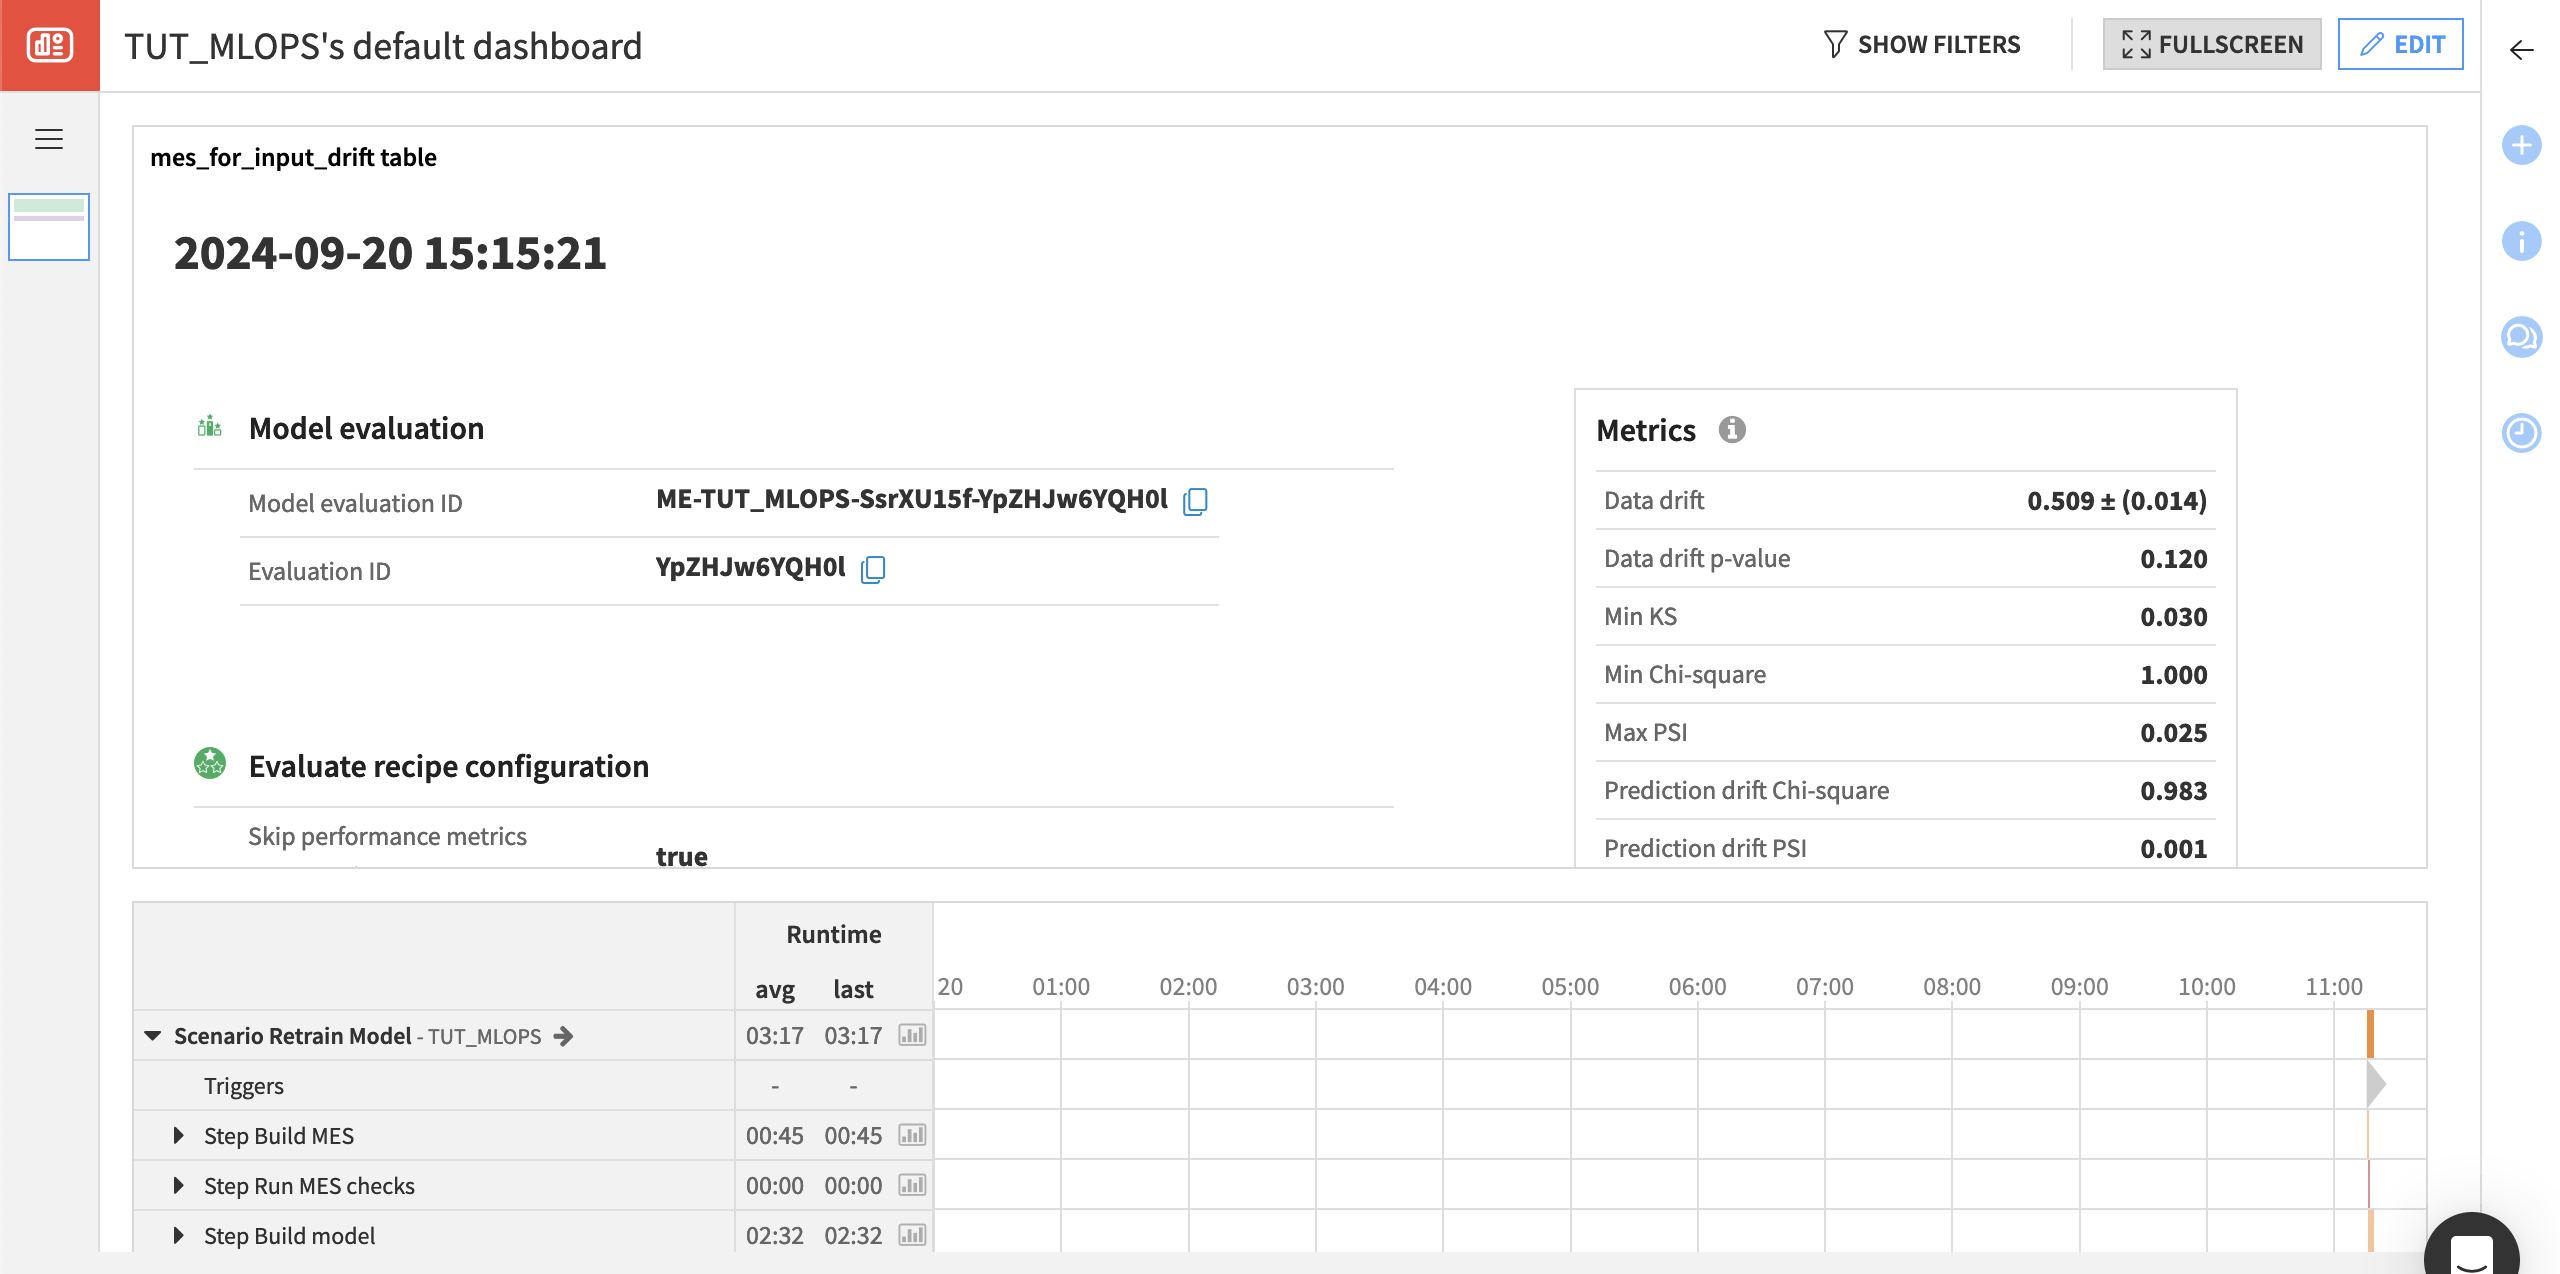
g+p), open the project’s default dashboard.Click Edit.
Click + New Tile to add the first tile.
In the dialog, choose Model evaluation report.
Select mes_for_input_drift as the source store, and click Add.
Drag the corners of the insight so it occupies the full width of the page.
In the tile settings, open the dropdown under Model evaluation report options to choose to display a summary or a specific aspect of the report.
Although you could add much more detail, add just one more tile.
Click + New Tile.
Choose Scenario.
With the Last runs option selected, select Retrain Model as the source scenario, and click Add.
Drag the corner of the insight to increase the height.
In the tile settings, explore the different displays in Scenario last runs options.
Click Save, and then View to see the foundation of a model monitoring dashboard.
Note
When your use case requires even more customization, you’ll likely want to explore building a custom webapp (which you can also embed inside a native dashboard).
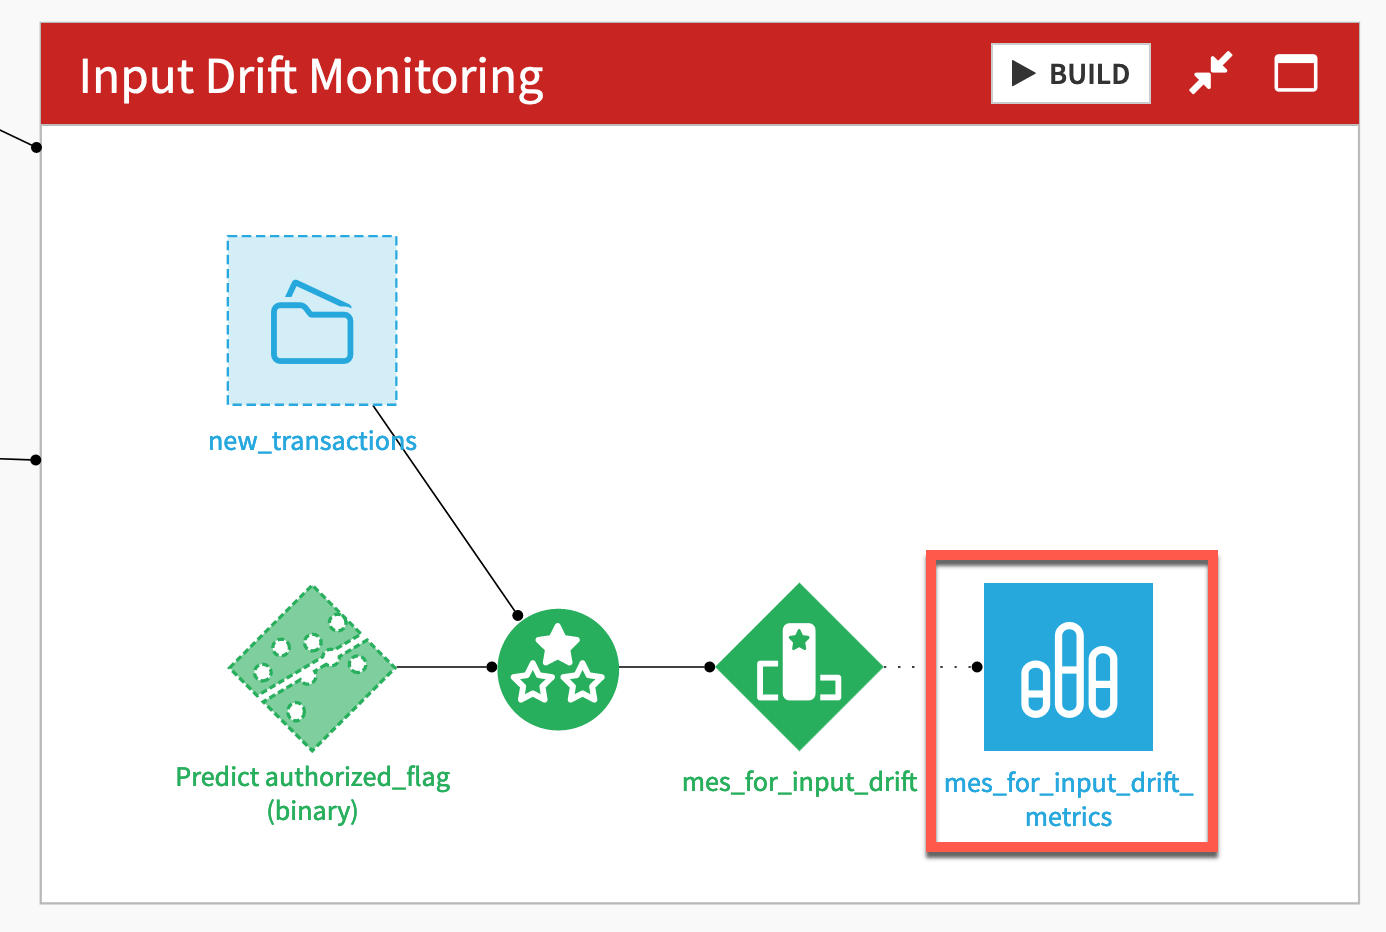
Optional: Create MES metrics datasets#
Dataiku allows for dedicated metrics datasets on objects like datasets, saved models, and managed folders. You can do the same for model evaluation stores. These datasets can be particularly useful for feeding into charts, dashboards, and webapps.
Open either MES, and navigate to the Status tab.
Click the gear (
) icon, and select Create dataset from metrics data.
If not already present, move the MES metrics dataset to its respective Flow zone.
Next steps#
Congratulations! You have achieved a great deal in this tutorial! Most importantly, you:
Created pipelines to monitor a model in situations where you do and don’t have access to ground truth data.
Used input drift, prediction drift, and performance drift to evaluate model degradation.
Designed a scenario to automate periodic model retraining based on the value of a MES metric.
Gave stakeholders visibility into this process with a basic dashboard.
Now you have pipelines to monitor the model, but they remain only on the Design node. For a real use case, you’d need to deploy this project into production using either a batch or real-time API framework.
Once you have this kind of project in production, see Tutorial | API endpoint monitoring to centralize API node logs and monitor endpoint responses.
Tip
Although not discussed here, this project also includes data quality rules on the transactions_joined_prepared dataset (type g + q to see them). In addition to model monitoring, data monitoring is a key aspect of an MLOps strategy!

