
Concept | Monitoring and feedback in the AI project lifecycle#
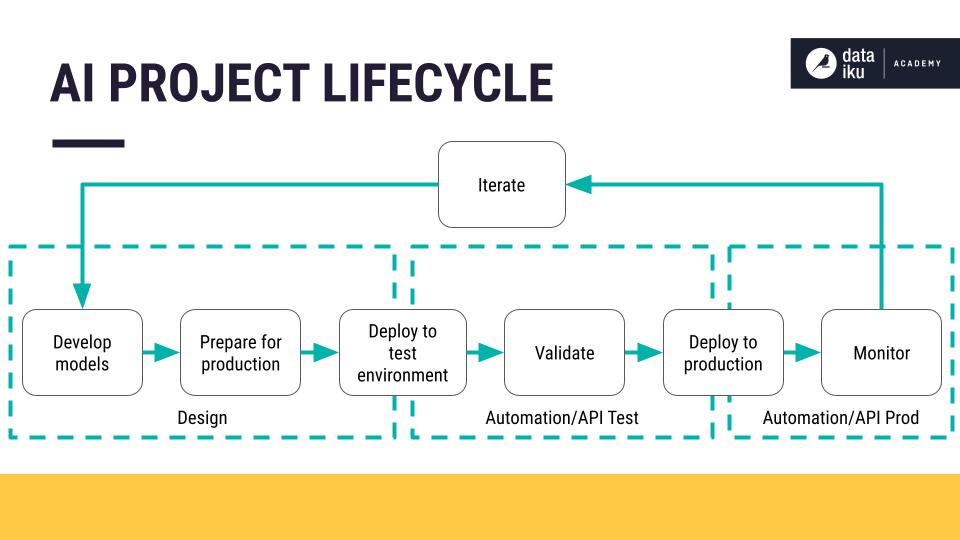
Developing an ML pipeline often takes an iterative approach. You connect to, explore, and prepare data. You train and evaluate models. You test candidate models in a simulated production environment. Finally, you deploy a model to production. Perhaps it has taken months to get to this point.
What happens the moment you or your colleagues deploy a model? The data in production can be different from the model’s training data, and so the models begin to decay. How do you ensure models continue to perform at their best? By incorporating a monitoring system that supports the iteration and improvement of models.
To iterate on models, you need a monitoring system that provides feedback. The goal of monitoring is to draw attention to issues (hopefully with enough time to act before a problem occurs).
This article discusses one of the more challenging, but crucial aspects of the AI project lifecycle — the monitoring and feedback loop.
Components of a monitoring and feedback loop#
All effective machine learning projects implement a form of feedback loop. This is where information from the production environment filters back to the model prototyping environment for iteration and improvement.
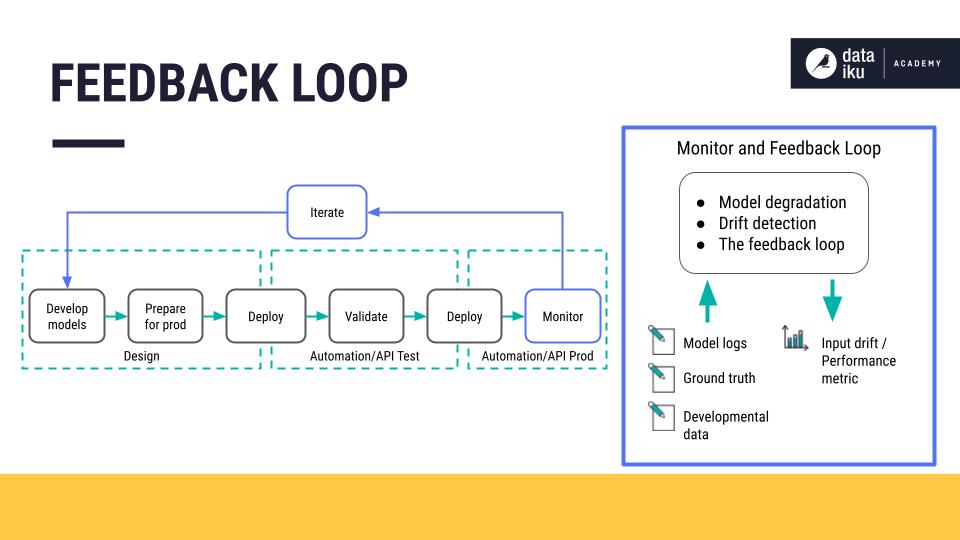
With Dataiku, that feedback loop consists of three main components:
A model evaluation store that does versioning and evaluation between different model versions.
An online system that performs model comparisons in the production environment, with a shadow scoring (champion/challenger) setup or with A/B testing.
A logging system that collects data from production servers.
Let’s look at each of these components in more detail.
Model evaluation stores#
After reviewing information from a logging system, you may decide that model performance has degraded, and you want to retrain the model.
Formally, a model evaluation store serves as a structure that centralizes the data needed to take several trained candidate models and compare them with the deployed model. Each model and each model version needs to be accessible. This structure, or group of models, is referred to as the logical model.
In addition, once you have a model evaluation store with comparison data, you can track model performance over time.
Each logged version of the logical model must come with all the essential information concerning its training phase, including:
The list of features used
The preprocessing techniques applied to each feature
The algorithm used, along with the chosen hyperparameters
The training dataset
The test dataset used to evaluate the trained model (this is necessary for the version comparison phase)
Evaluation metrics comparing the performance between different versions of a logical model
You can then store the evaluation metrics in the model evaluation store. There, you can begin to identify top model candidates.
Note
See Concept | Model evaluation stores to learn more.
Online evaluation#
Once you’ve identified that a candidate model is outperforming the deployed model, there are at least two ways you could proceed. You could update the model in the production environment or move to an online evaluation.
A discrepancy often exists between the performance of a model in development (also known as offline) and a model in production (also known as online). Evaluating the model online would give the most truthful feedback about the behavior of a candidate model when it’s fed real data.
There are two main modes of online evaluation:
Champion/challenger |
Otherwise known as shadow testing, the candidate model shadows the deployed model and scores the same live requests. |
A/B testing |
The candidate model scores a portion of the live requests and the deployed model scores the others |
Champion/challenger#
The champion/challenger mode involves deploying one or more additional models (the challengers) to the production environment. These models receive and score the same incoming requests as the active model (the champion). However, the challenger models don’t return any response or prediction to the system. That’s still the job of the champion model.
The challenger predictions are simply logged for further analysis. That’s why this method is also called shadow testing or dark launch.
This setup allows for verification that the performance of the challenger model is better than the active model in the production environment.
How long should you deploy challenger models before it’s clear that a challenger model is better than the active model? There is no definitive answer. However, once both versions have scored enough requests, you can compare the results statistically.
A/B testing#
In A/B testing, you deploy the candidate model to the production environment (along with the active model). However, you split the input requests between the two models. Each request is processed randomly by one or the other model — not both. You log results from the two models for analysis. Drawing statistically meaningful conclusions from an A/B test requires careful planning of the test.
For ML models, you should use it only when champion/challenger isn’t possible. This might happen when:
You can’t evaluate the ground truth for both models.
The objective to optimize is only indirectly related to the performance of the prediction (for example, a business metric is more important than a statistical one).
Note
See Tutorial | Deploy an API service to a production environment to learn how to implement A/B testing of API endpoints with Dataiku.
Logging system#
Monitoring a live system, with or without machine learning components, means collecting and aggregating data about its states. The logging system is a timestamped event log that captures and centralizes the following information for analysis:
Model metadata to identify the model, such as the model version.
Model inputs: Values of new observations to detect data drift.
Model outputs: The model’s predictions along with the ground truth (collected later on) to give an idea of the model’s performance.
System action: The action taken by the system. For example, in the case of a system that detects credit card fraud, the system action might be to send a warning to the bank.
Model explanation: The model explanation explains which features have the most influence on the prediction. This is crucial information for some highly regulated industries such as finance. For example, you want to know if there is bias when the model makes predictions about who will pay back a loan and who won’t.
Once in place, the logging system periodically fetches data from the production environment. You can set up automated monitoring to send an alert in the event of data drift. If you receive an alert, you’ll want to evaluate the models for performance degradation. To do this, you can use a model evaluation store.
Summary#
Data powers insights, and so changing data could lead to different or inaccurate insights. When you monitor models in production using a feedback loop, you obtain crucial information for iterating on and improving your models. Incorporating the three main components of a feedback loop includes:
A model evaluation store for identifying a candidate model that outperforms a deployed model.
An online system for obtaining the most truthful feedback about the behavior of a candidate model.
A logging system that can send alerts to data drift.
Works Cited
Mark Treveil and the Dataiku team. Introducing MLOps: How to Scale Machine Learning in the Enterprise. O’Reilly, 2020.