
How-to | Use the craft binning interface in charts#
Dataiku’s craft binning interface lets you visualize, adjust, and refine how you group numeric data into buckets. You can also save these settings as reusable dimensions to streamline chart creation across datasets.
Explore the craft binning interface#
To access the craft binning interface:
Open the Charts tab of a dataset.
Drag a numerical variable on the X-axis.
Click the variable dropdown, then select Craft binning.
Choose the appropriate Binning mode.
Click Show Me to display an interactive preview of the selected binning.
Use the preview by toggling the Apply binning option to assess the distribution of your data across bins.
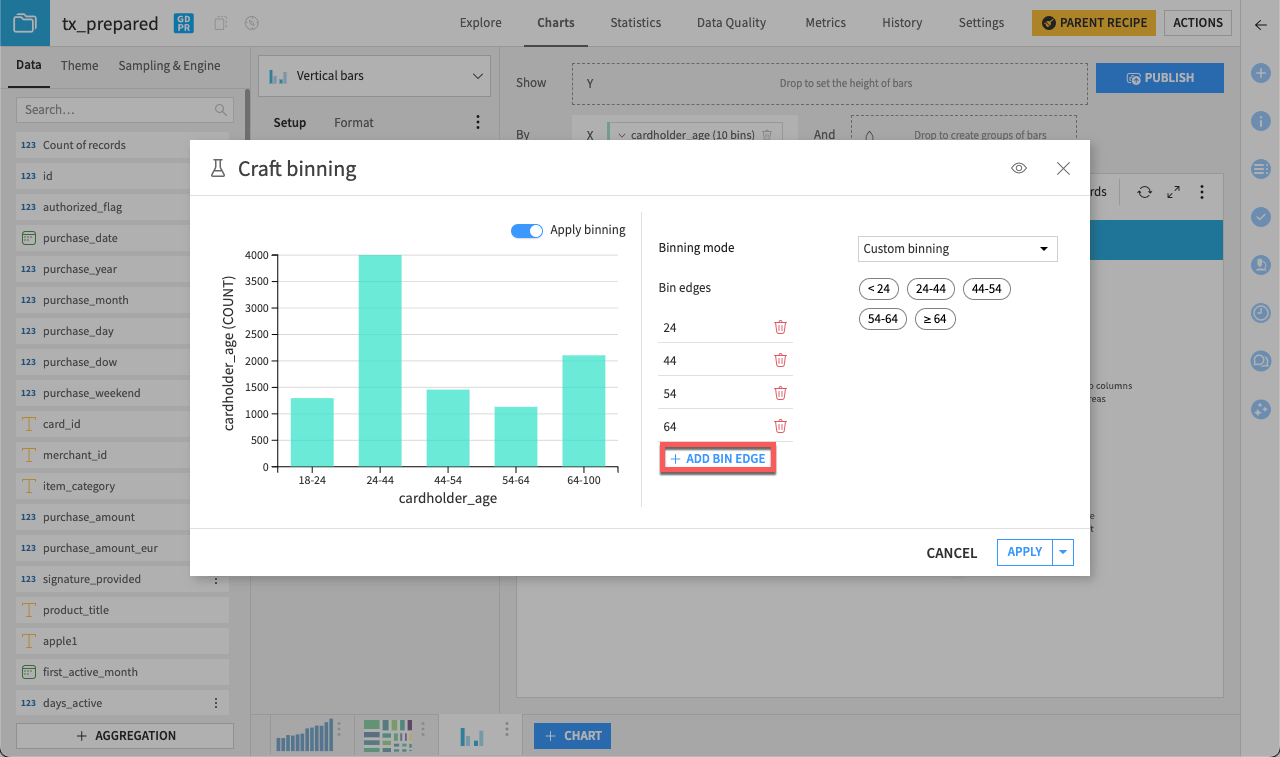
Create custom bins#
To manually define your own bins:
In the craft binning editor, select Custom binning as the Binning mode.
Click + Add Bin Edge to create bin boundaries manually.
Preview the bin edges by toggling on the Apply binning option.
Save bins as a reusable dimension#
Once your binning setup is ready, you can save it as a reusable dimension:
Click the dropdown next to the Apply button.
Click Apply as a reusable dimension.
Enter a name for your reusable dimension.
Click Create to save.
Find your saved dimension as an item underneath its parent column.
Use your saved binning configuration on any chart on the present dataset.
Reuse a saved dimension#
To reuse a saved dimension:
Open another chart.
From the variable list, drag your saved binning configuration on the X-axis.