
Concept | Charts#
Watch the video or read the summary below.

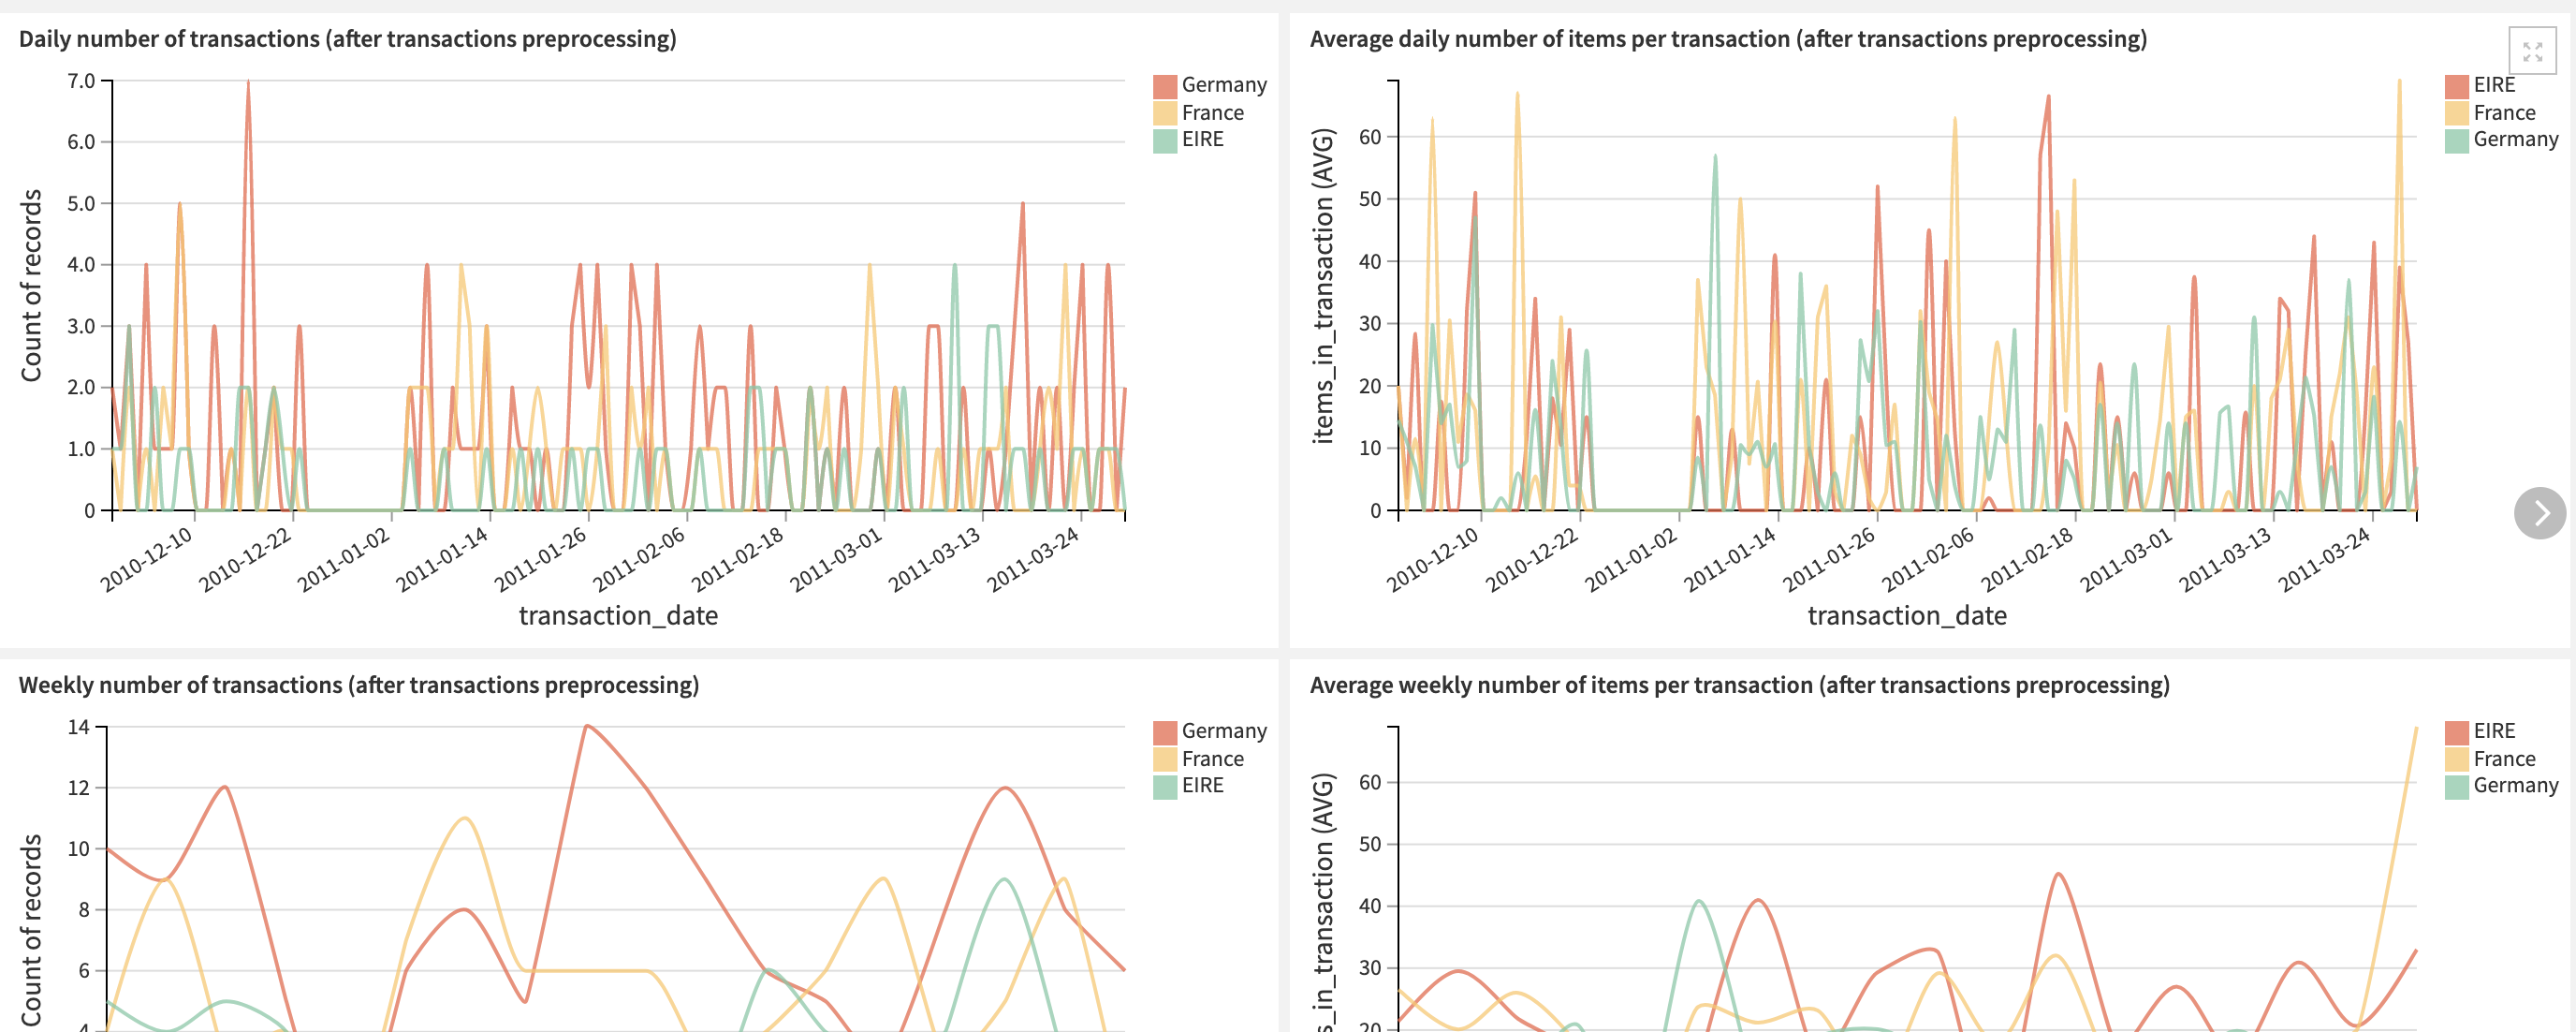
Visualization is a key tool in the data exploration and discovery process. To meet this need, the Charts tab of a Dataiku dataset houses a drag-and-drop interface for visual exploration. Many different types of charts are natively available. Bar charts, line graphs, pivot tables, and scatter plots are just a few examples.
Building a chart#
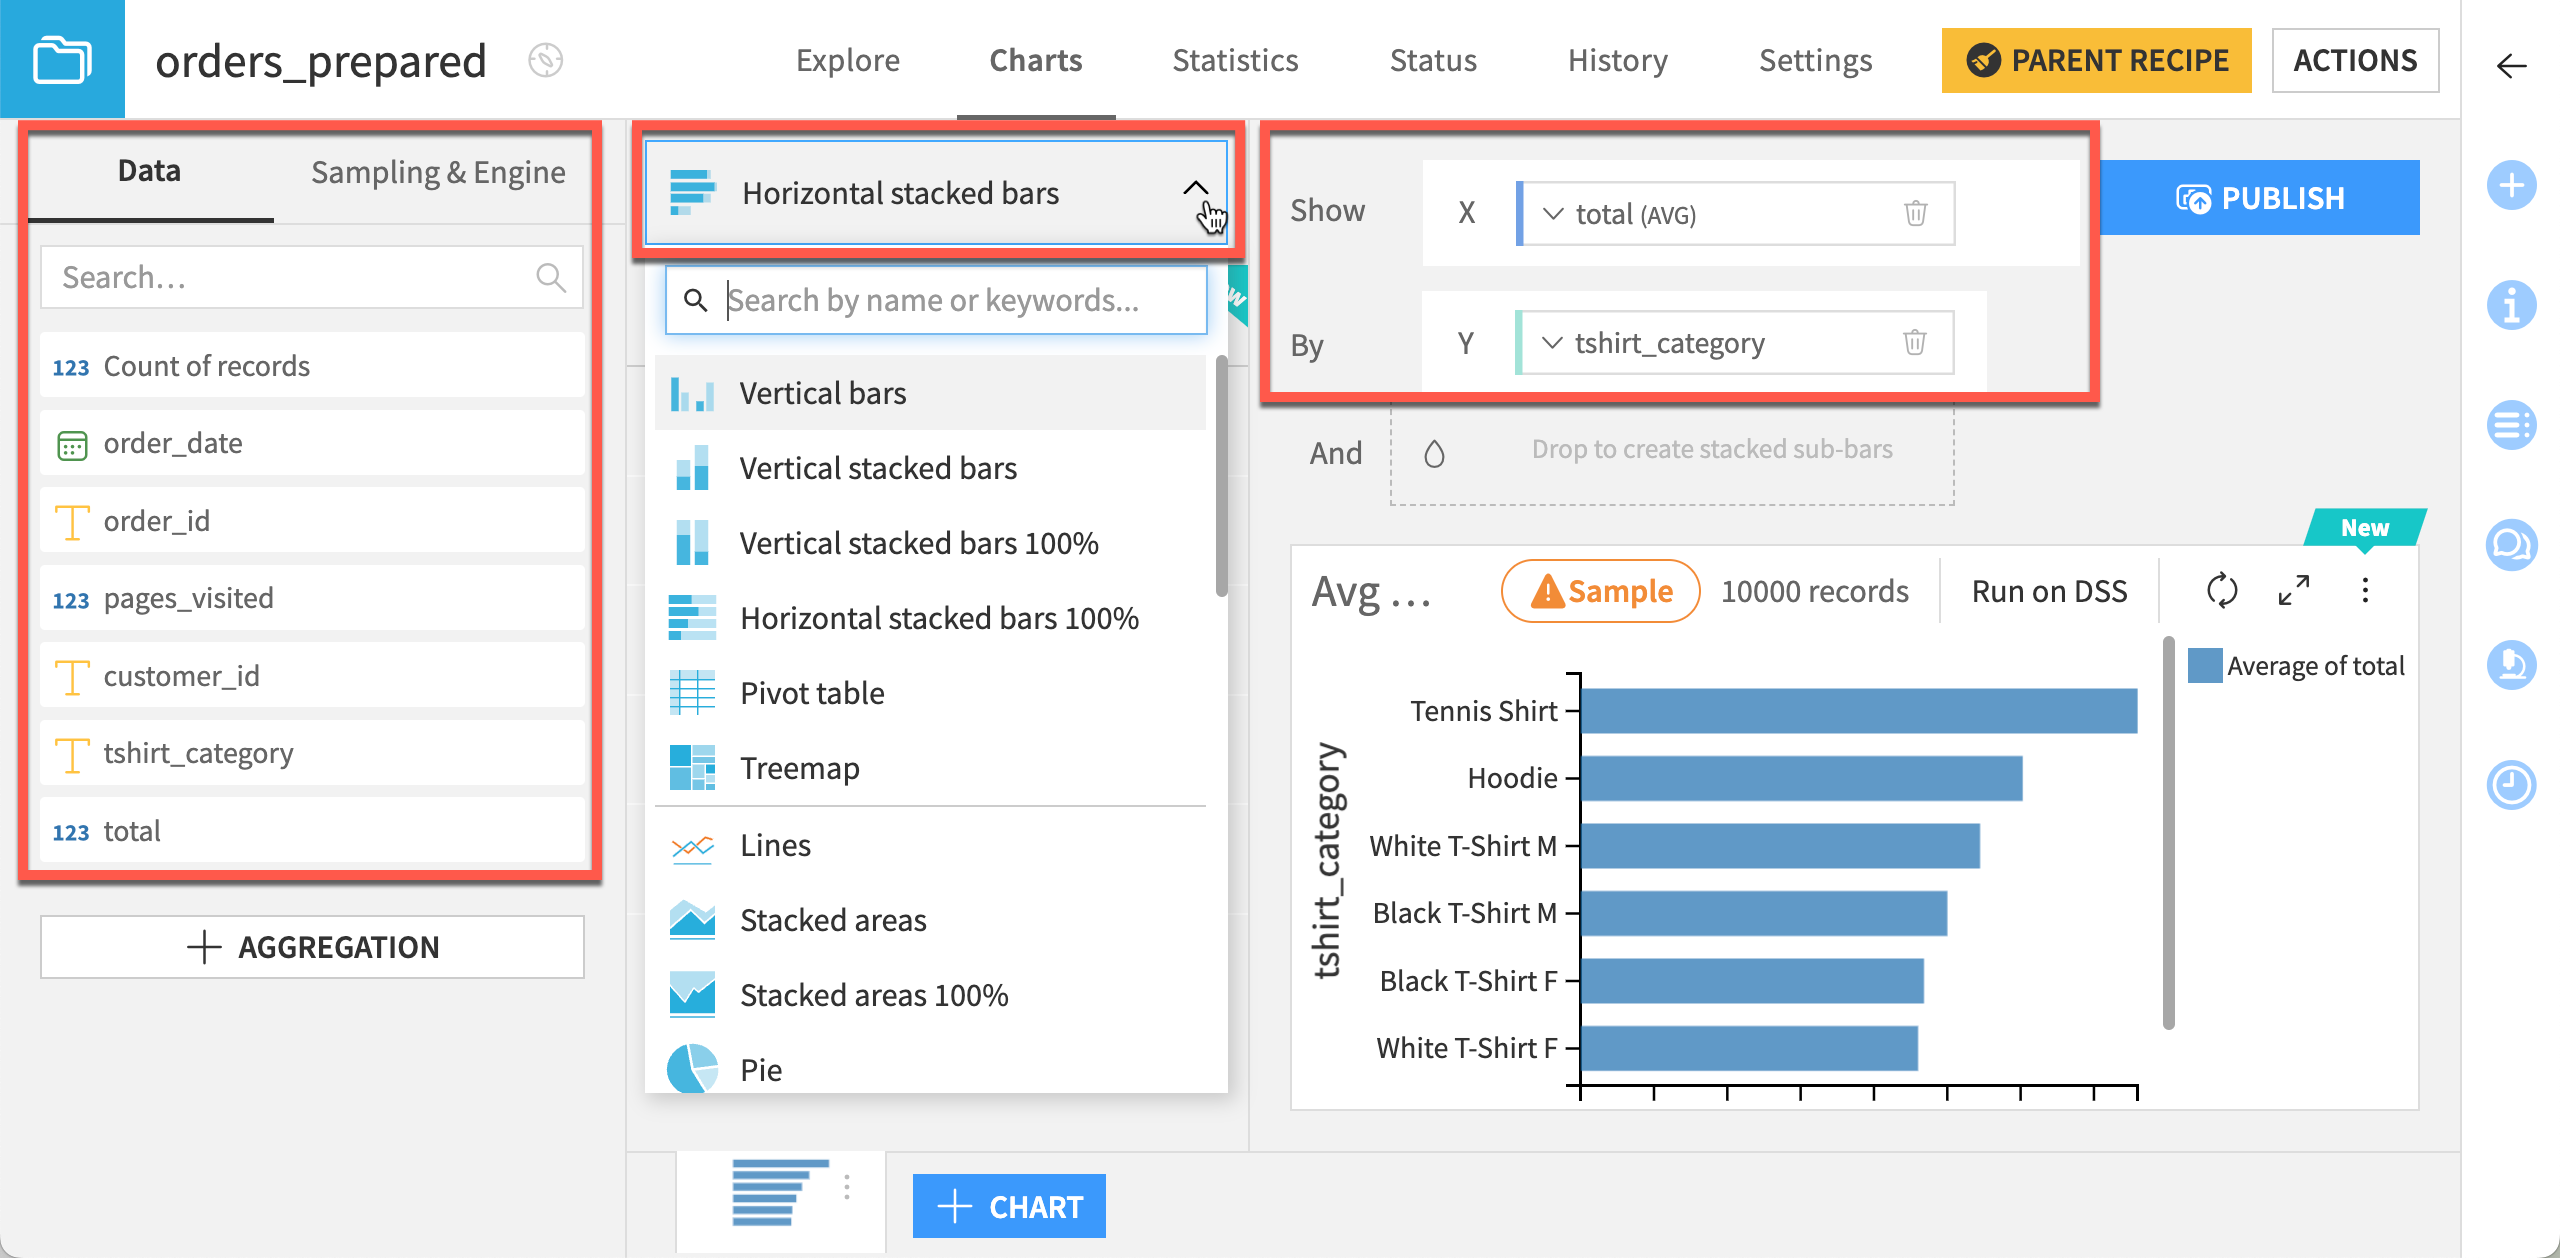
To get started, all you have to do is select a chart type, and drag variables from the Data panel on the left onto the desired axis.
Customizing a chart#
Once you’ve dragged and dropped the relevant variables to build your chart, you can customize it in many ways.
Configuring the variables#
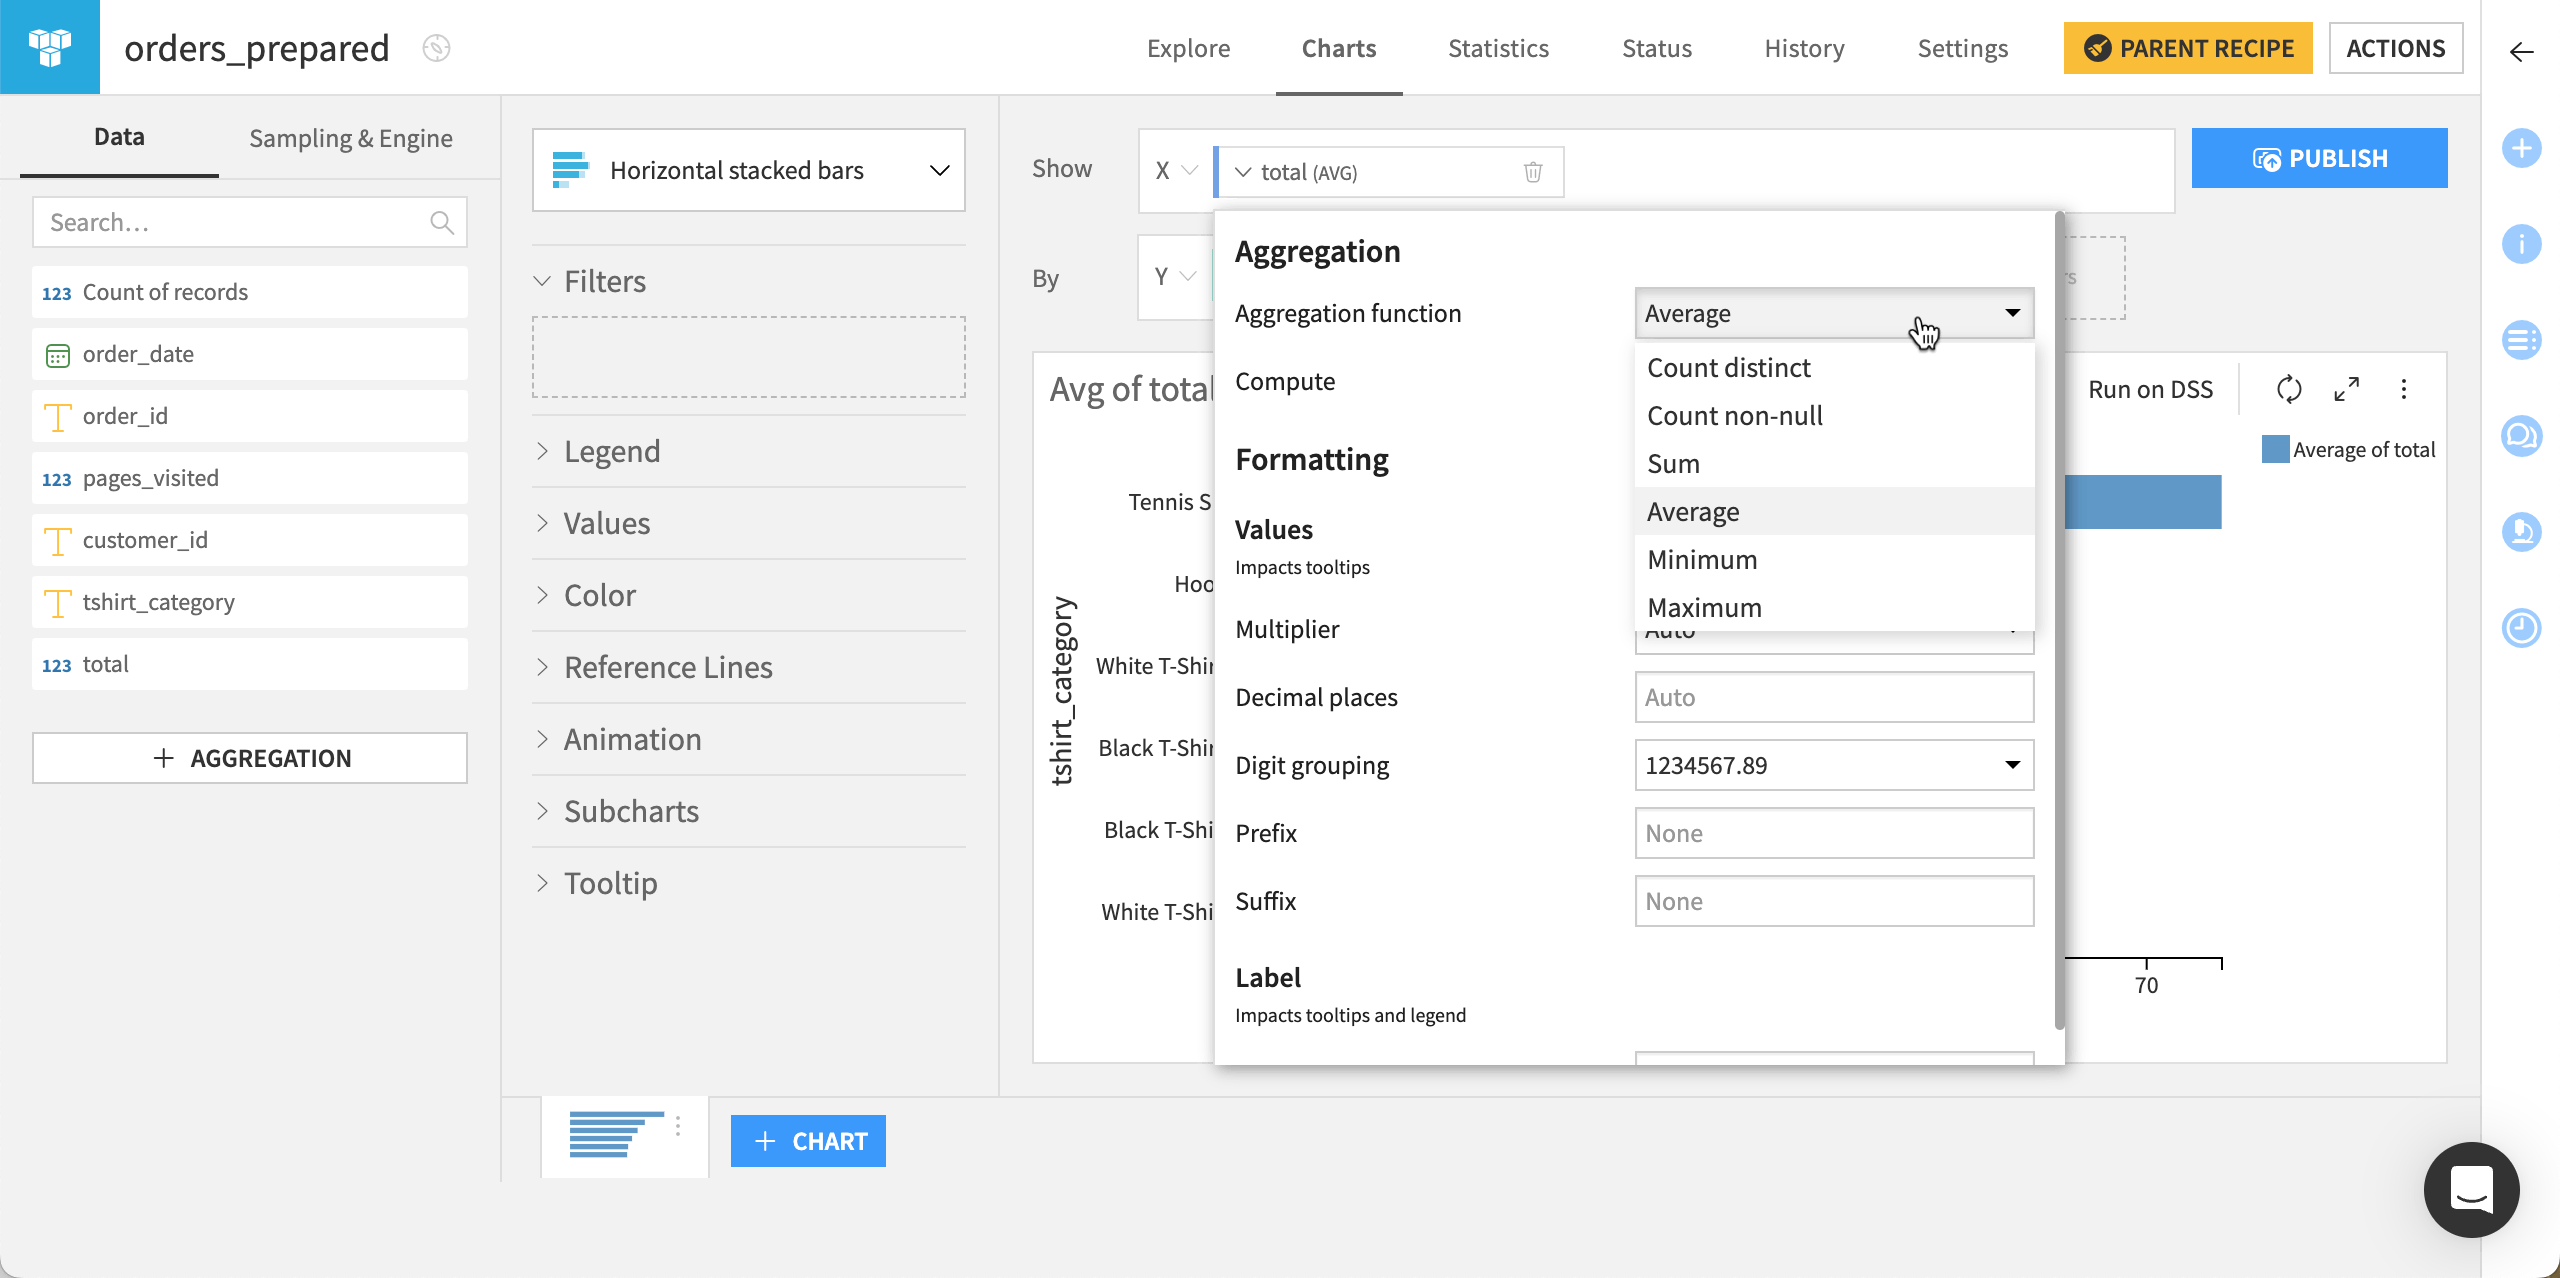
The interface lets you configure the chart variables. For example, you can:
Select the correct aggregation to display.
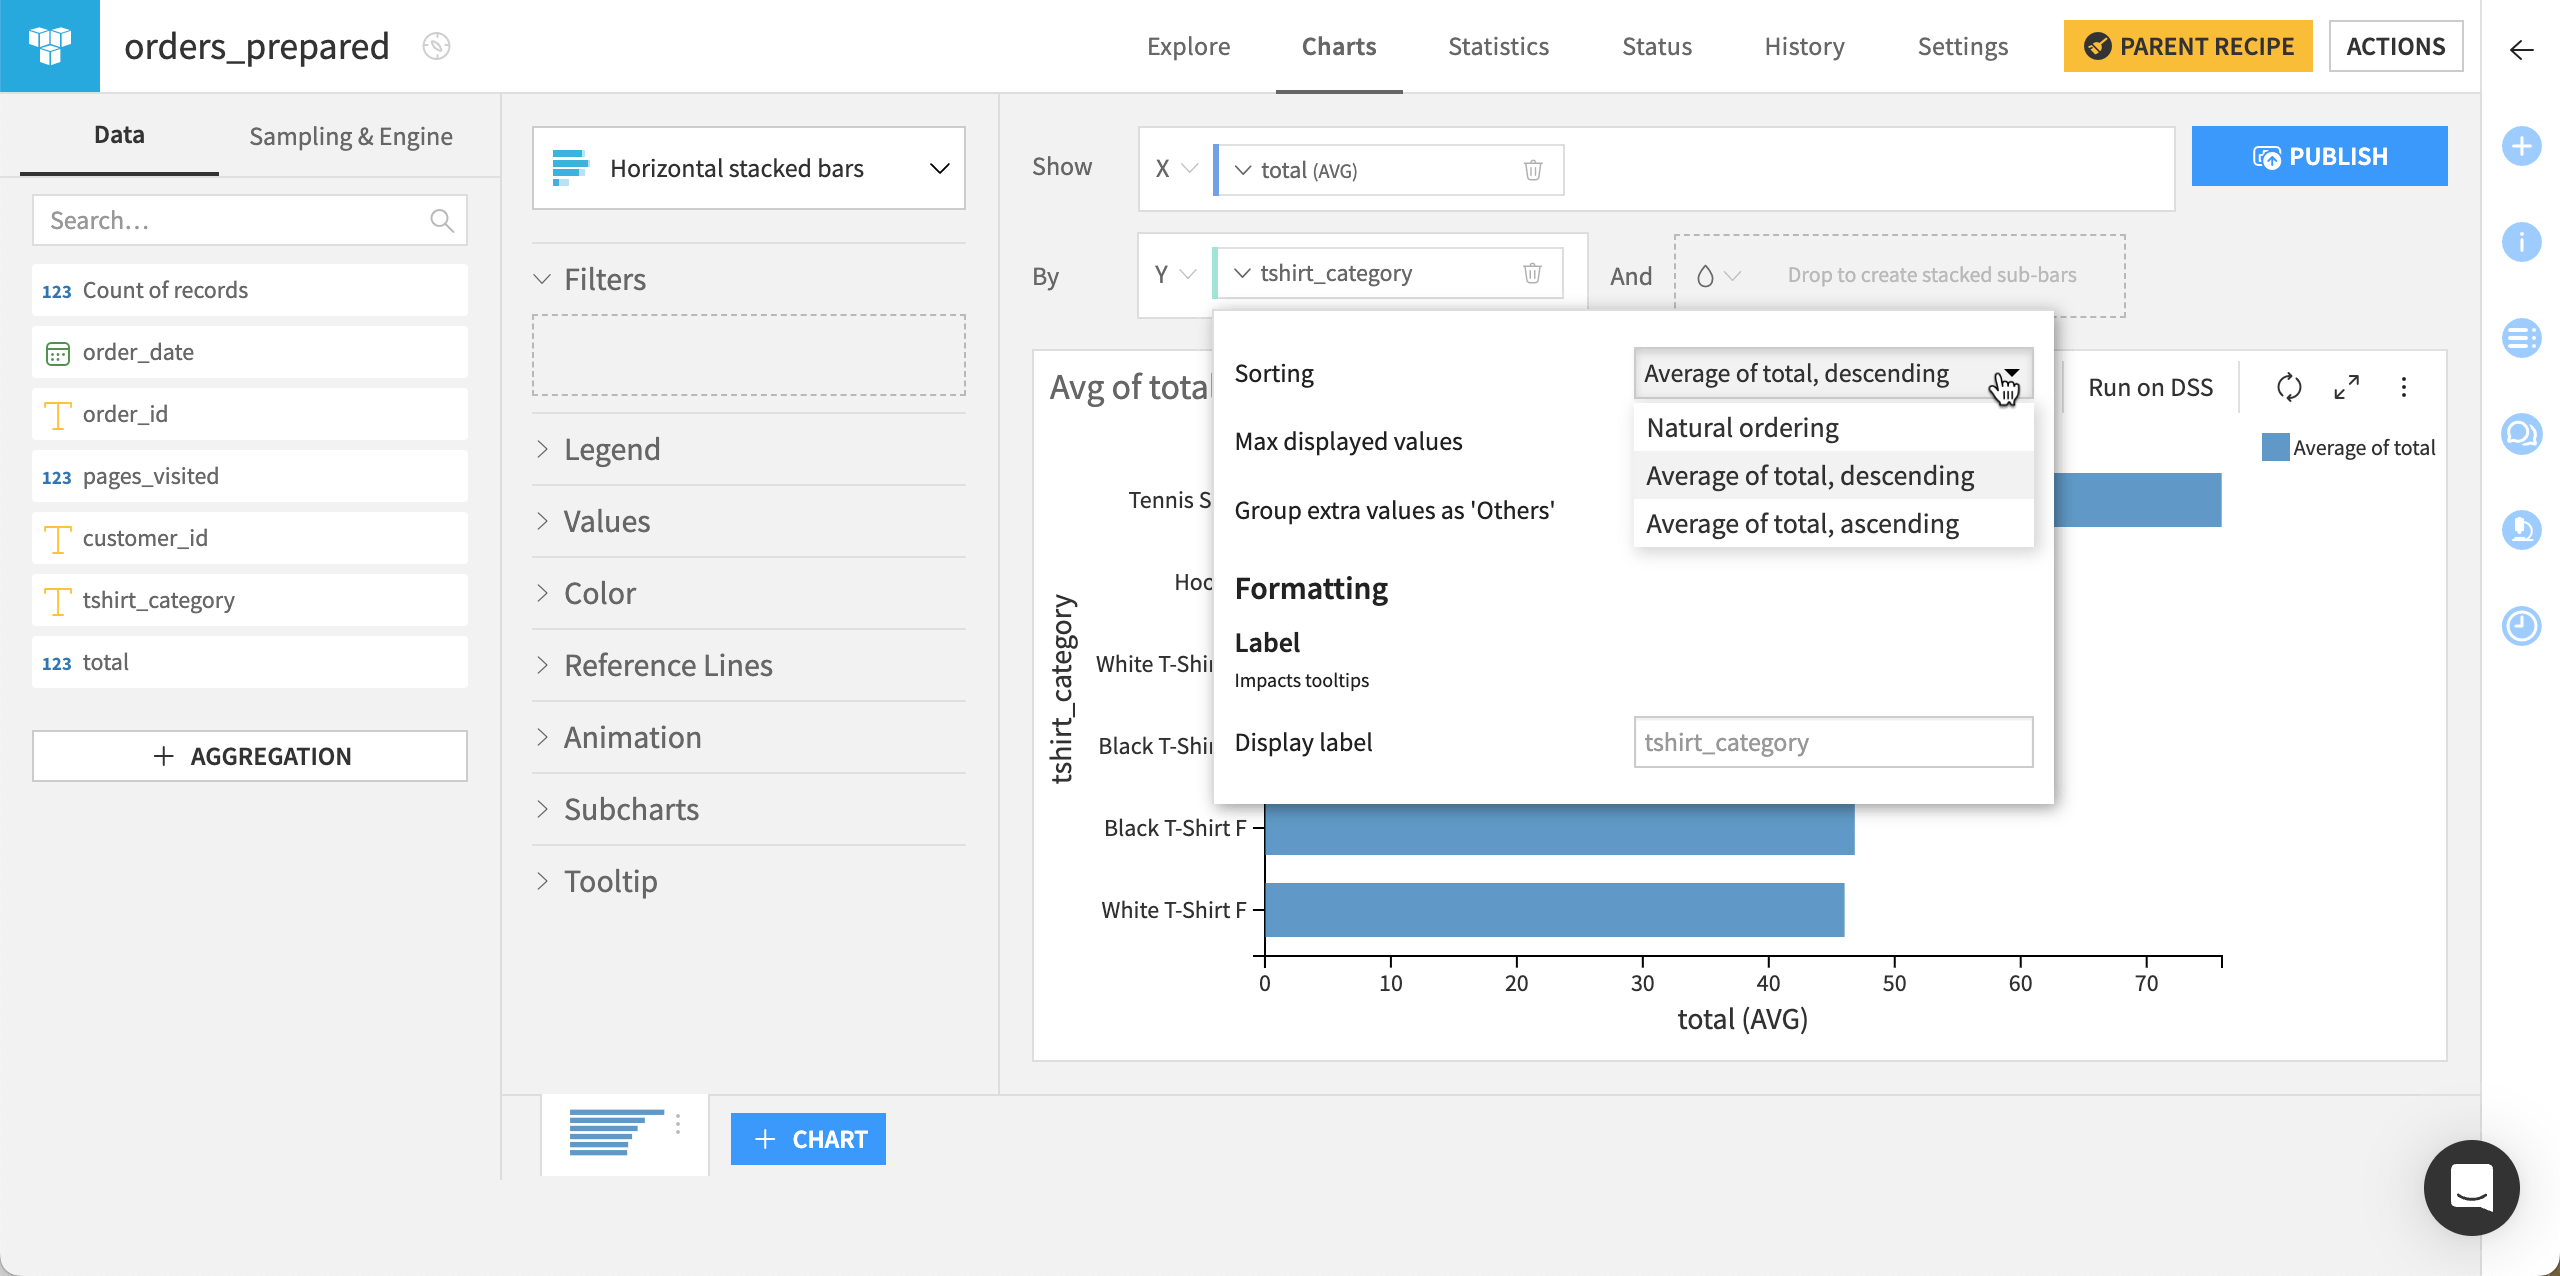
Adjust the sorting of values in the chart.
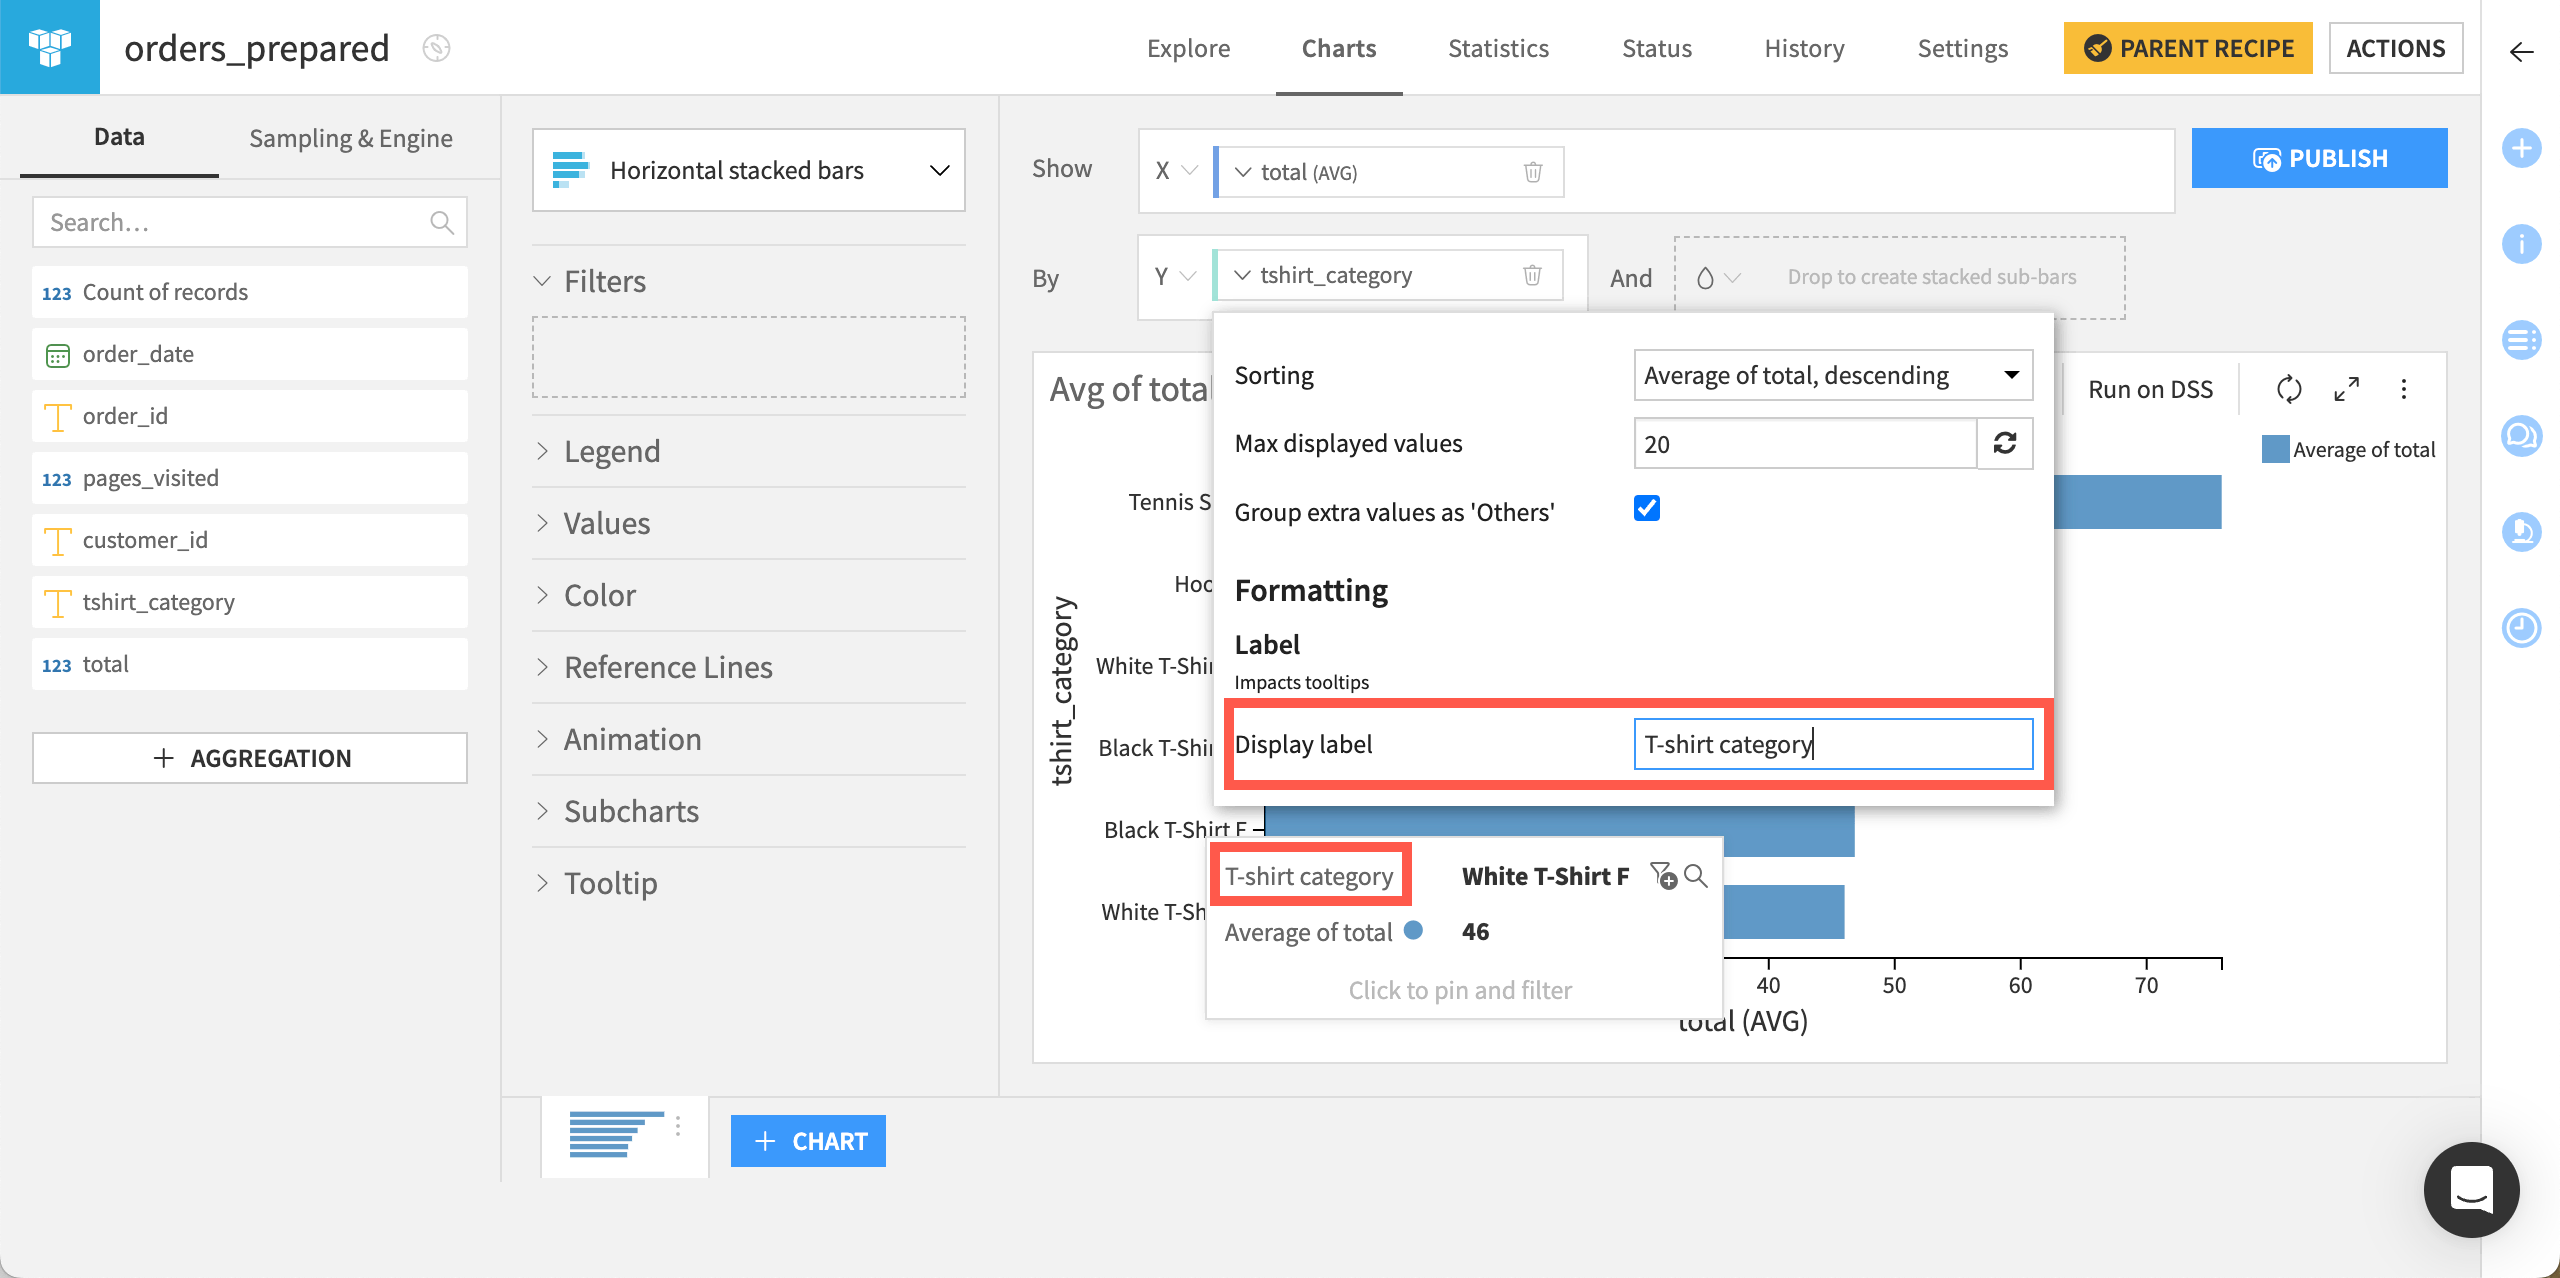
Change the value and label formatting of the variables. These changes affect the tooltips and the legend.
The Chart builder has many other features to assist in the exploration of your data. For example, with time series, you can zoom in on different periods, change the aggregated date interval, explore multiple series within the same chart, examine them side-by-side in subcharts, or create basic animations.
Filtering the data#
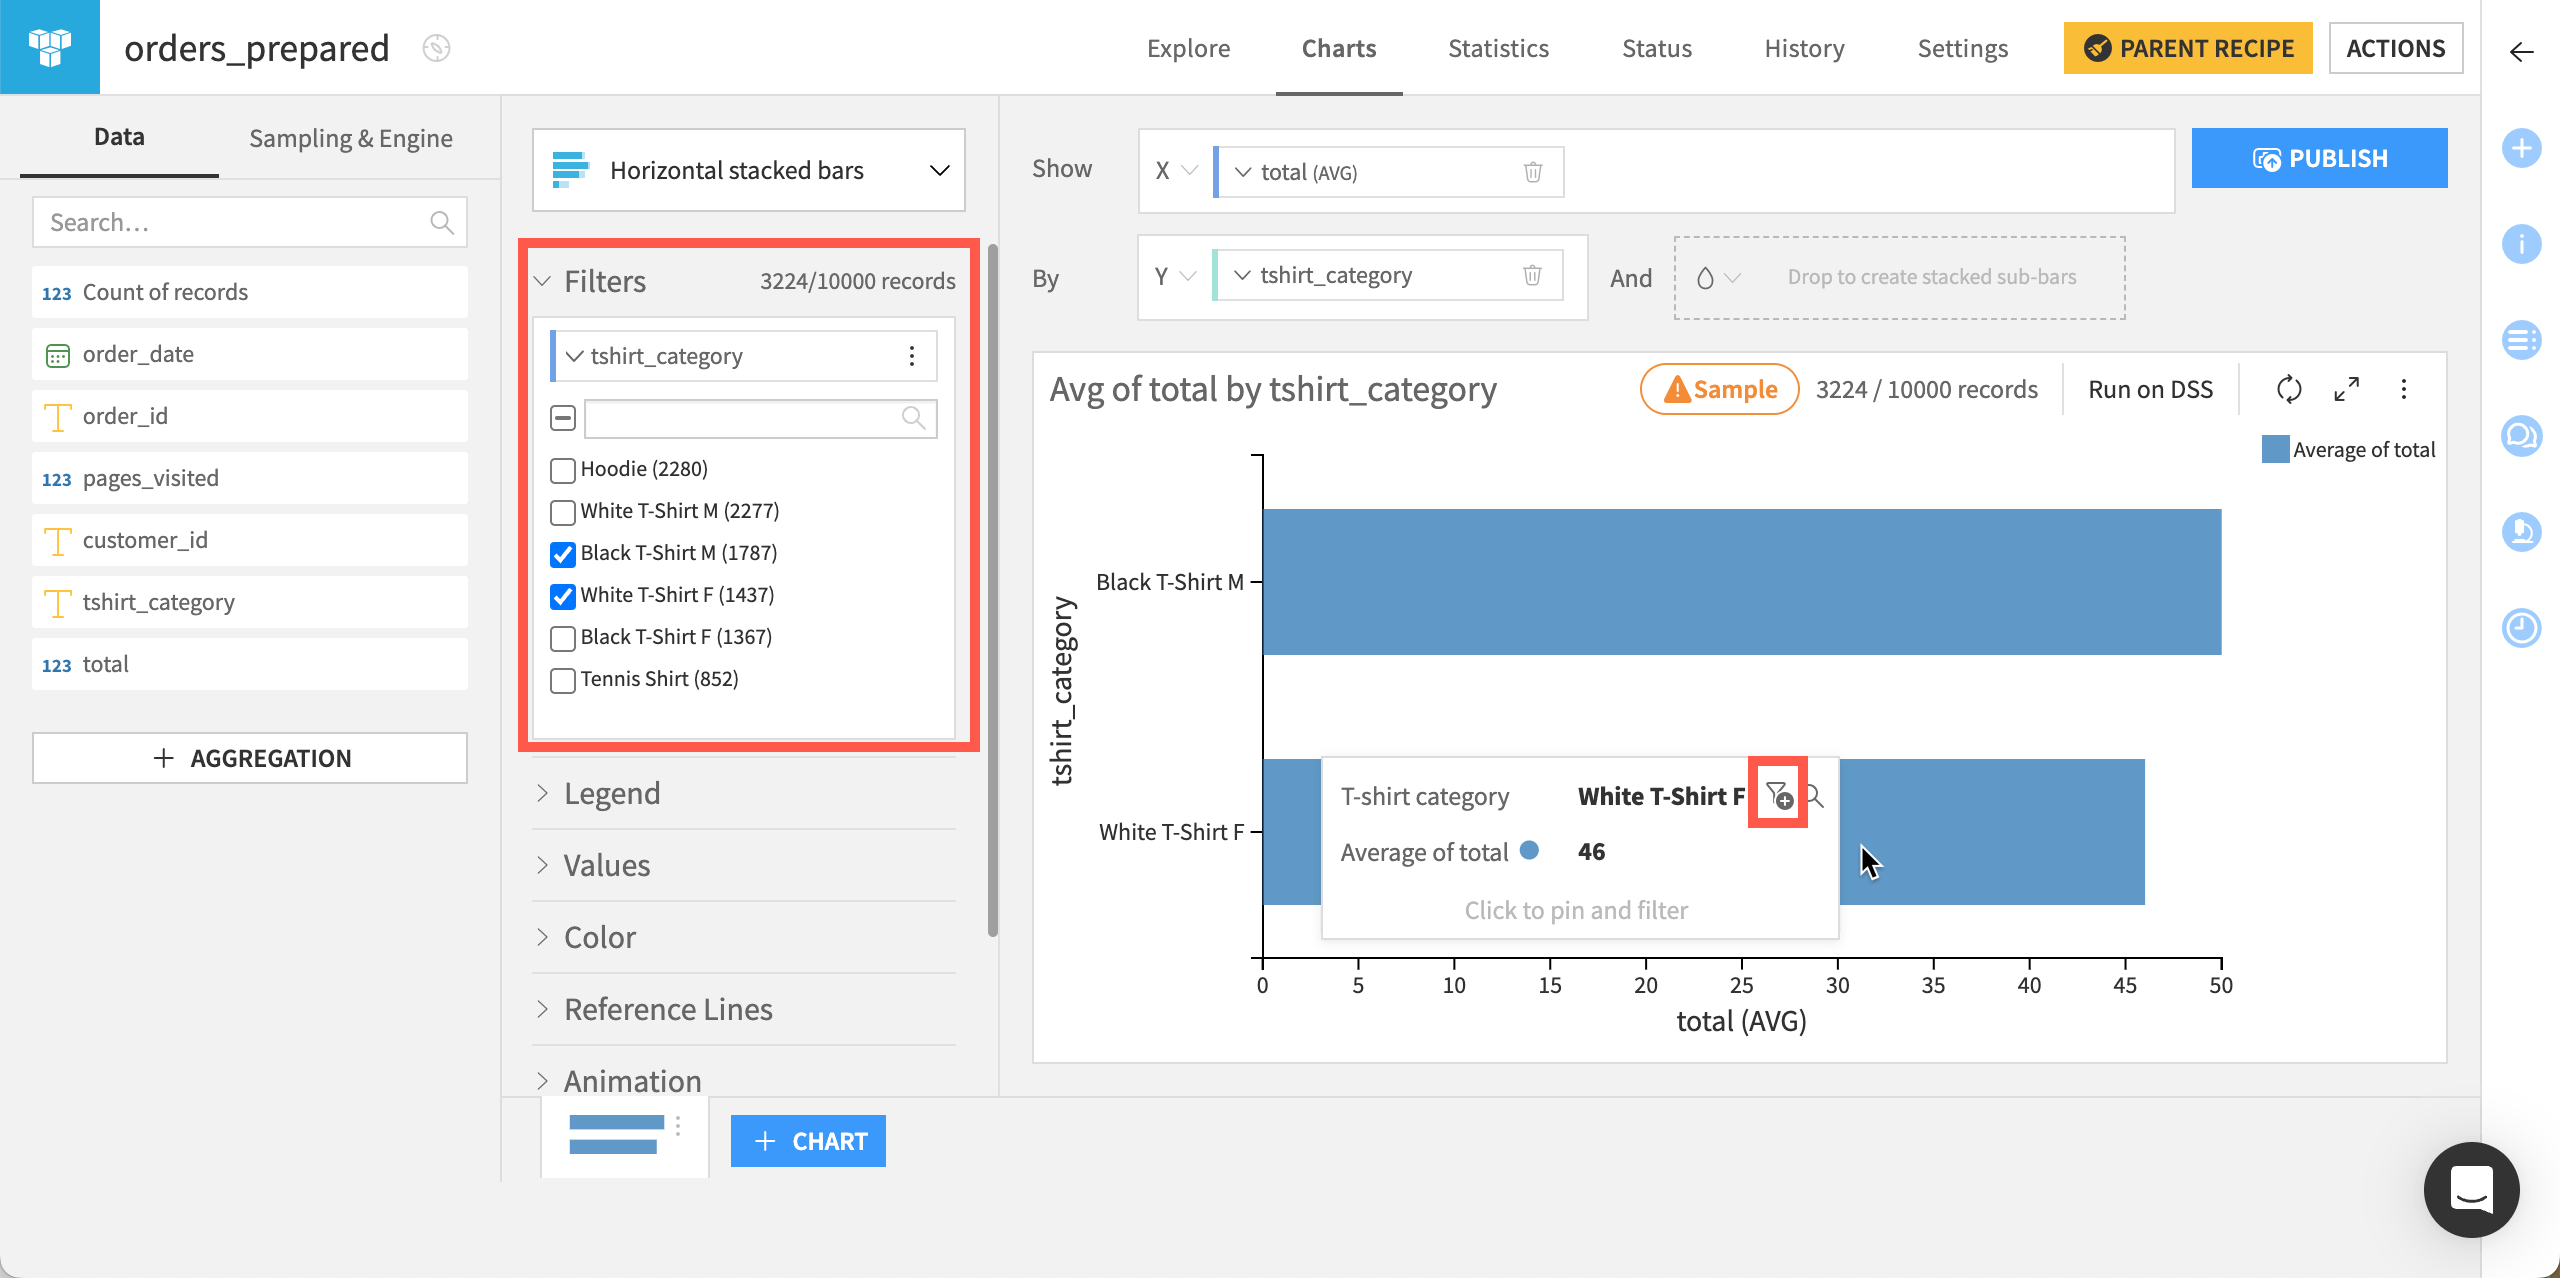
When working with large numbers of groups of categorical data, you can control the number of displayed values by selecting them for filtering. Also, to handle less-prevalent categories, you can group them into an Others bucket.
You can also drill down into a dataset by clicking the filter icon from a tooltip.
This will open the filter’s dropdown where you can apply changes.
Configuring the sampling and execution engine#
The Sampling & Engines panel on the left allows you to configure the sampling and execution engine used in charts.
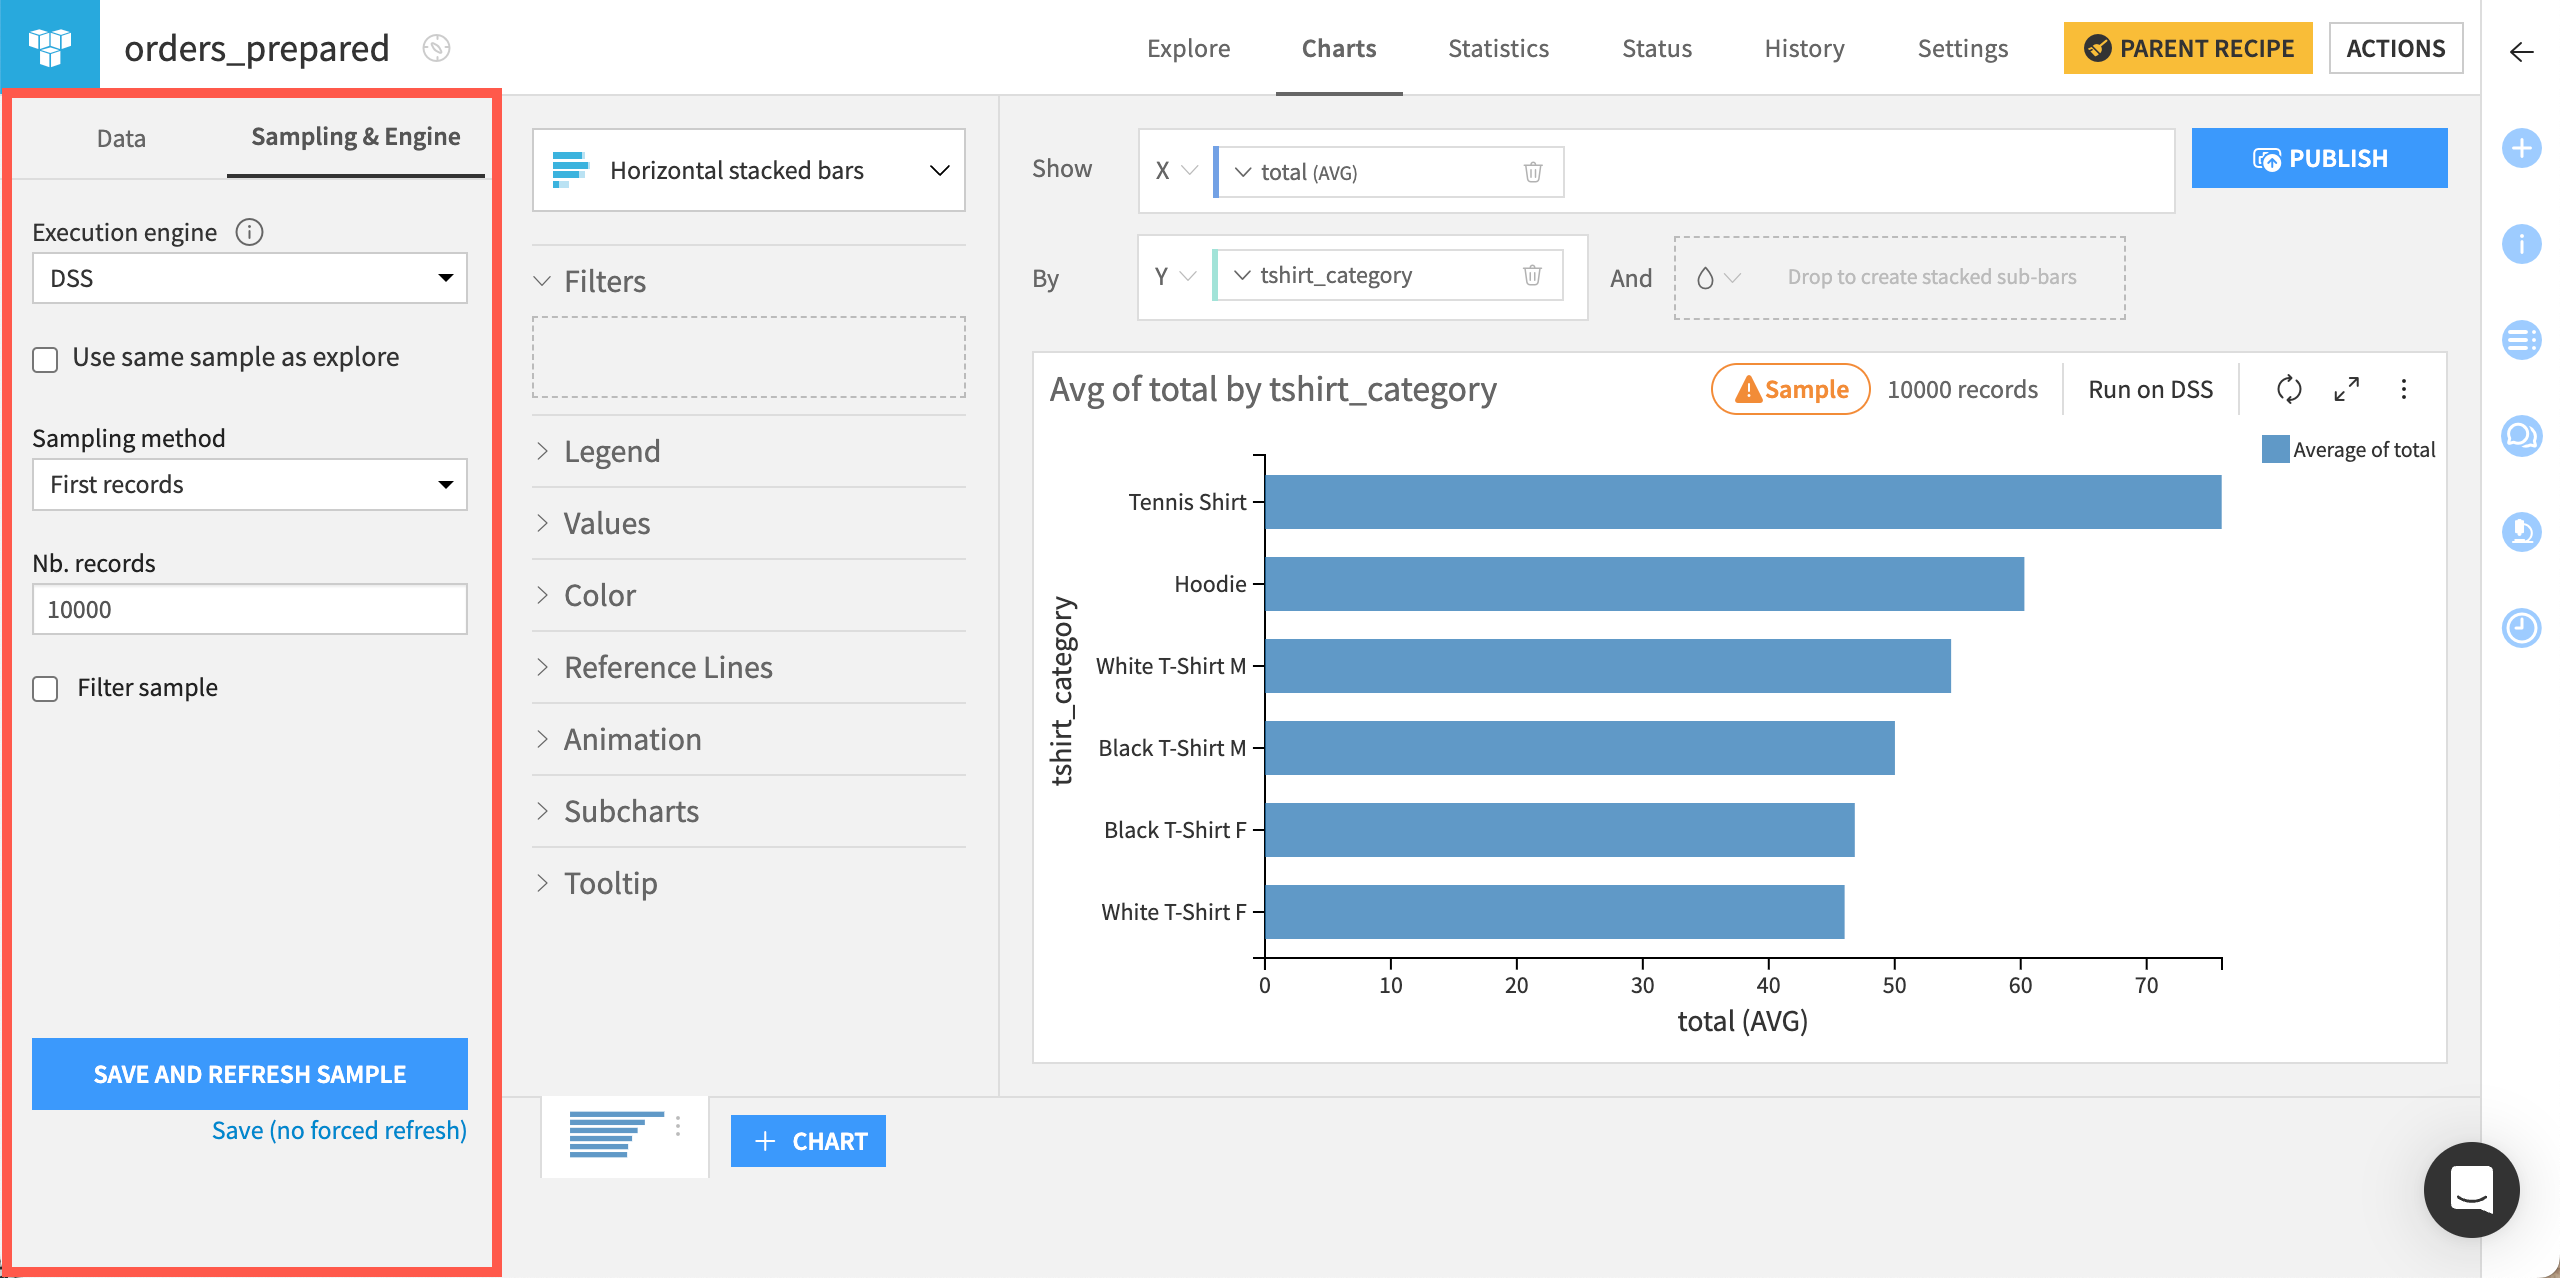
By default, the execution engine is the DSS engine. However, you can select another engine to improve performance. For example, you can compute charts in-database on SQL data sources.
Regarding the sampling, by default, charts use the same sample as the Explore tab (if you have checked the Use same sample as explore option). However, you can change it by de-selecting the option and adjusting your sampling method.
Next steps#
You just learned how to use the Charts tab of a Dataiku dataset for visualization. Practice your skills and learn how to create pivot tables in the Tutorial | Pivot tables.
See also
For more information, see the Charts section of the reference documentation.