
How-to | Build hierarchies for drill-down charts#
Hierarchies let you organize related columns into a navigable structure. When used in charts, they enable interactive drill-down and drill-up actions, so you can move from a broad view to a detailed one—without duplicating charts or applying complex filters.
Create a hierarchy#
You can create a hierarchy directly from a dataset’s charts view.
Open your dataset and go to the Charts tab.
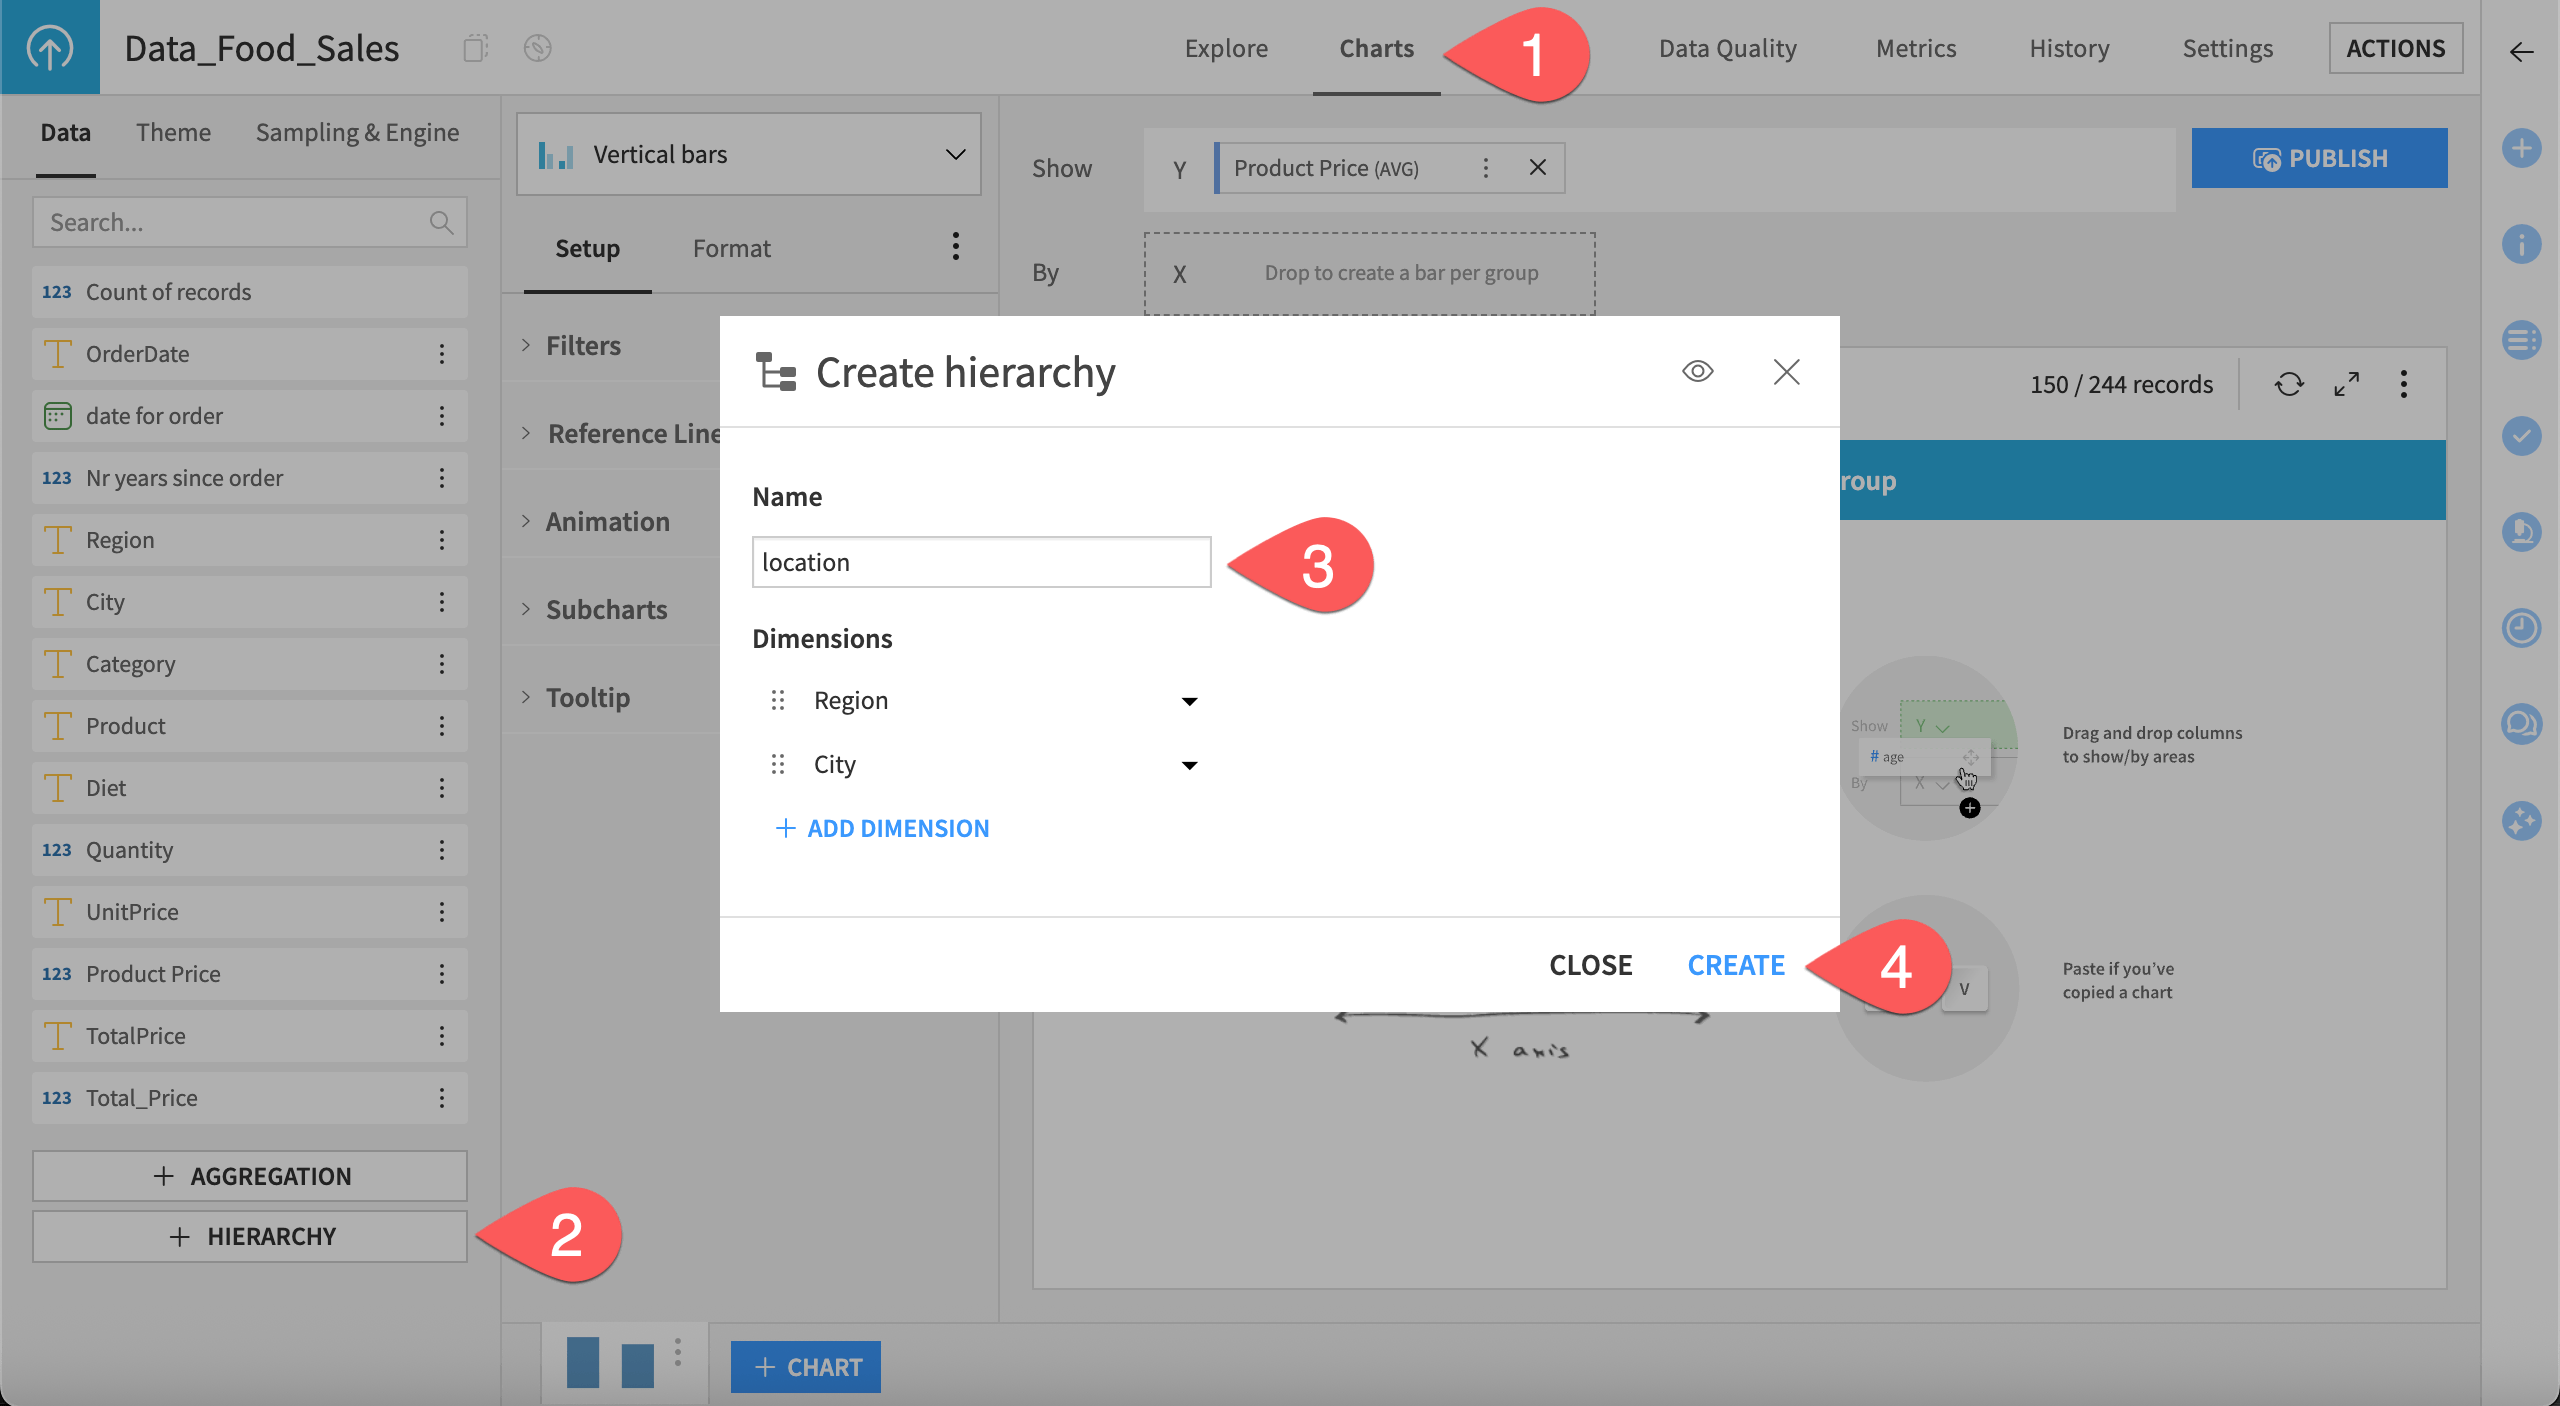
In the Data panel on the left, click + HIERARCHY.
Name your hierarchy and add up to five columns, ordered from the broadest to the most specific level.
Click Create.
Note
You can use a column in multiple hierarchies.
Use a hierarchy#
Once you created a hierarchy, you can use it as a single dimension in compatible chart drop zones. To use a hierarchy:
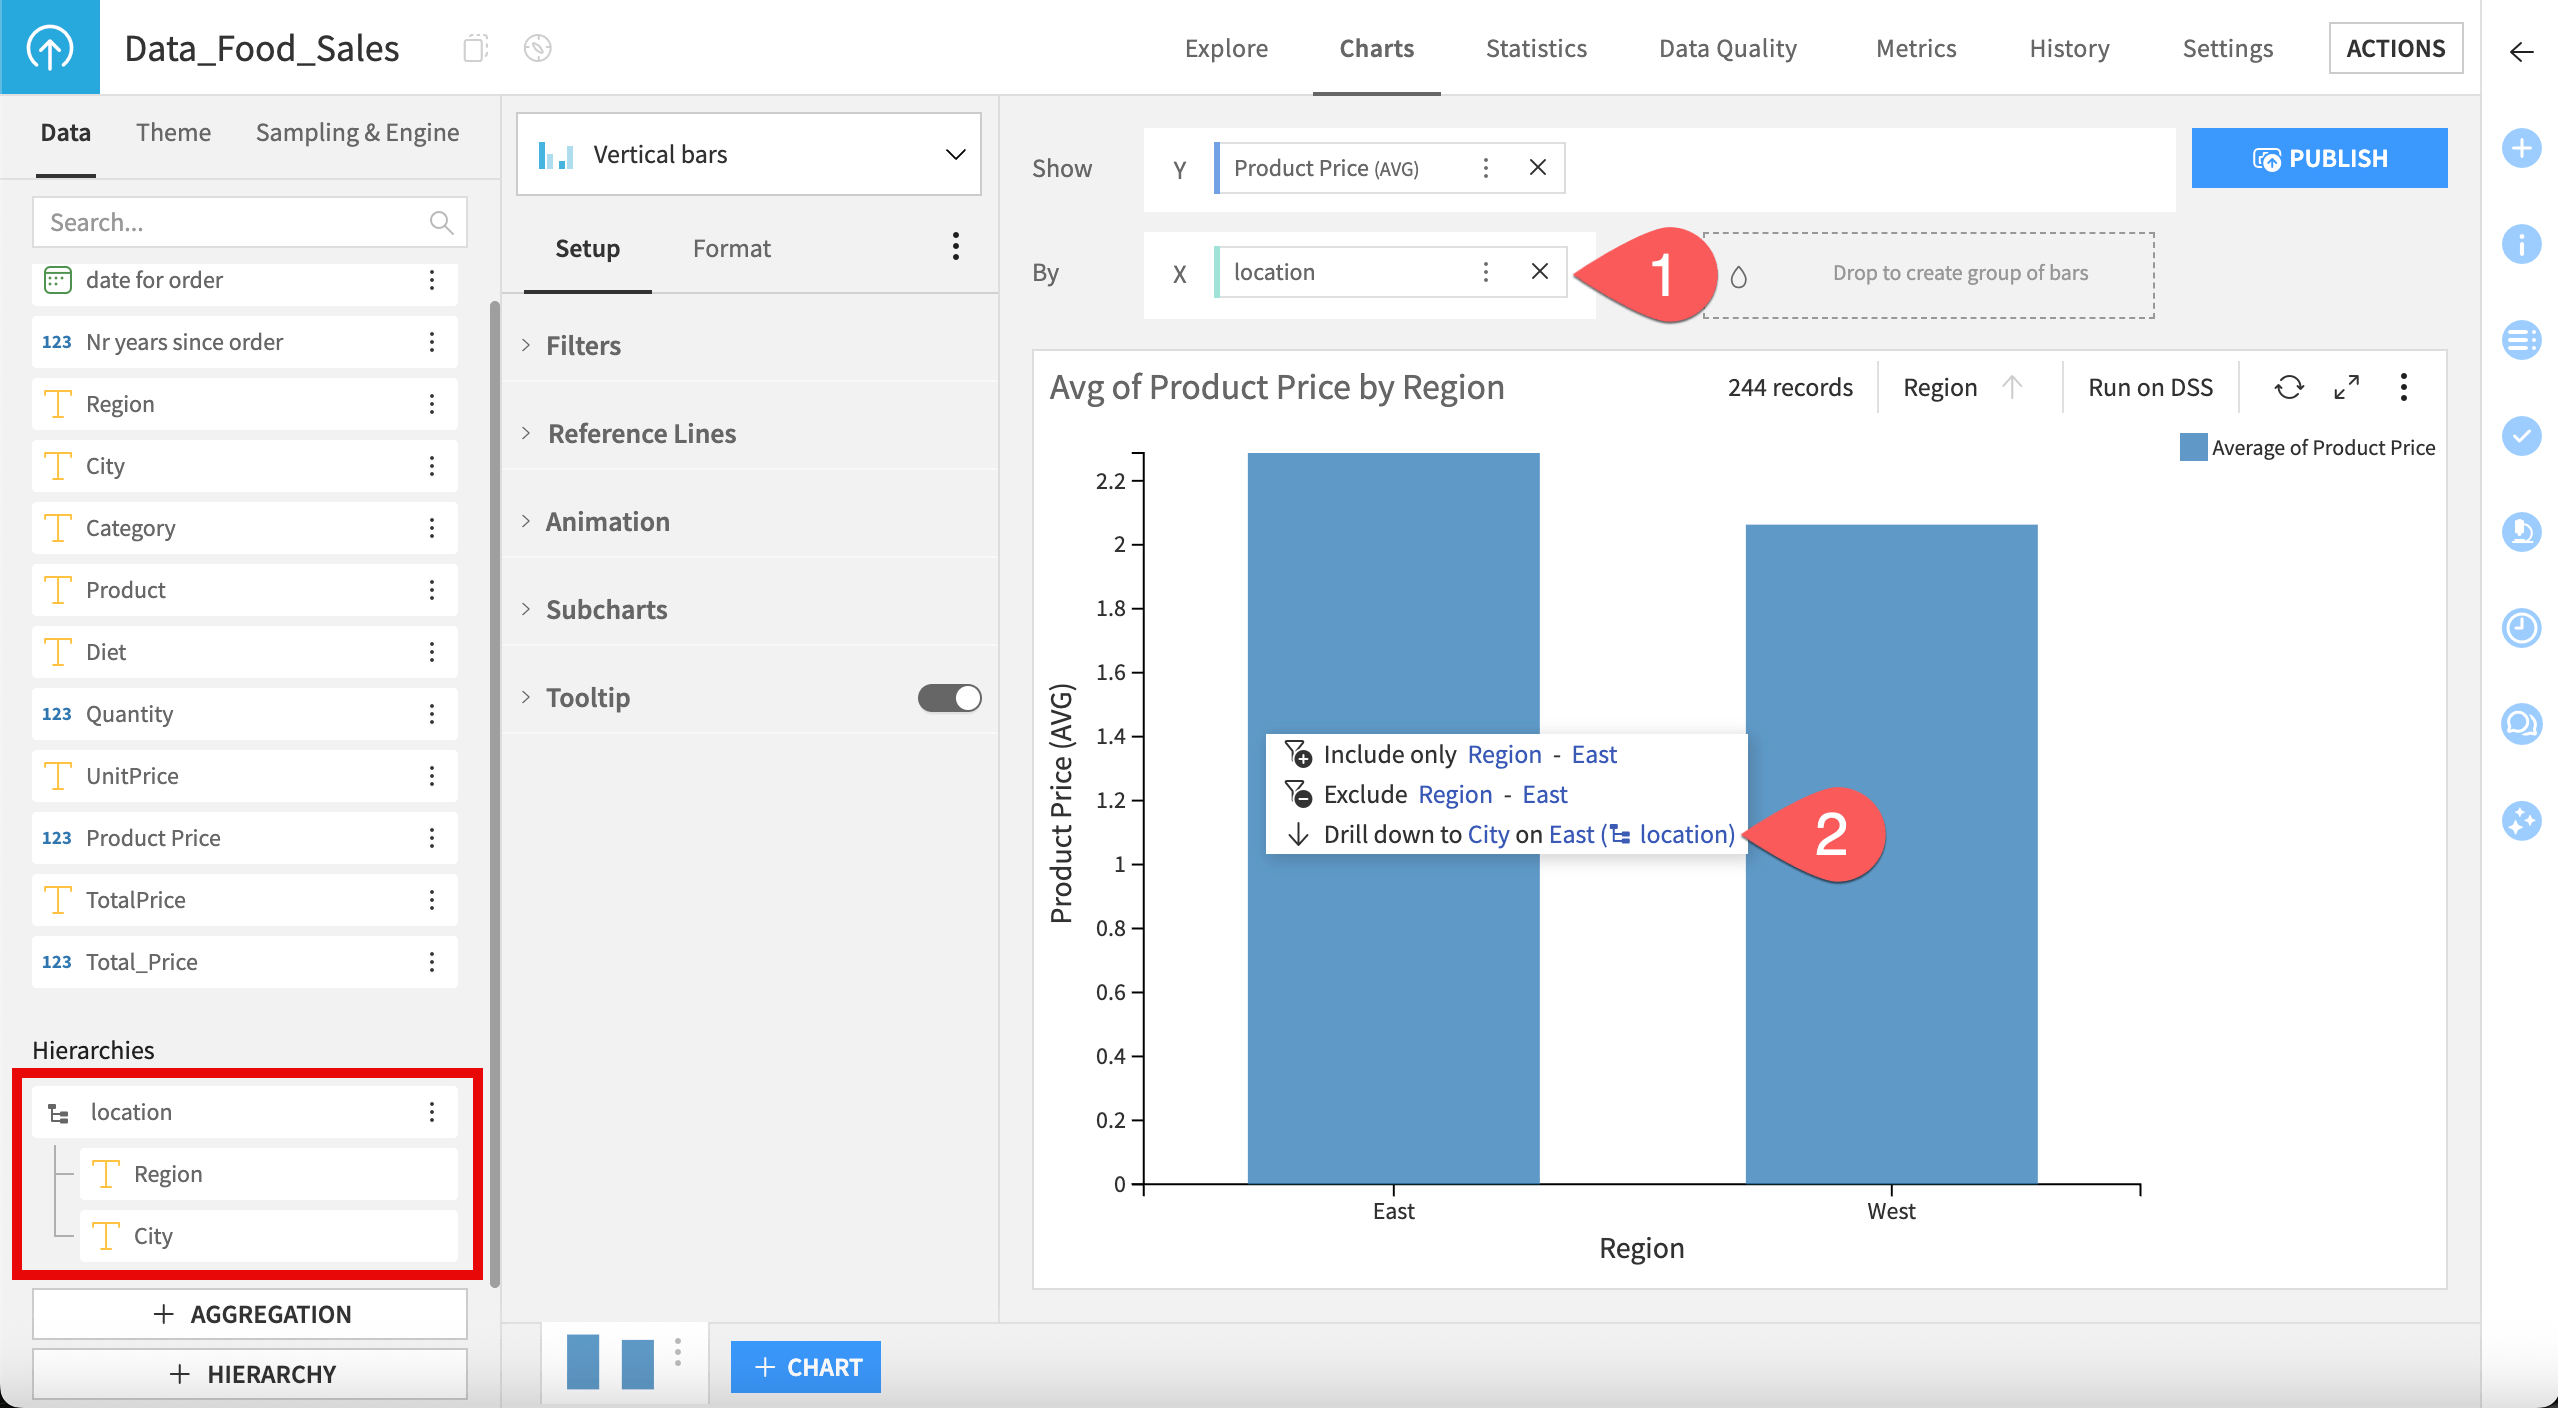
Drag your hierarchy into a compatible dimension drop zone.
Right-click a data point and select the drill-down option to move to the next level in the hierarchy. You can repeat this process to drill down through all levels defined in your hierarchy.
Note
For more information, see Drilling down and up in a hierarchy section of the reference documentation.
Using a hierarchy in a drop zone prevents you from adding additional dimensions to that zone.
Drill-down logic works with any data type, excluding geographical data and user-defined aggregations.
To return to the previous level:
Click the Drill up icon (
 ) in the chart header, or use the breadcrumb trail below the chart.
Use the chart header and breadcrumb trail to track your current level in the hierarchy.
Note
The breadcrumb trail isn’t available for pivot tables in 14.3.
Tip
Hierarchies behave similarly in dashboards. Drilling down in a dashboard tile drills only that chart and applies a page-level filter to the rest of the page.