

Tutorial | Live debugging#
Get started#
Live debugging gives you real-time feedback and lets you examine an agent test run in detail, including which tools it called, which inputs it passed, and what steps it took.
In this tutorial, you will learn how to examine these details and debug issues as you build and test an agent.
Objectives#
In this tutorial, you will:
Evaluate real-time feedback from the debugger as you build and test a Structured Visual Agent.
Examine a failed run in the debugger and debug the issue.
Use the debugger to understand how an agent stores and uses information in memory.
Prerequisites#
To complete this tutorial, you will need:
Dataiku 15.0 or later.
An Advanced Analytics Designer or Full Designer user profile.
A connection to at least one Generative AI model that supports tool calling and one that supports embedding. See supported models for tool calling and embedding (note that some models support both). Your administrator must configure the connection(s) in the Administration panel > Connections > New connection > LLM Mesh.
An internal code environment for retrieval augmented generation and agents. Your administrator must set this up in the Administration panel > Code Envs > Internal envs setup > Retrieval augmented generation code environment.
Knowledge of Structured Visual Agents in Dataiku.
Create the project#
If needed, from the Dataiku Design homepage, use the (
 ) icon to switch to the Designer view.
Click + New Project > Learning projects.
Search for and select Live debugging.
If needed, change the folder into which the project will be installed, and click Create.
From the project homepage, click Go to Flow (or type
g+f).
Note
You can also download the starter project from this website and import it as a ZIP file.
Use case summary#
Your IT help desk receives hundreds of support tickets every week. You are tasked with building an agent to classify the tickets by urgency to help your team triage requests.
You will build a Structured Visual Agent that:
Takes a ticket ID as input from the user and retrieves the ticket details from the it_tickets dataset.
Saves the ticket details to temporary memory.
Classifies the ticket’s urgency as Critical, High, Medium, or Low.
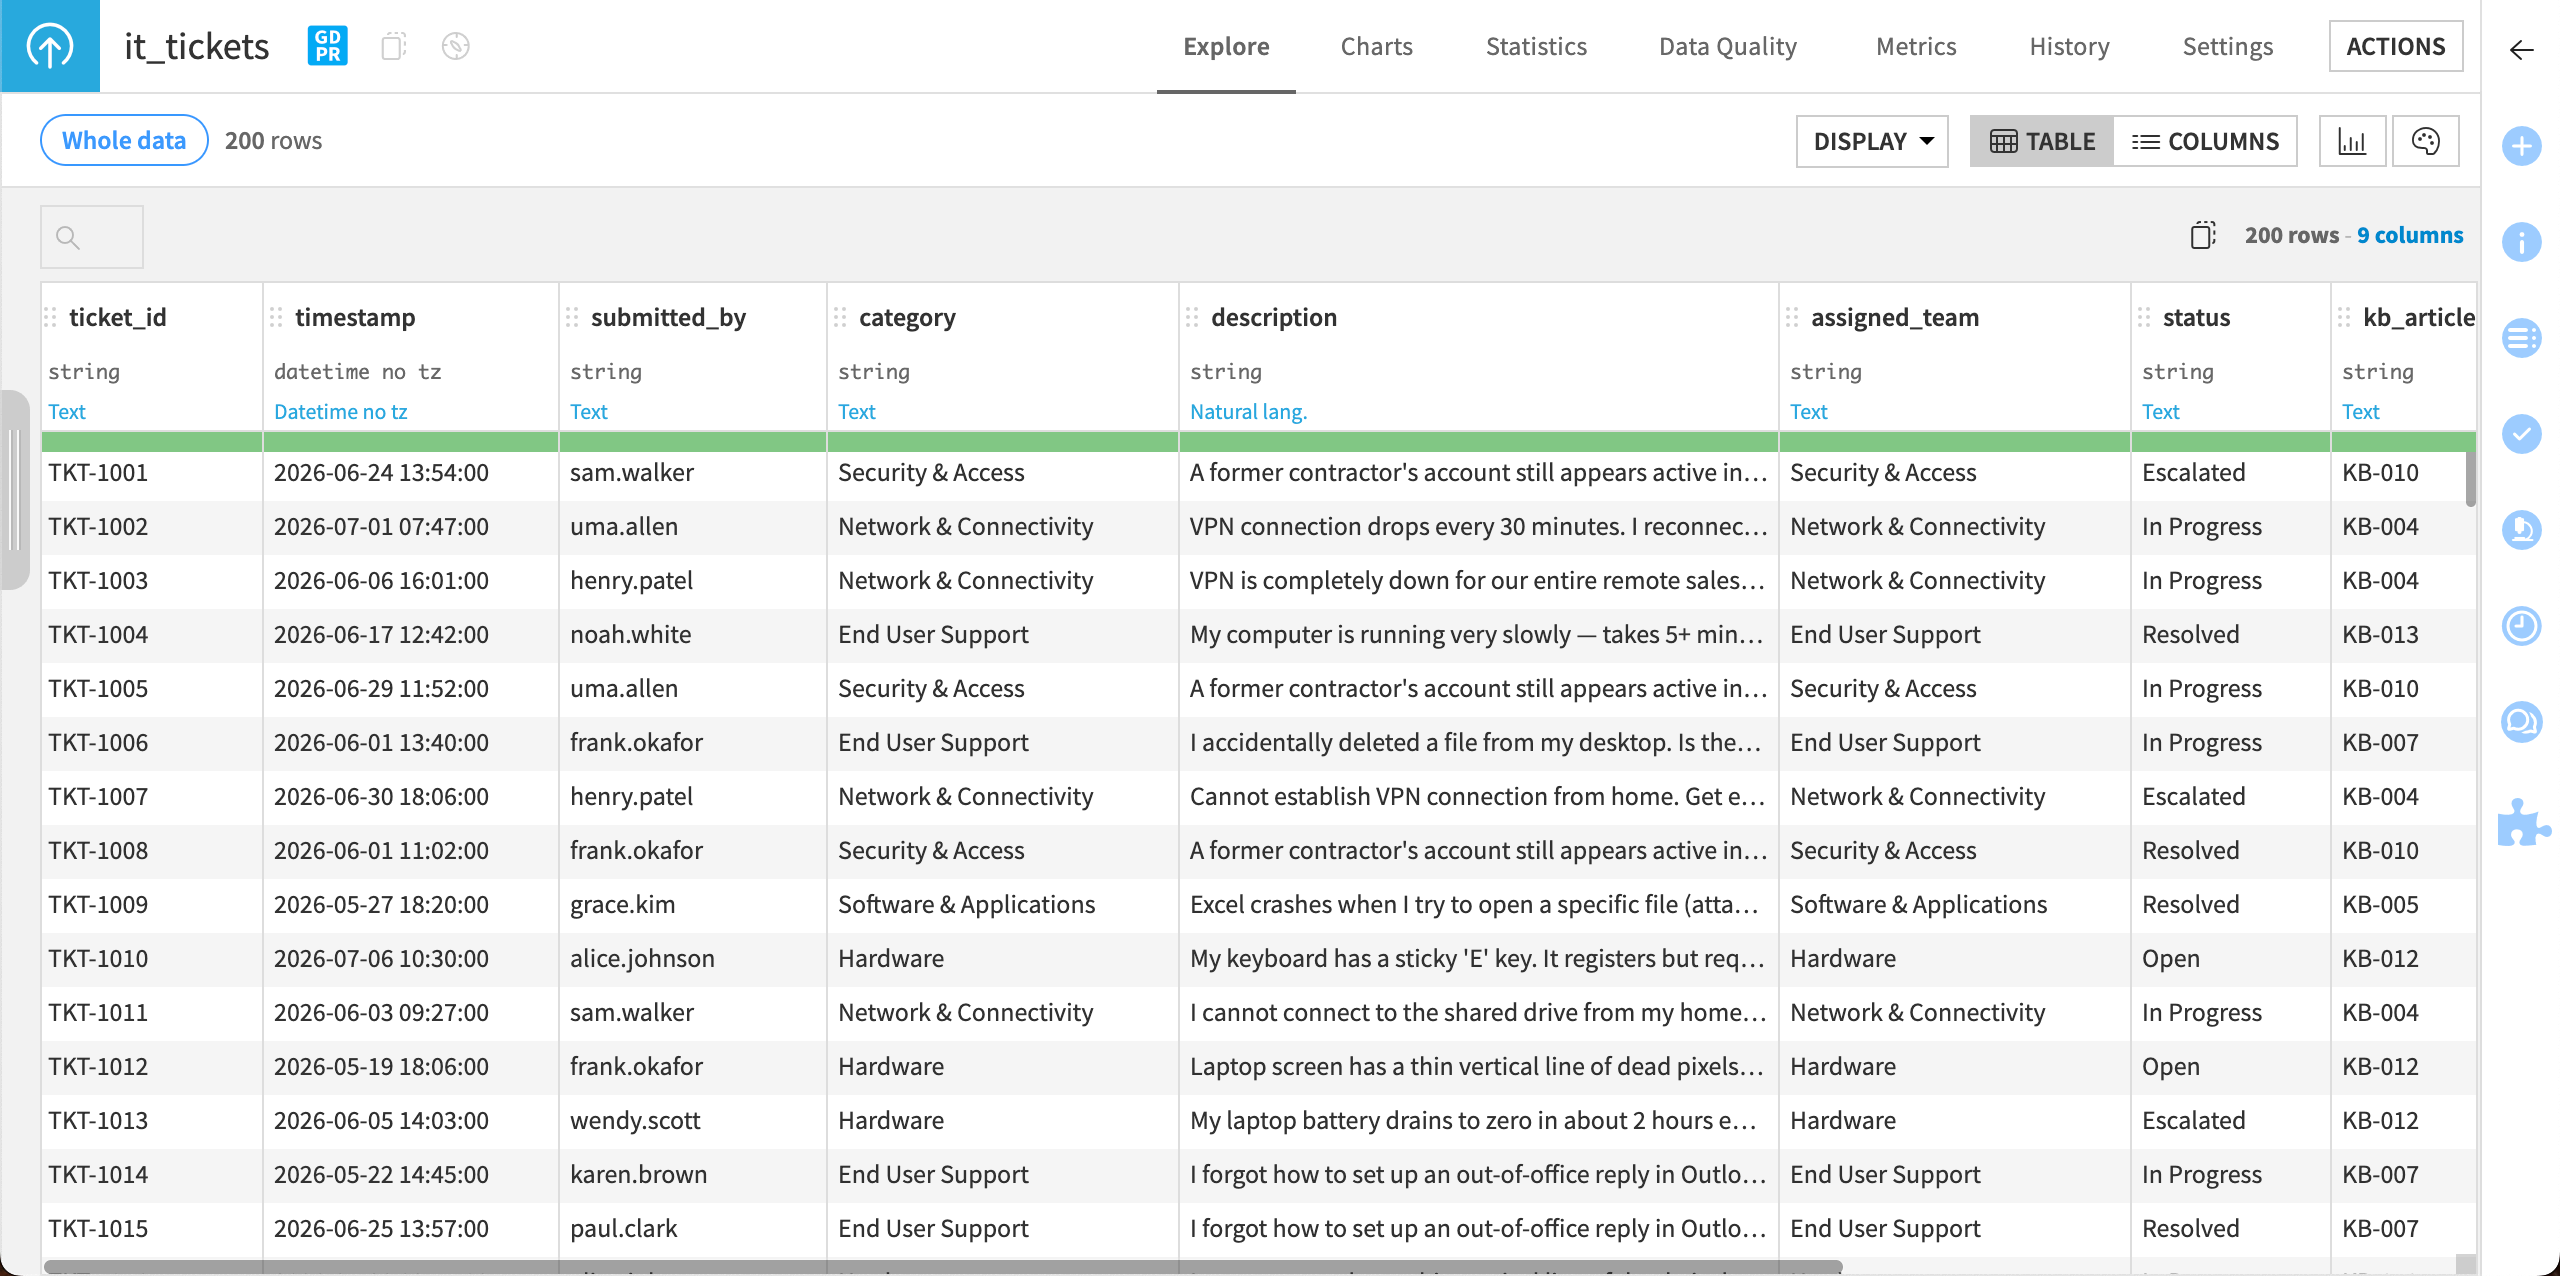
The project contains the dataset it_tickets and the agent tool ticket_lookup for looking up information in the dataset.
Debug a tool error#
As you create the agent, you can send test chats and evaluate real-time feedback from the timeline in the chat and diagram. You can test each block as you build to make sure the components work.
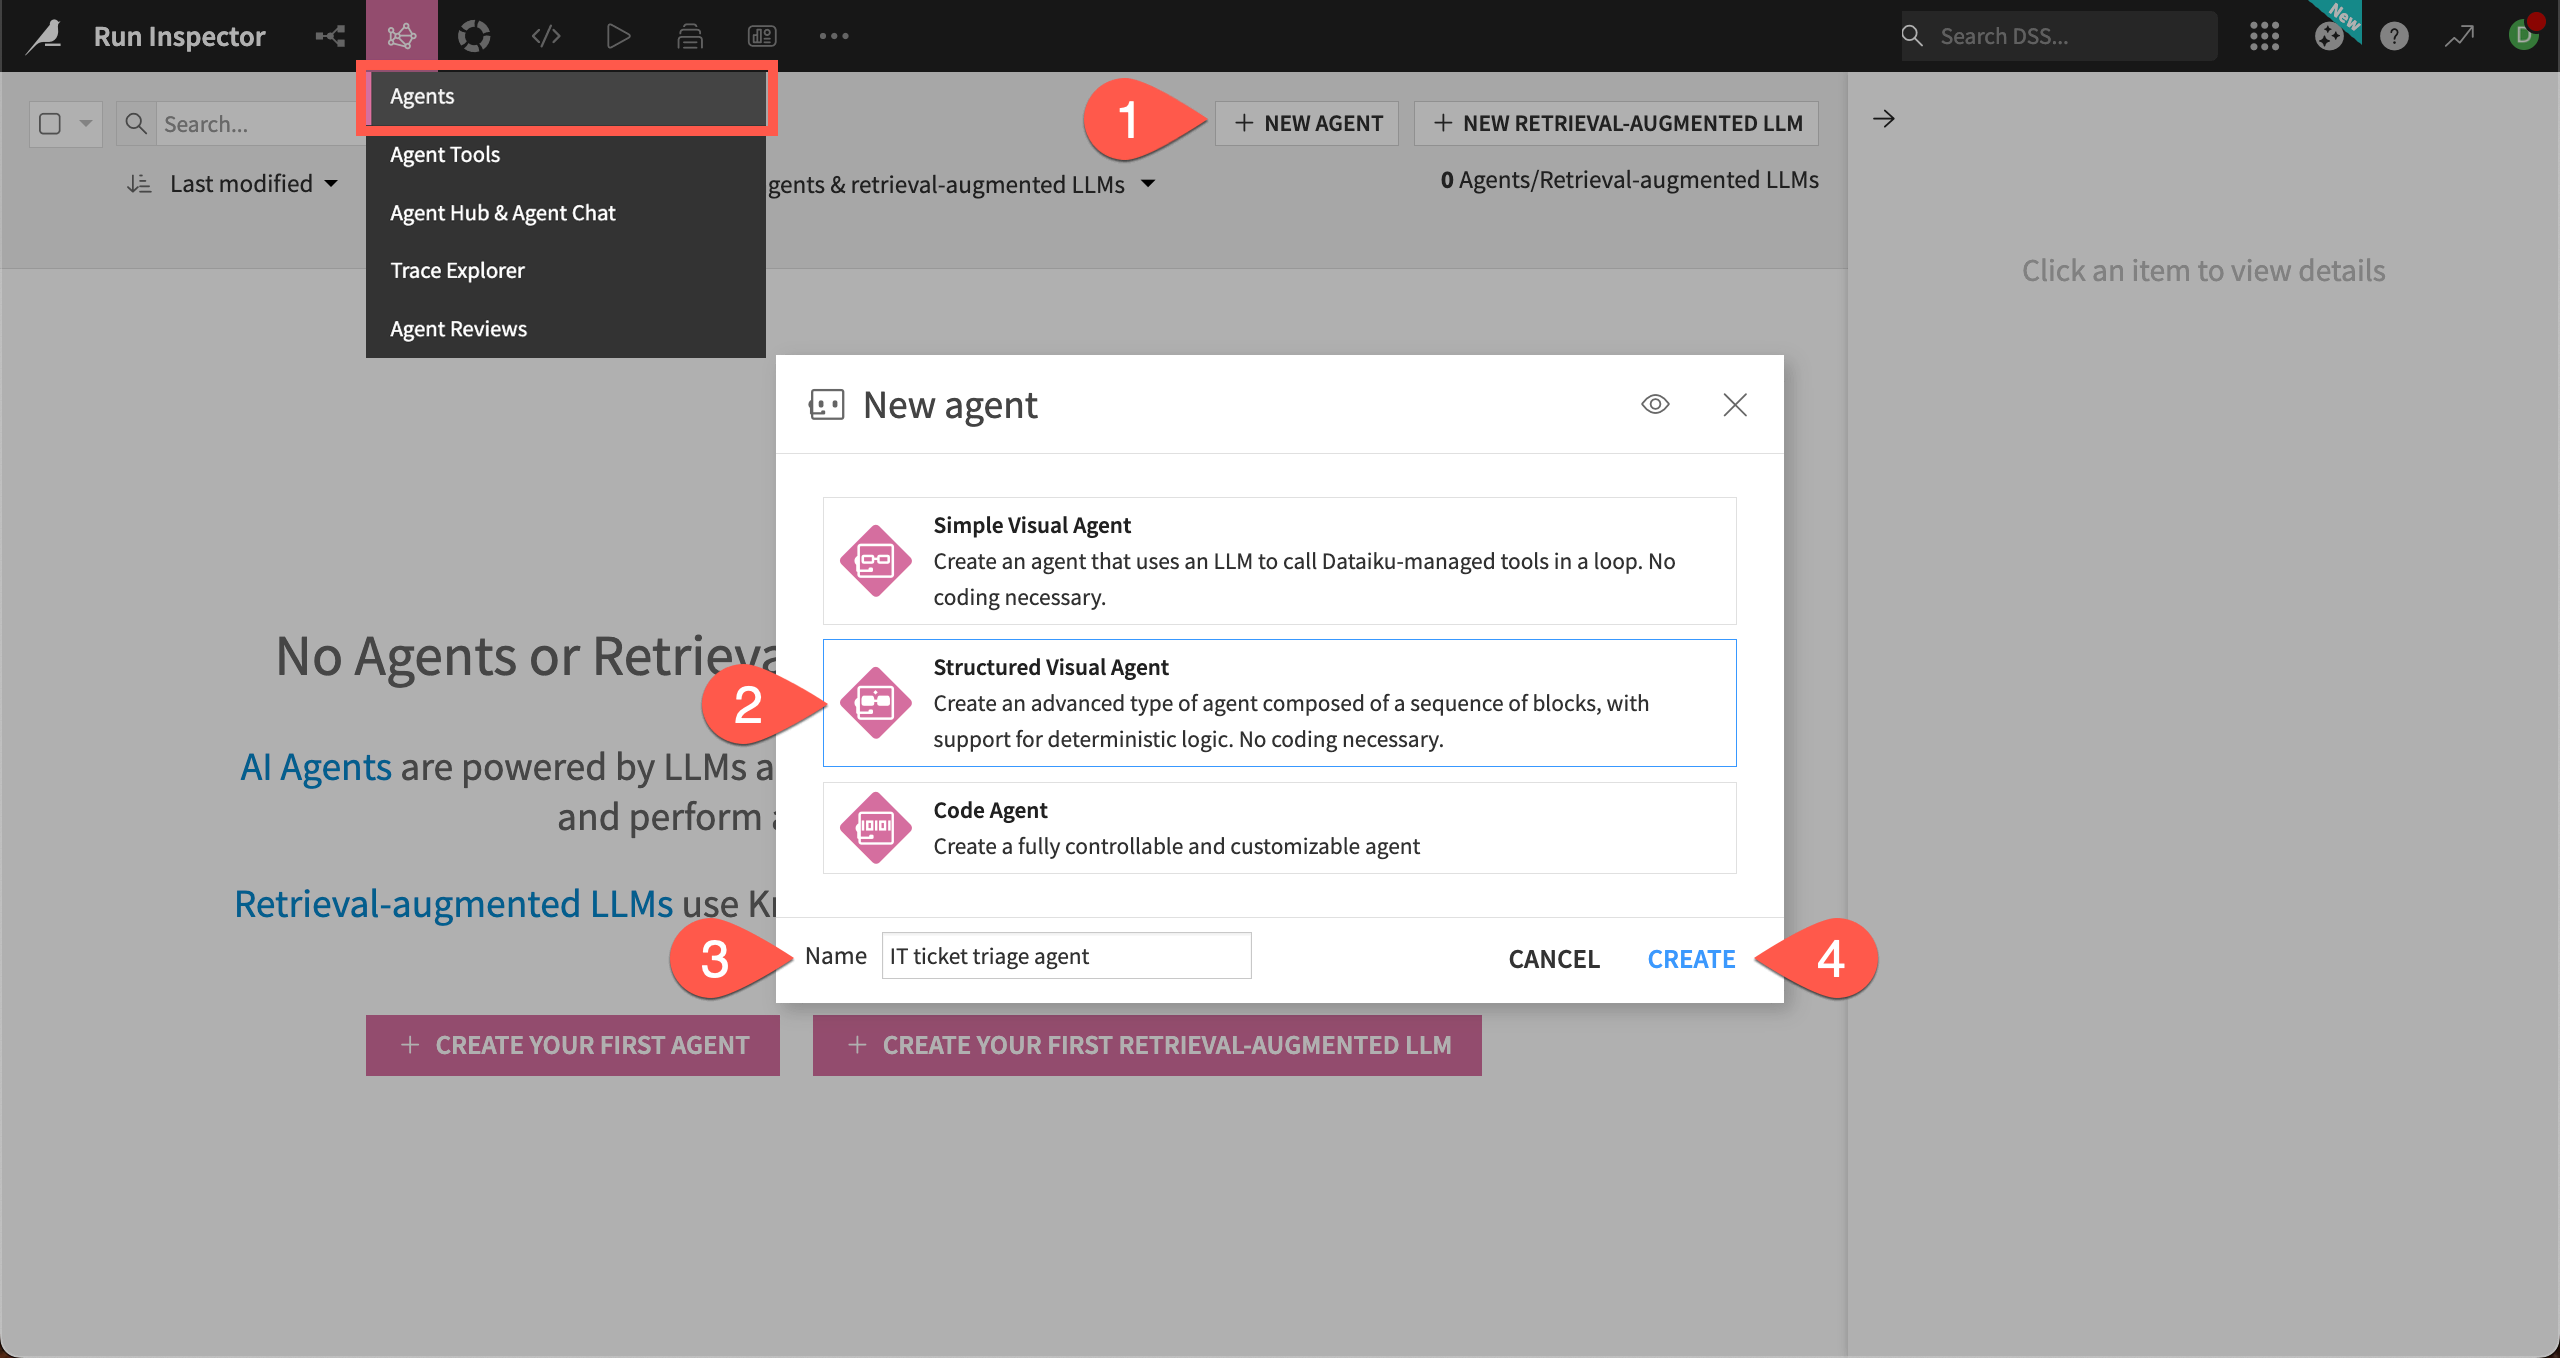
Go to GenAI > Agents and click + New Agent.
Choose Structured Visual Agent.
Name it
IT ticket triage agent.Click Create.
Create block 1: Receive ticket ID#
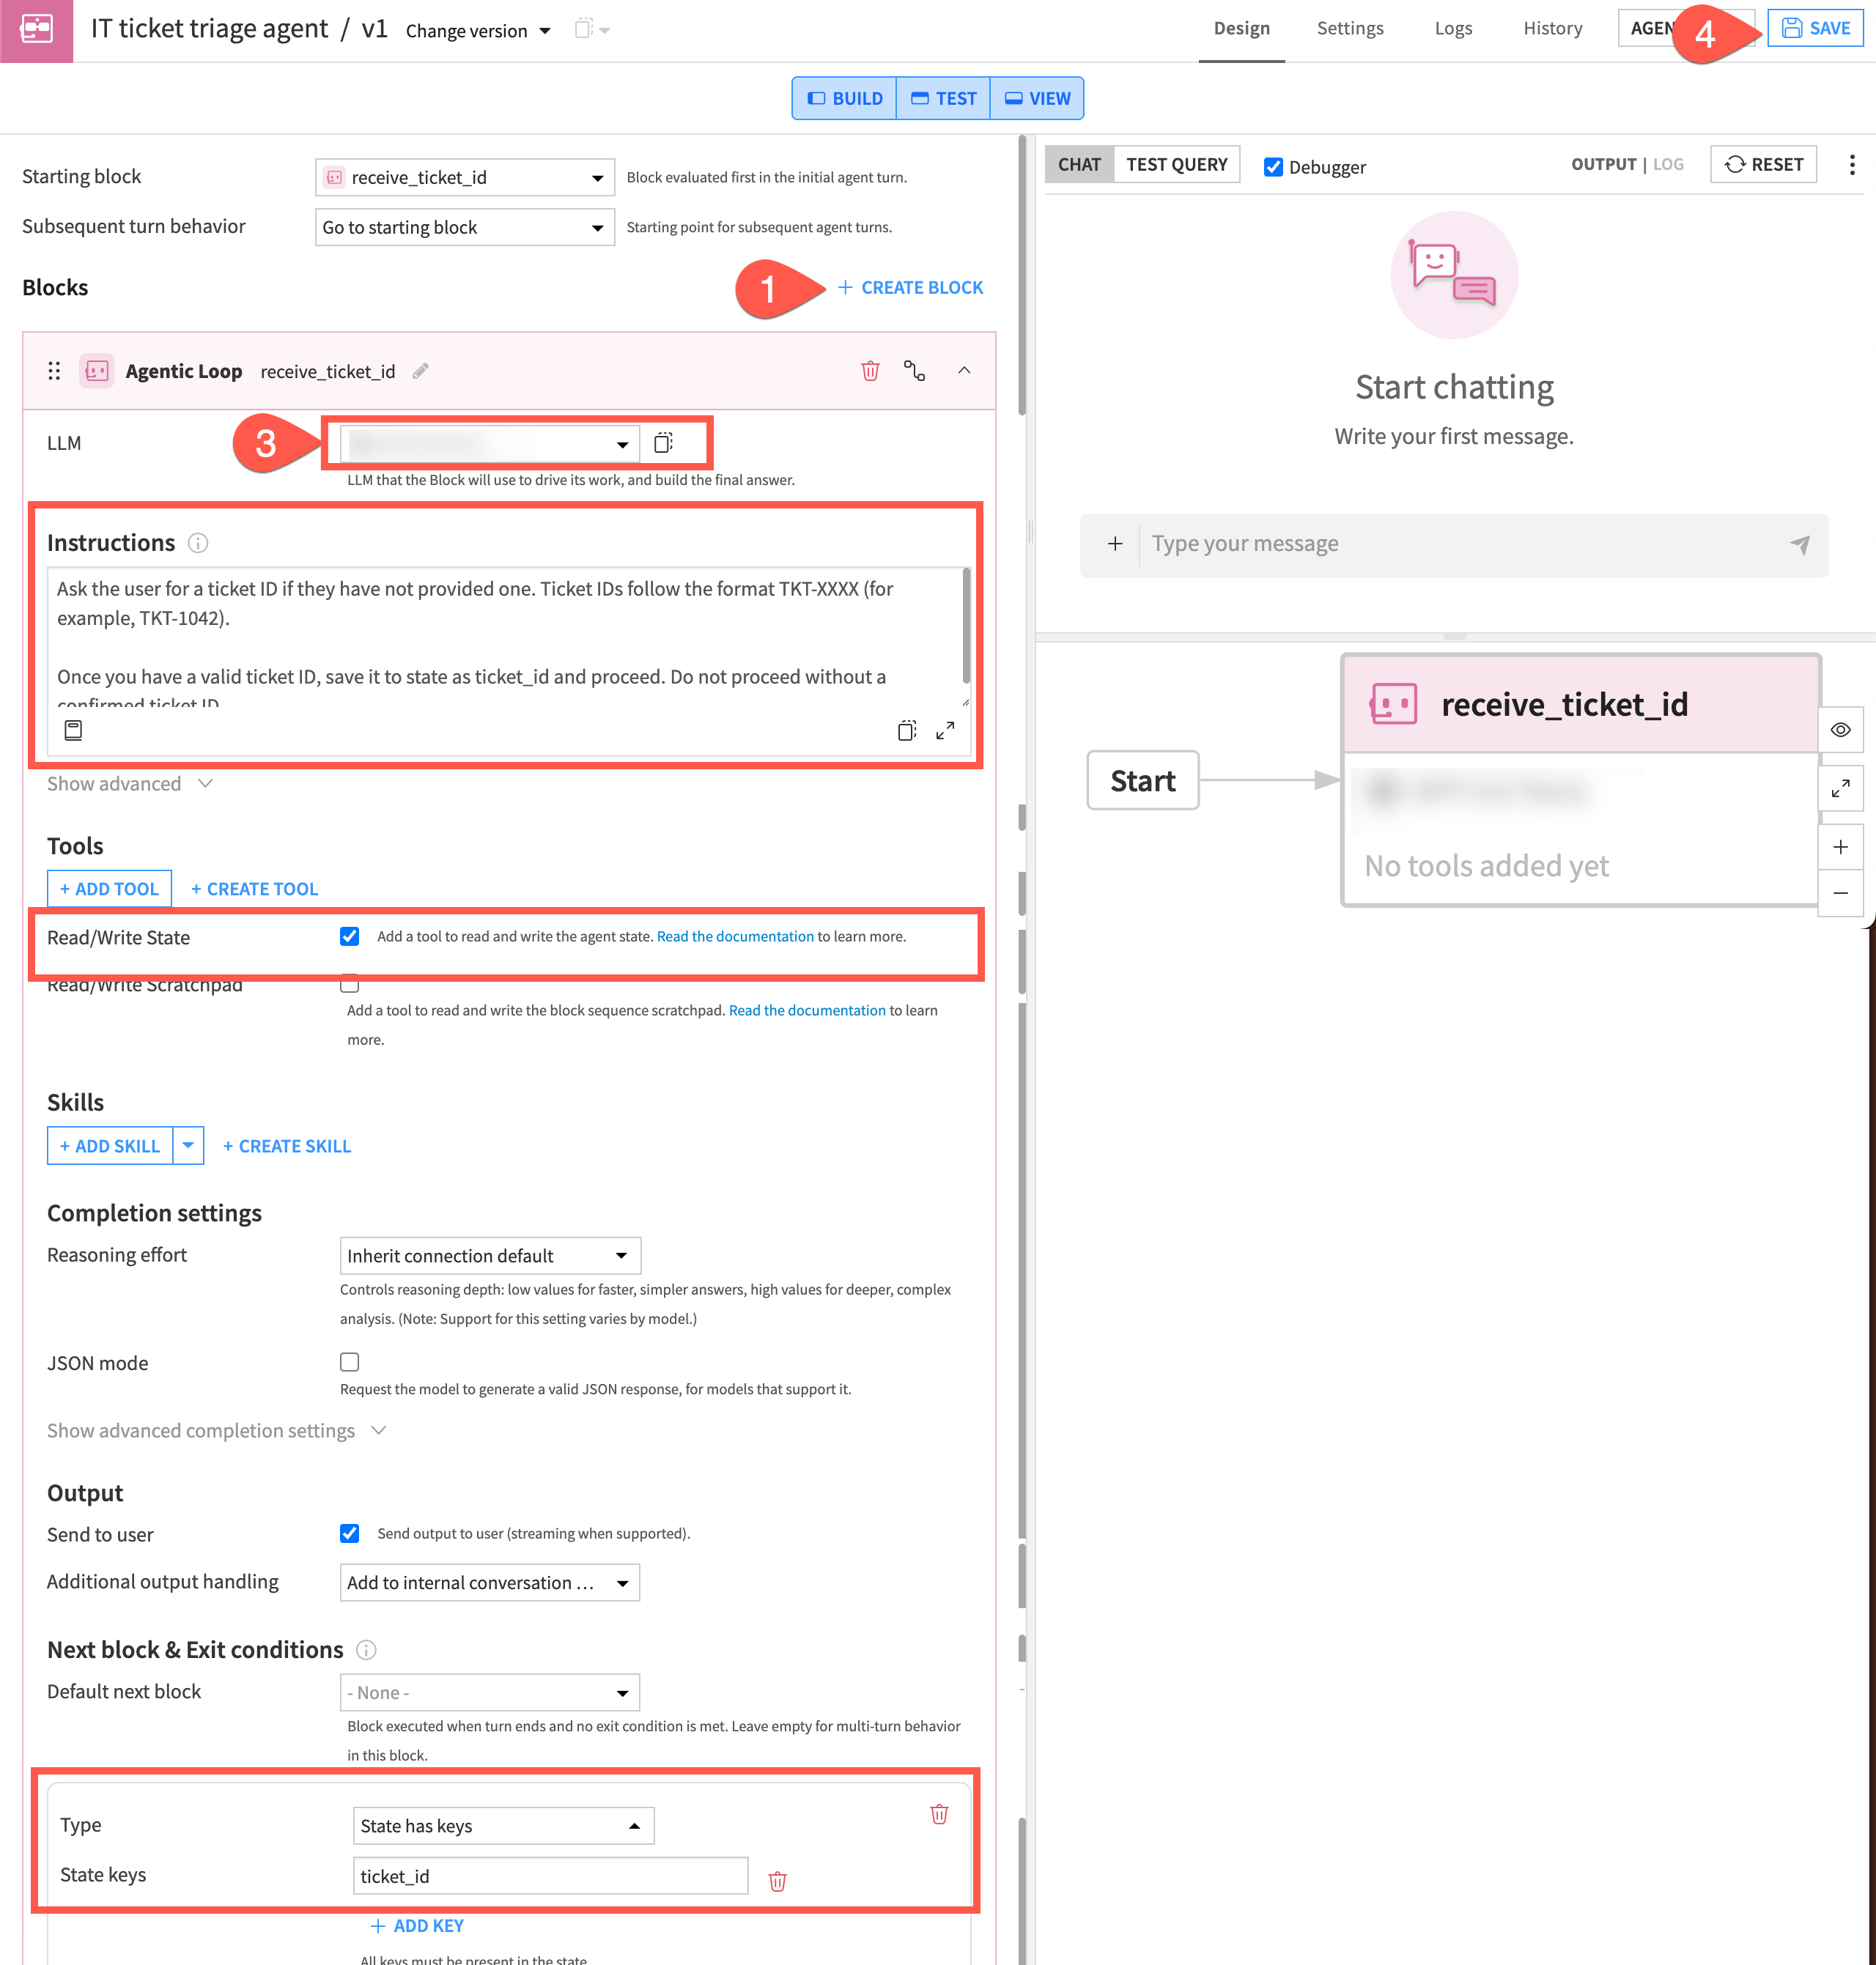
The first block obtains a ticket ID from the user and saves it to state. The next block uses that ID to retrieve the ticket details.
Click + Create Block and add an Agentic Loop block.
Name it
receive_ticket_idand click Create.Configure the following settings in the block:
LLM: Choose from your configured options.
Instructions:
Ask the user for a ticket ID if they have not provided one. Ticket IDs follow the format TKT-XXXX (for example, TKT-1042).

Once you have a valid ticket ID, save it to state as ticket_id and proceed. Do not proceed without a confirmed ticket ID.
Tools: Check the box next to Read/Write State.
Next block & Exit conditions: Add an exit condition of Type: State has keys and add the State keys of
ticket_id.
Click Save.
Create block 2: Fetch ticket data#
The next block takes the ticket ID and uses the agent tool to look up the rest of the data about that ticket.
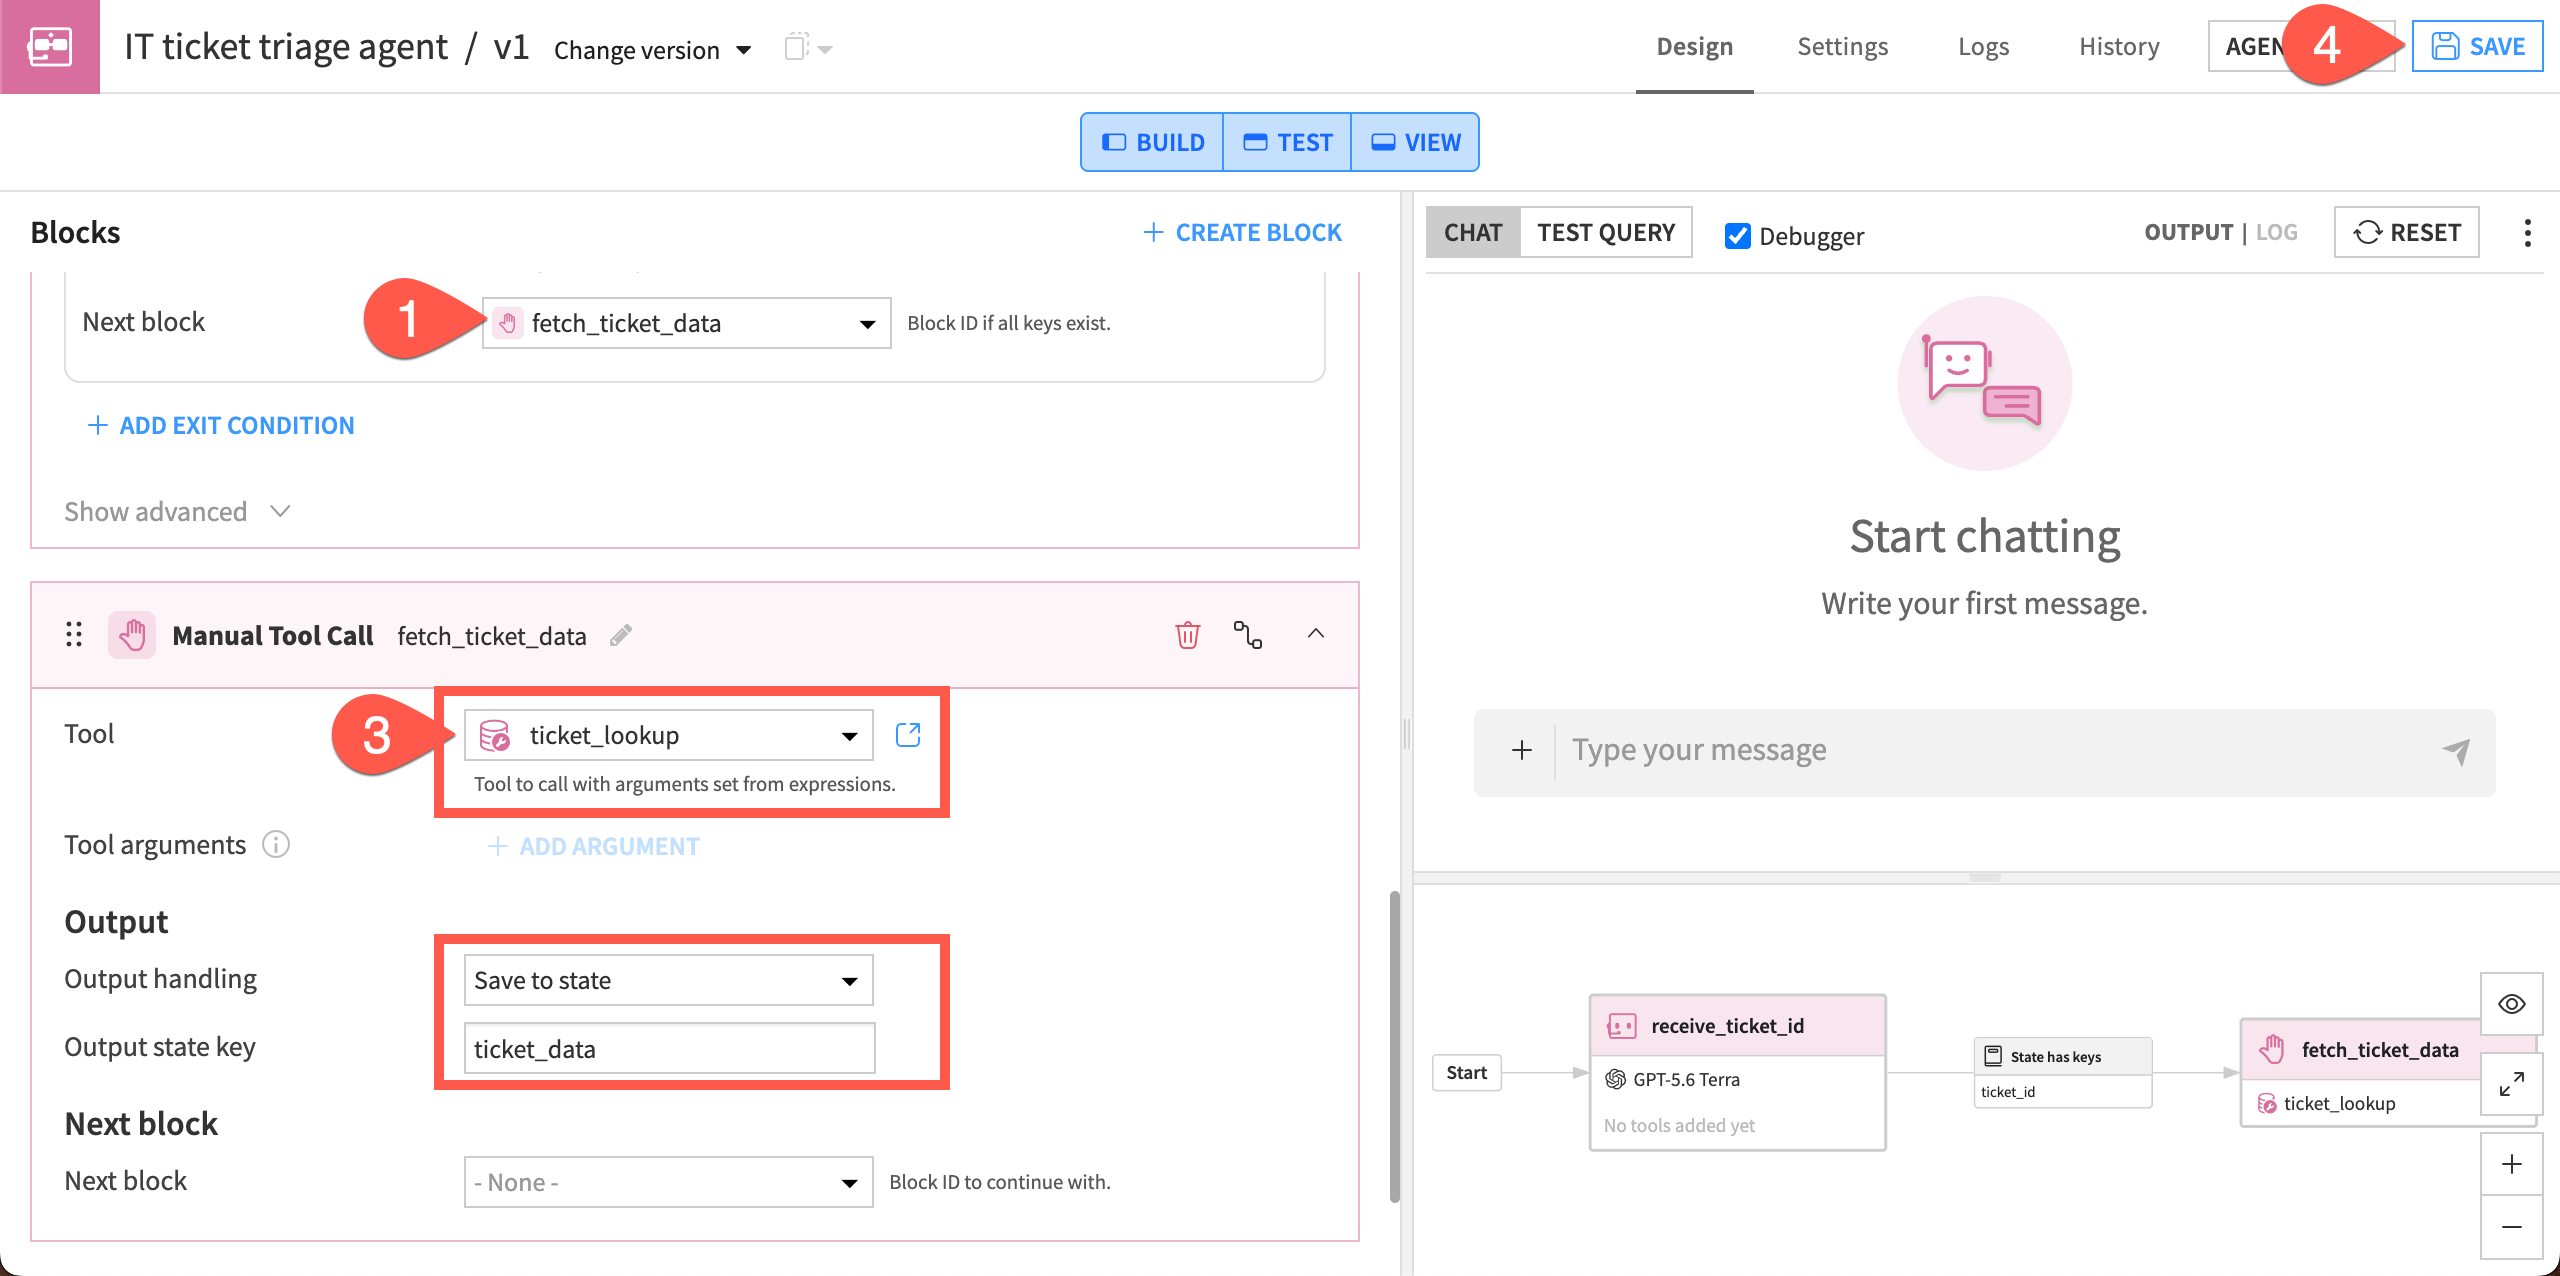
Under Next block & Exit conditions > Default next block, select + Create new block.
Choose a Manual Tool Call block, name it
fetch_ticket_data, and click Create.In the block, configure the following settings:
Tool: Select ticket_lookup.
Output: Change to Save to state, and add the Output state key of
ticket_data.
Click Save.
Test and debug the blocks#
Now test the blocks and track their steps, starting with the timeline in the chat.
Enable the Debugger checkbox at the top of the chat.
Type
TKT-1042in the chat and send it.The agent should return an error message. The second block appears red in the chat, and the timeline event displays a red X.
Review the agent diagram and note the red X on the fetch_ticket_data block. This means the agent couldn’t execute the block.
Click on the red fetch_ticket_data event in the chat response window. The debugger panel appears on the right.
Check the Input/Output tab, which says that no input or output was captured.
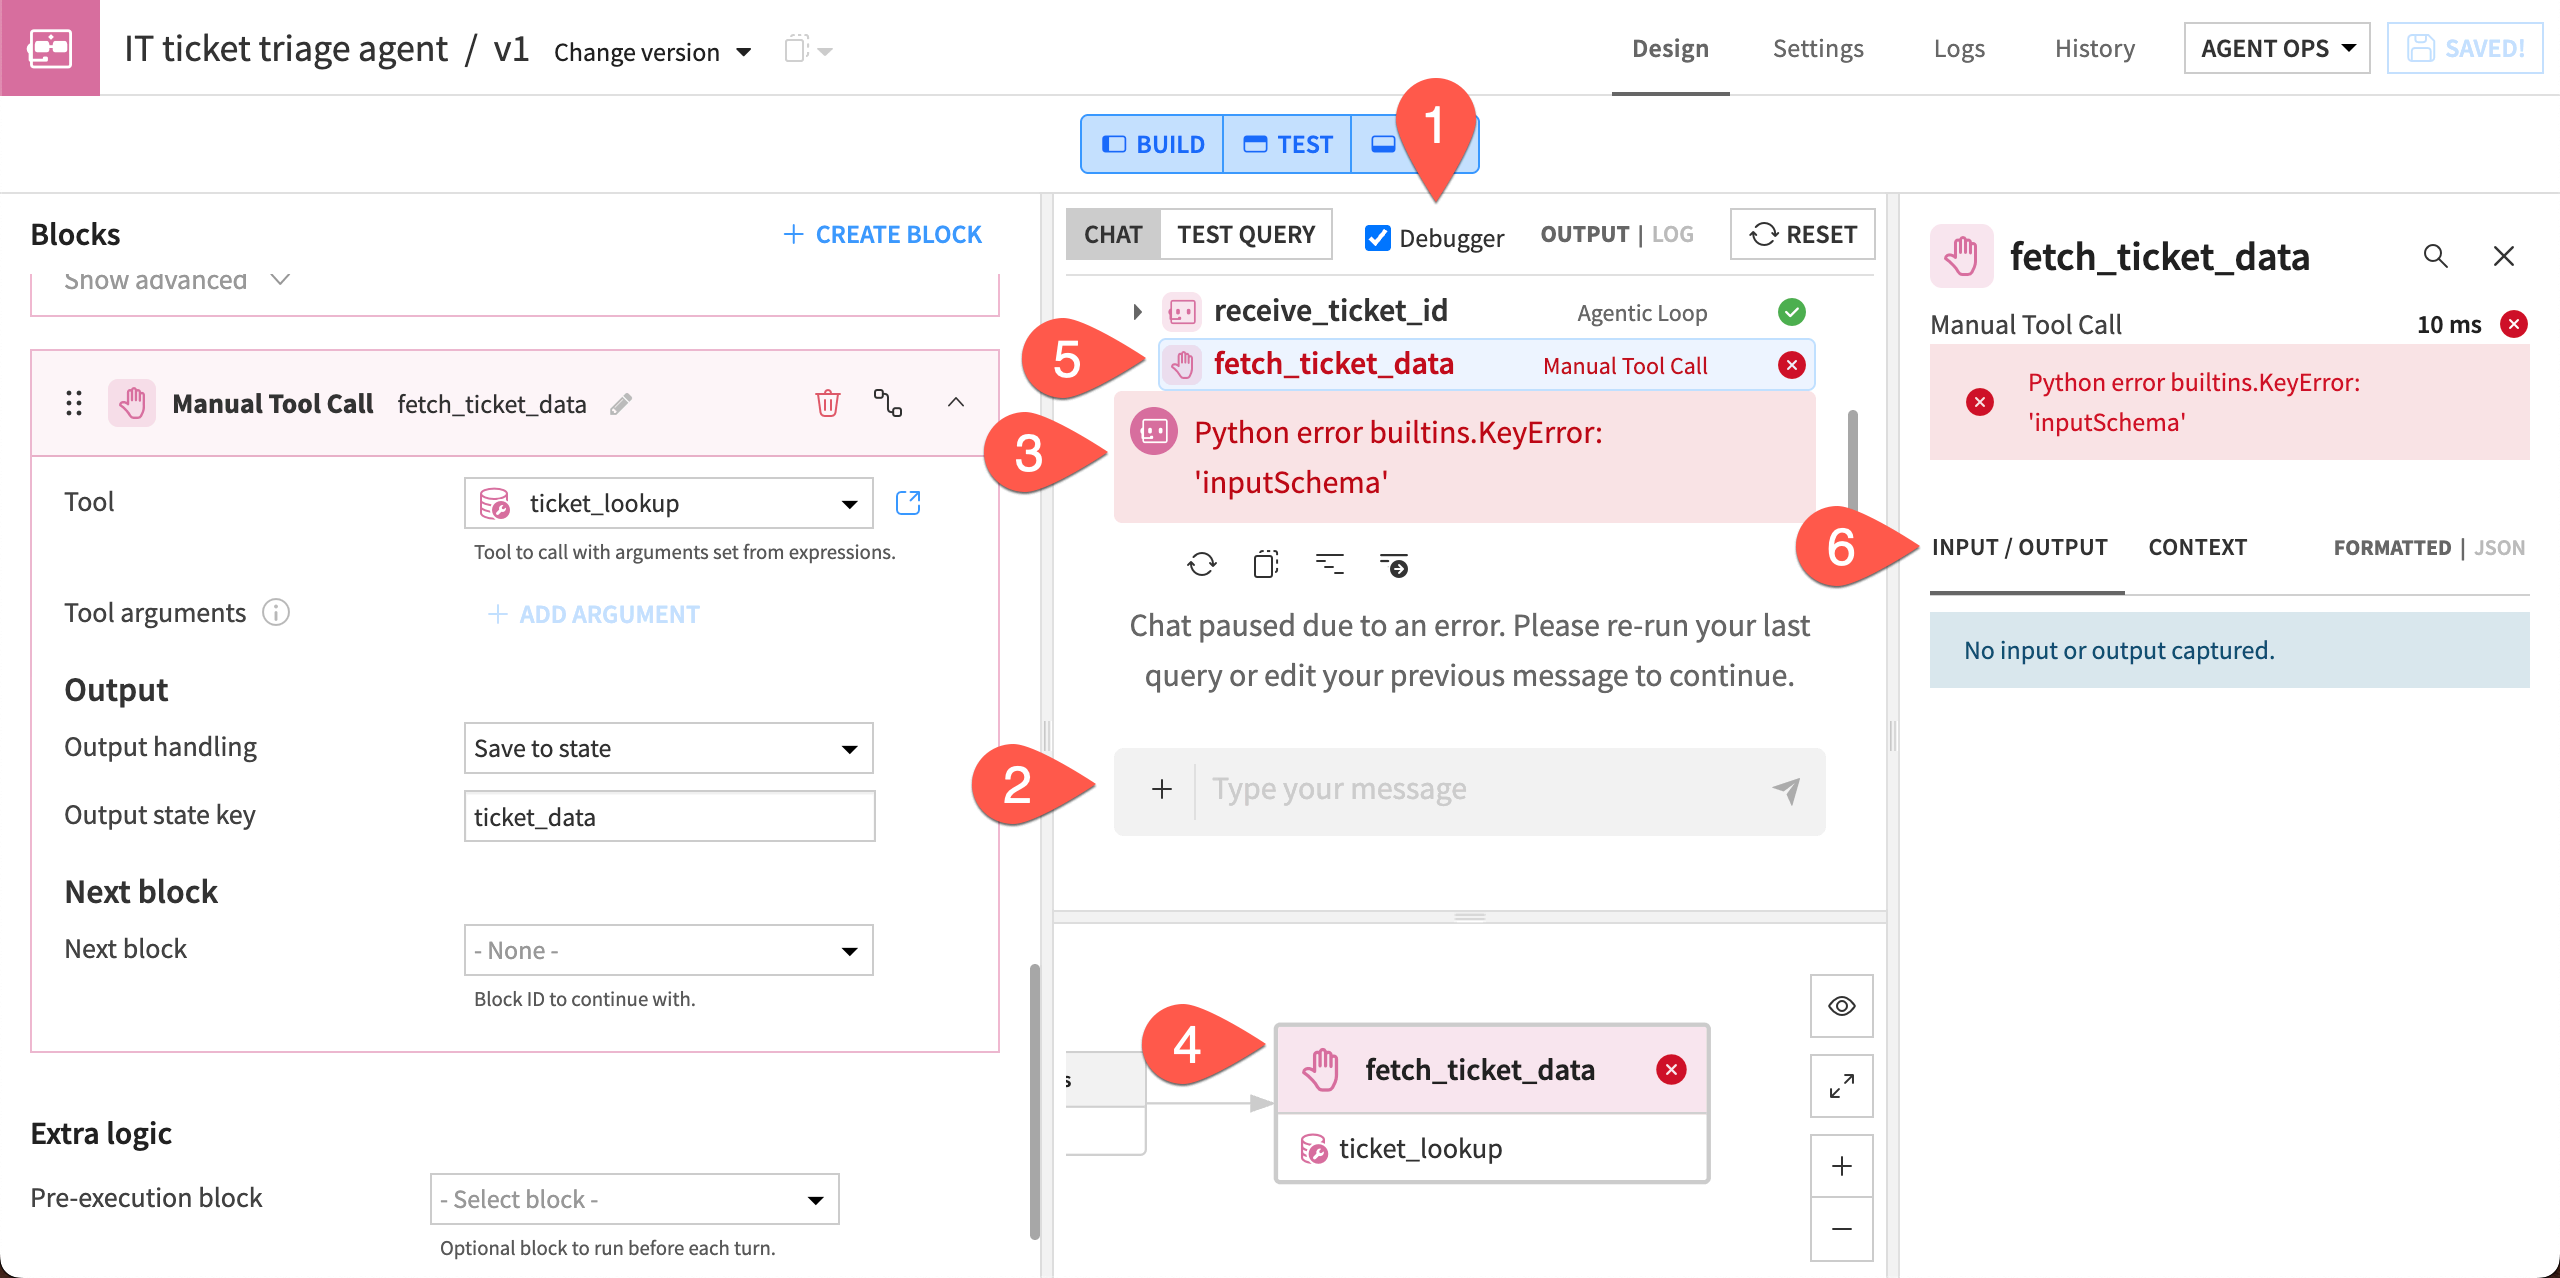
The block failed before producing an output. The timeline and debugger indicate that the failure occurred during the tool call, so the next step is to check the tool configuration.
To investigate, go to the GenAI menu (
 ) > Agent Tools.
Open the ticket_lookup tool.
Check the tool configuration and notice the tool isn’t connected to any dataset.
Set the Dataset to it_tickets.
Set the Lookup columns to ticket_id.
Click Save.
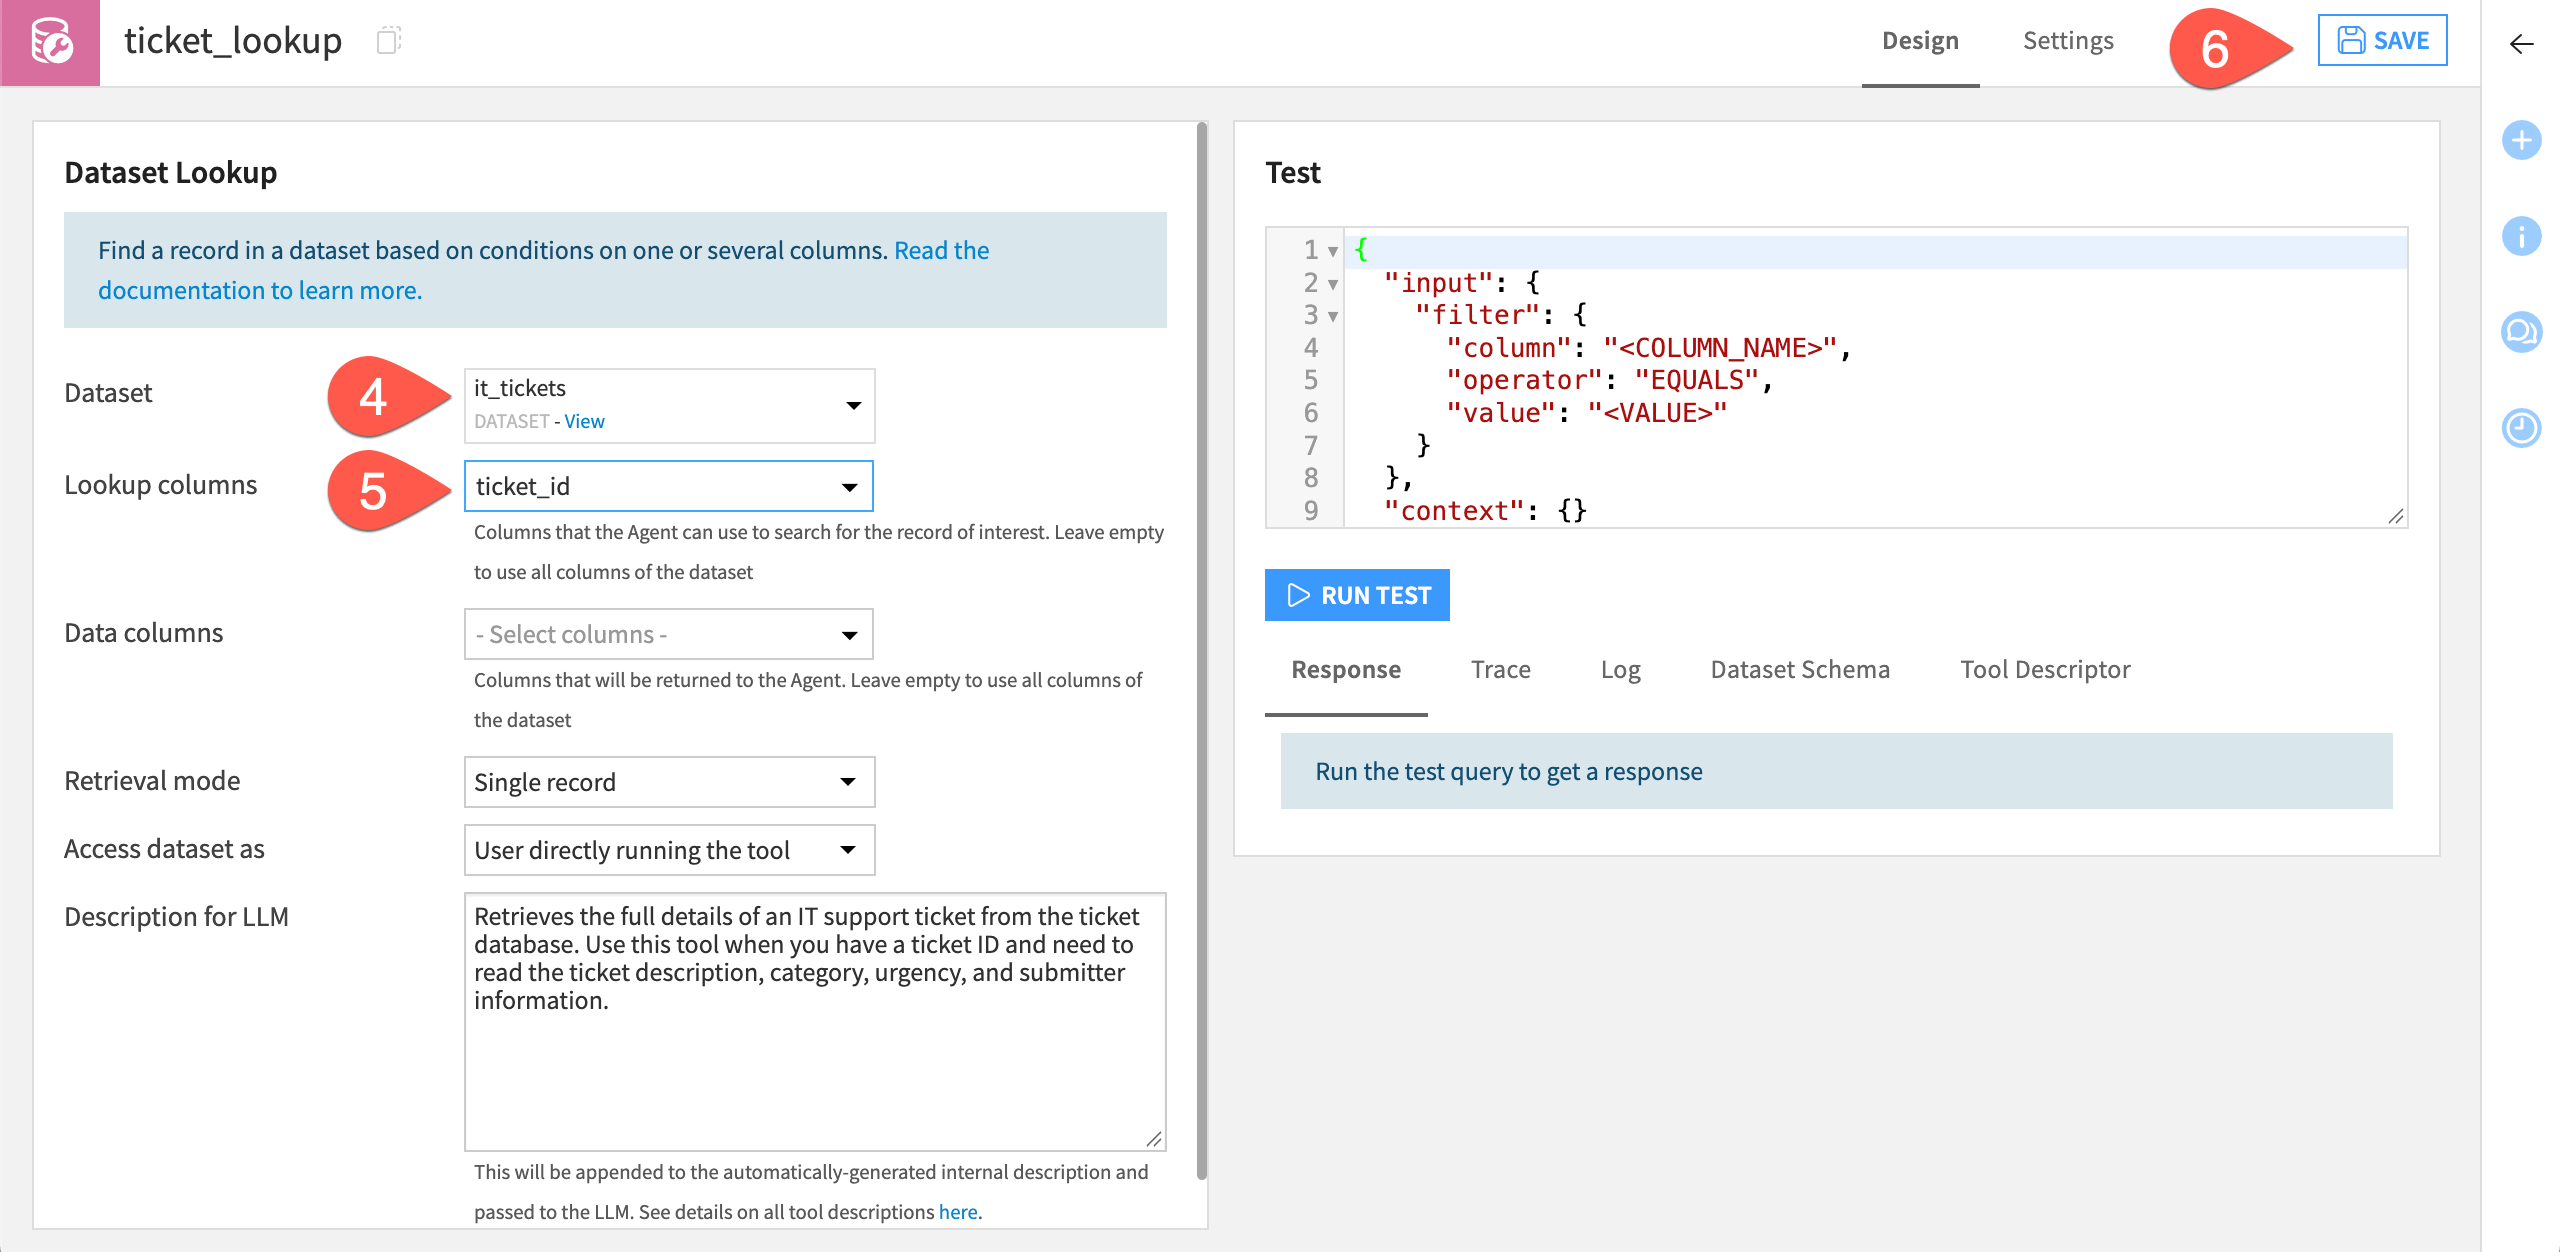
That should fix the tool error. Now return to the agent and test again.
Return to the agent (GenAI menu (
) > Agents, and open the agent).Click Reset on the Chat tab, then Confirm.
Make sure the Debugger checkbox is enabled.
Send the message
TKT-1042.Review the timeline by clicking on the dropdown arrow next to the fetch_ticket_data block in the chat response. You should see a warning and another failure of the tool call.
Click on the failed tool call to open the debugger panel.
Review the Tool Output and note the message.
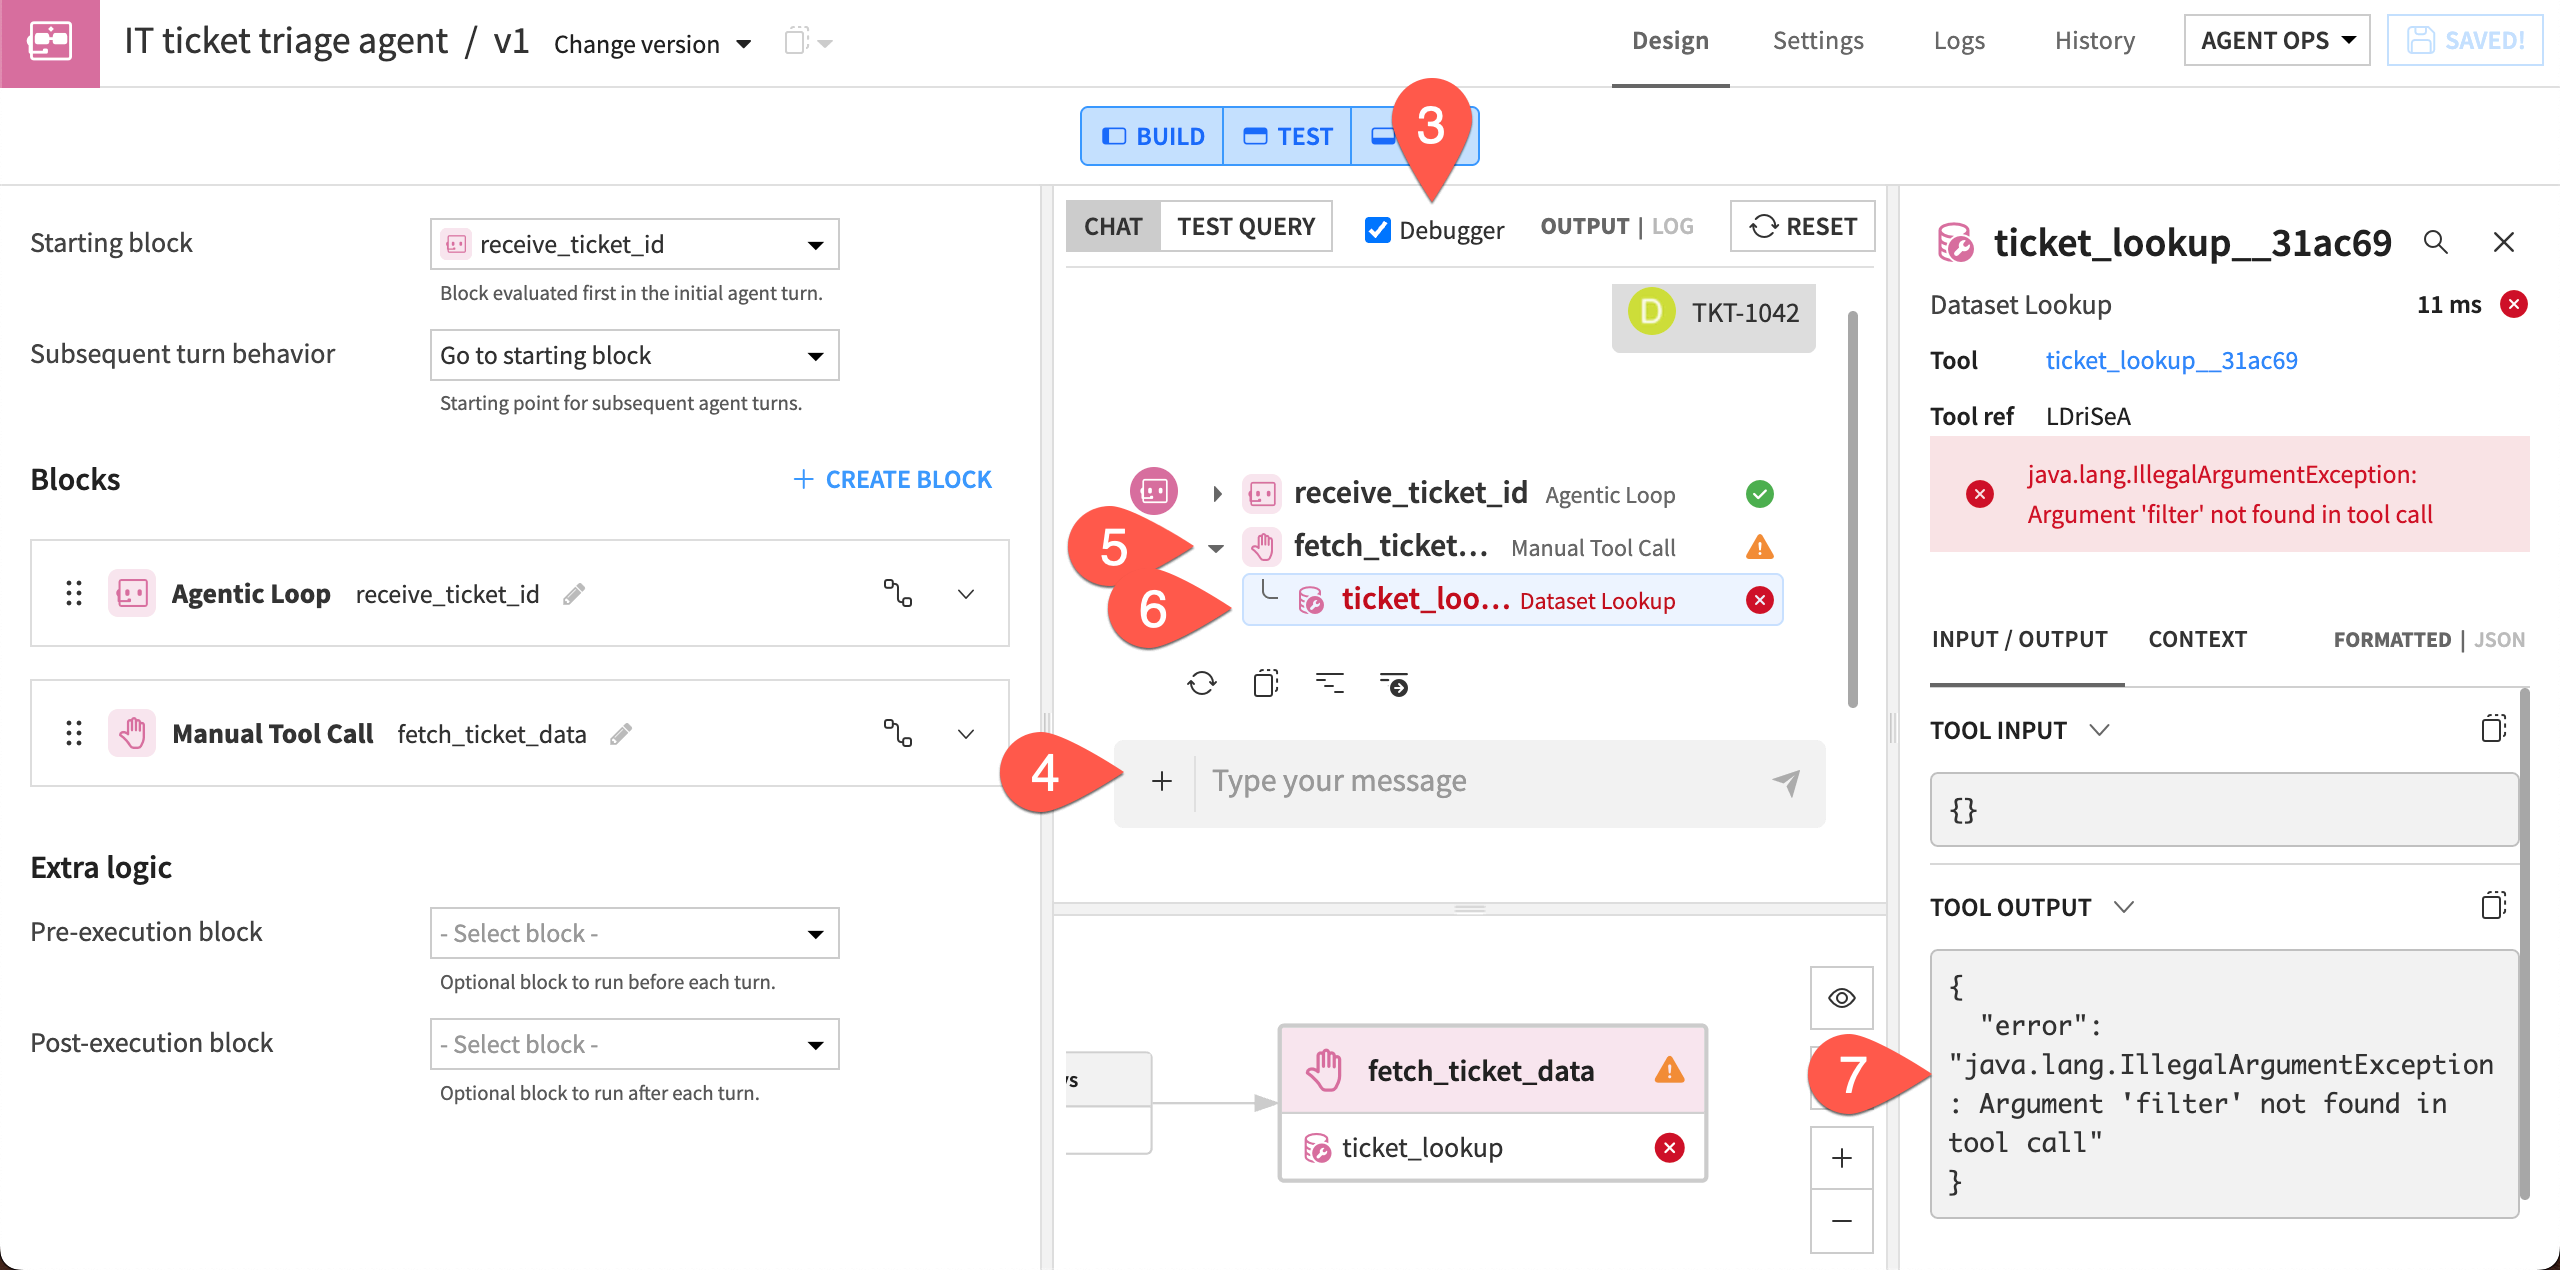
This time, the tool call has failed because there is no filter set in the block. The block needs a filter so the agent saves only the relevant data for the ticket at hand.
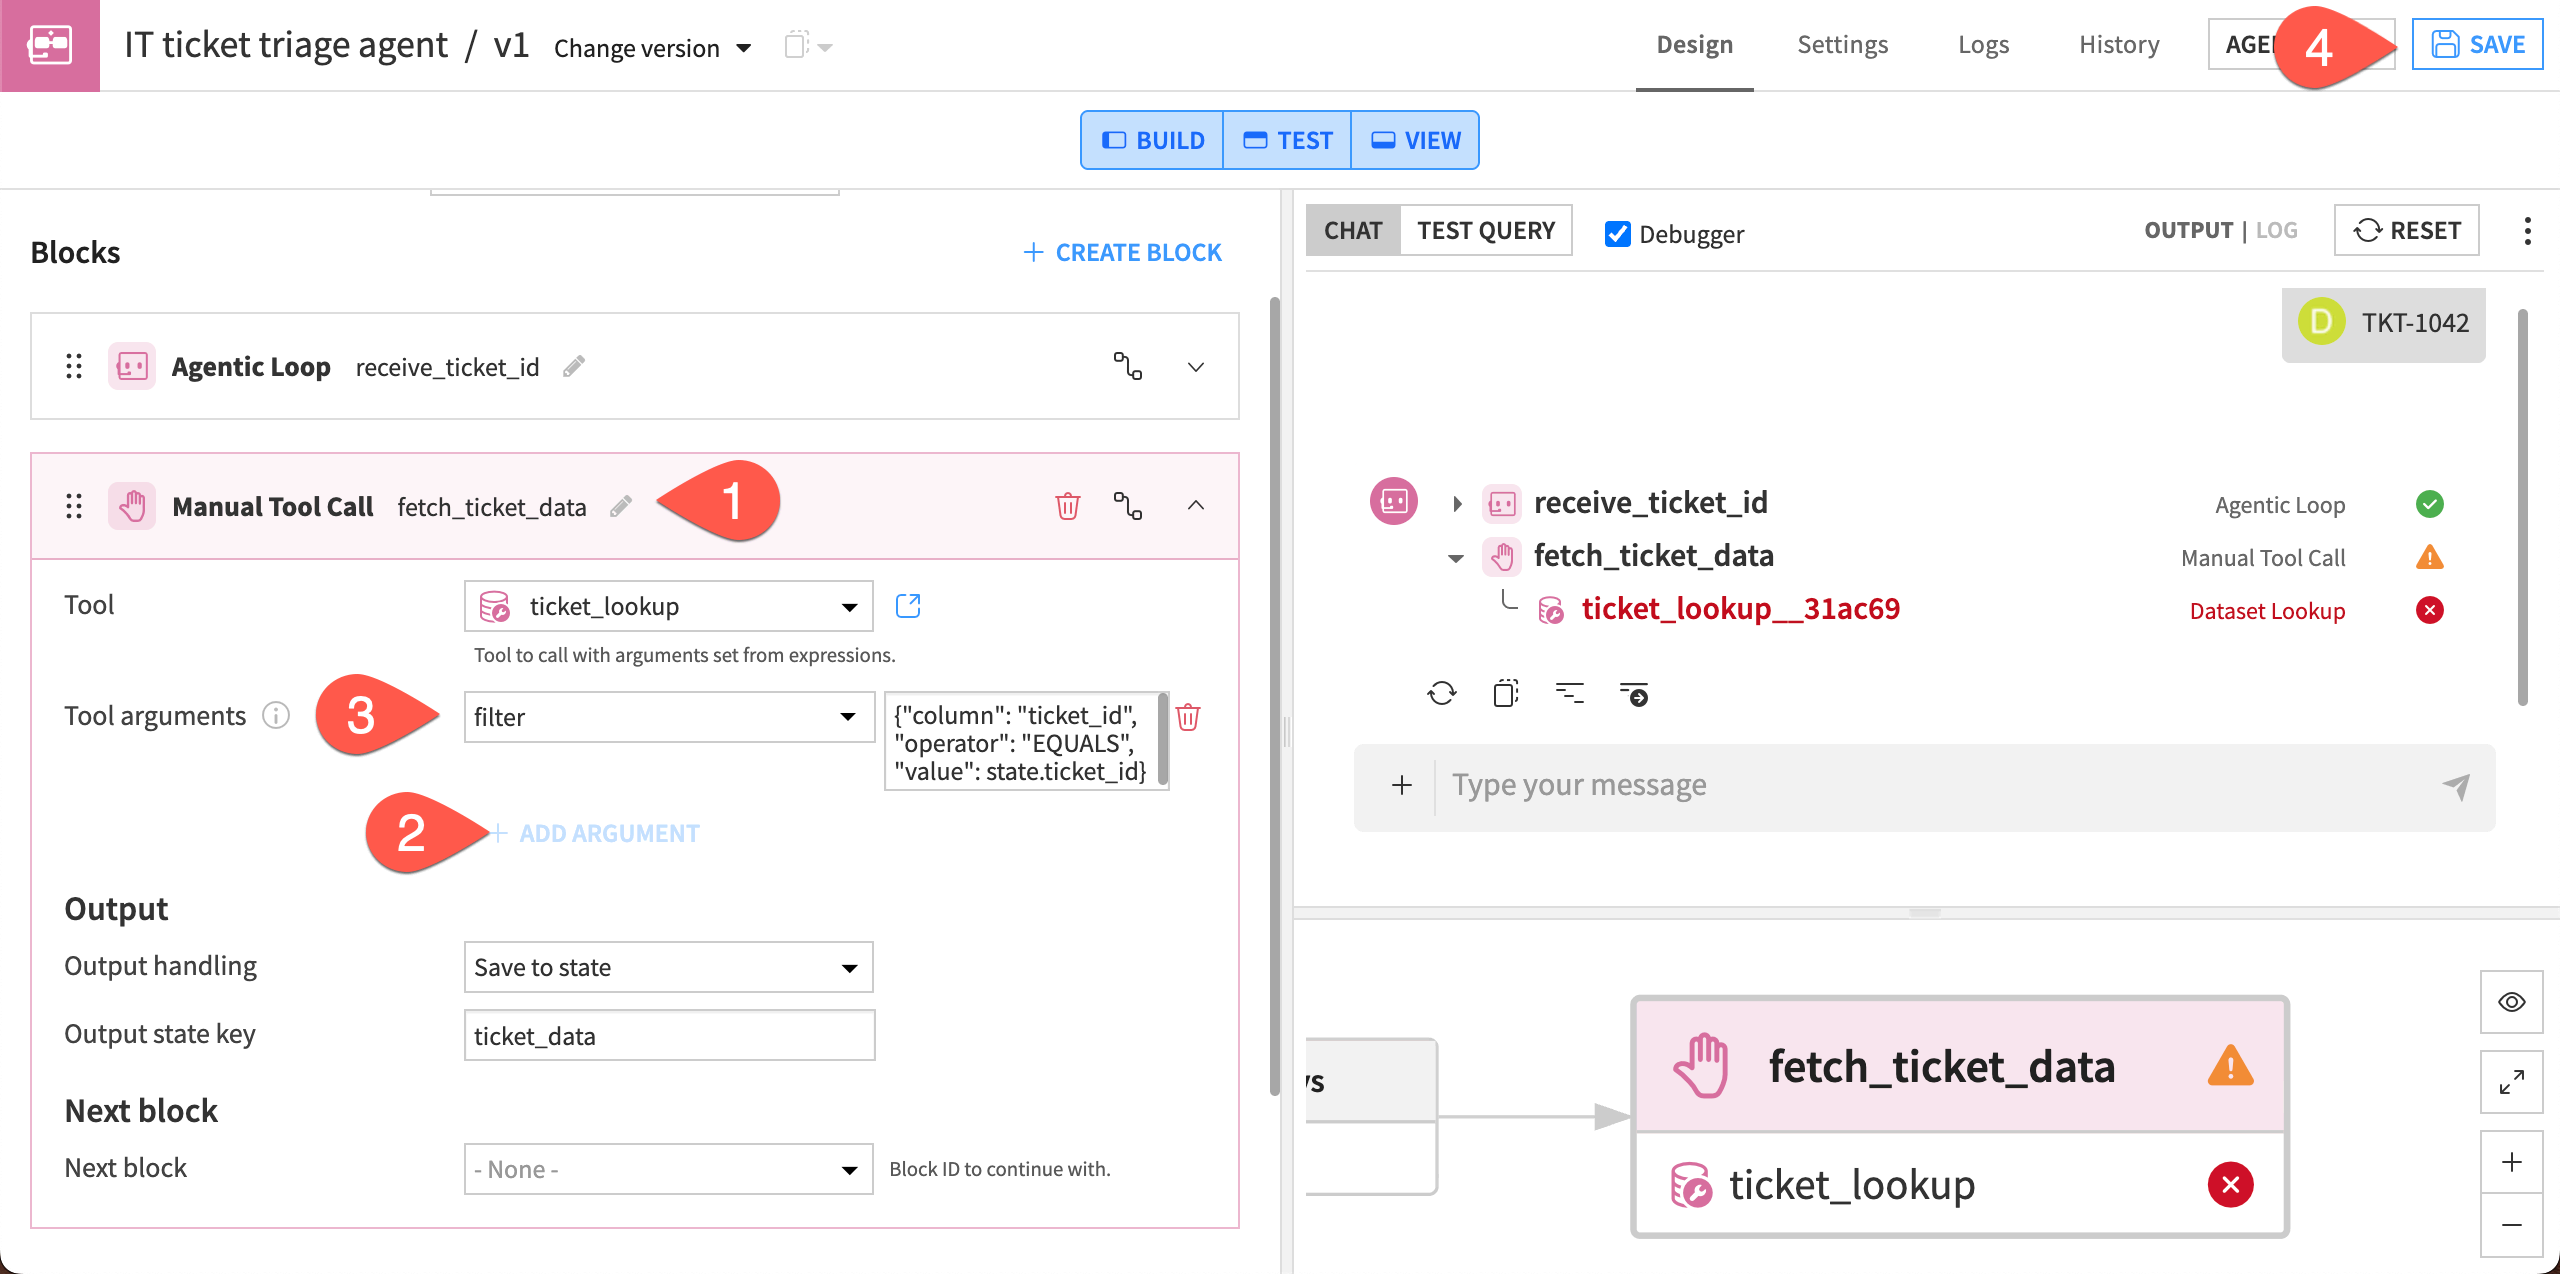
Return to the fetch_ticket_data block in the agent builder.
Next to Tool arguments, click + Add Argument.
Add the following CEL expression:
{"column": "ticket_id", "operator": "EQUALS", "value": state.ticket_id}
Click Save.
Tip
As you move between areas in the agent editor, you can resize the panes so it is easier to view and edit the agent. You can also use the Build, Test and View buttons to select only certain panes.
The filter means the agent will save only information about the given ticket. Now test the agent again.
Reset the chat and send
TKT-1042.As the agent processes the request, watch its reasoning in the timeline.
After the agent finishes, you should see green checkmarks indicating that both blocks and the tool have successfully executed.
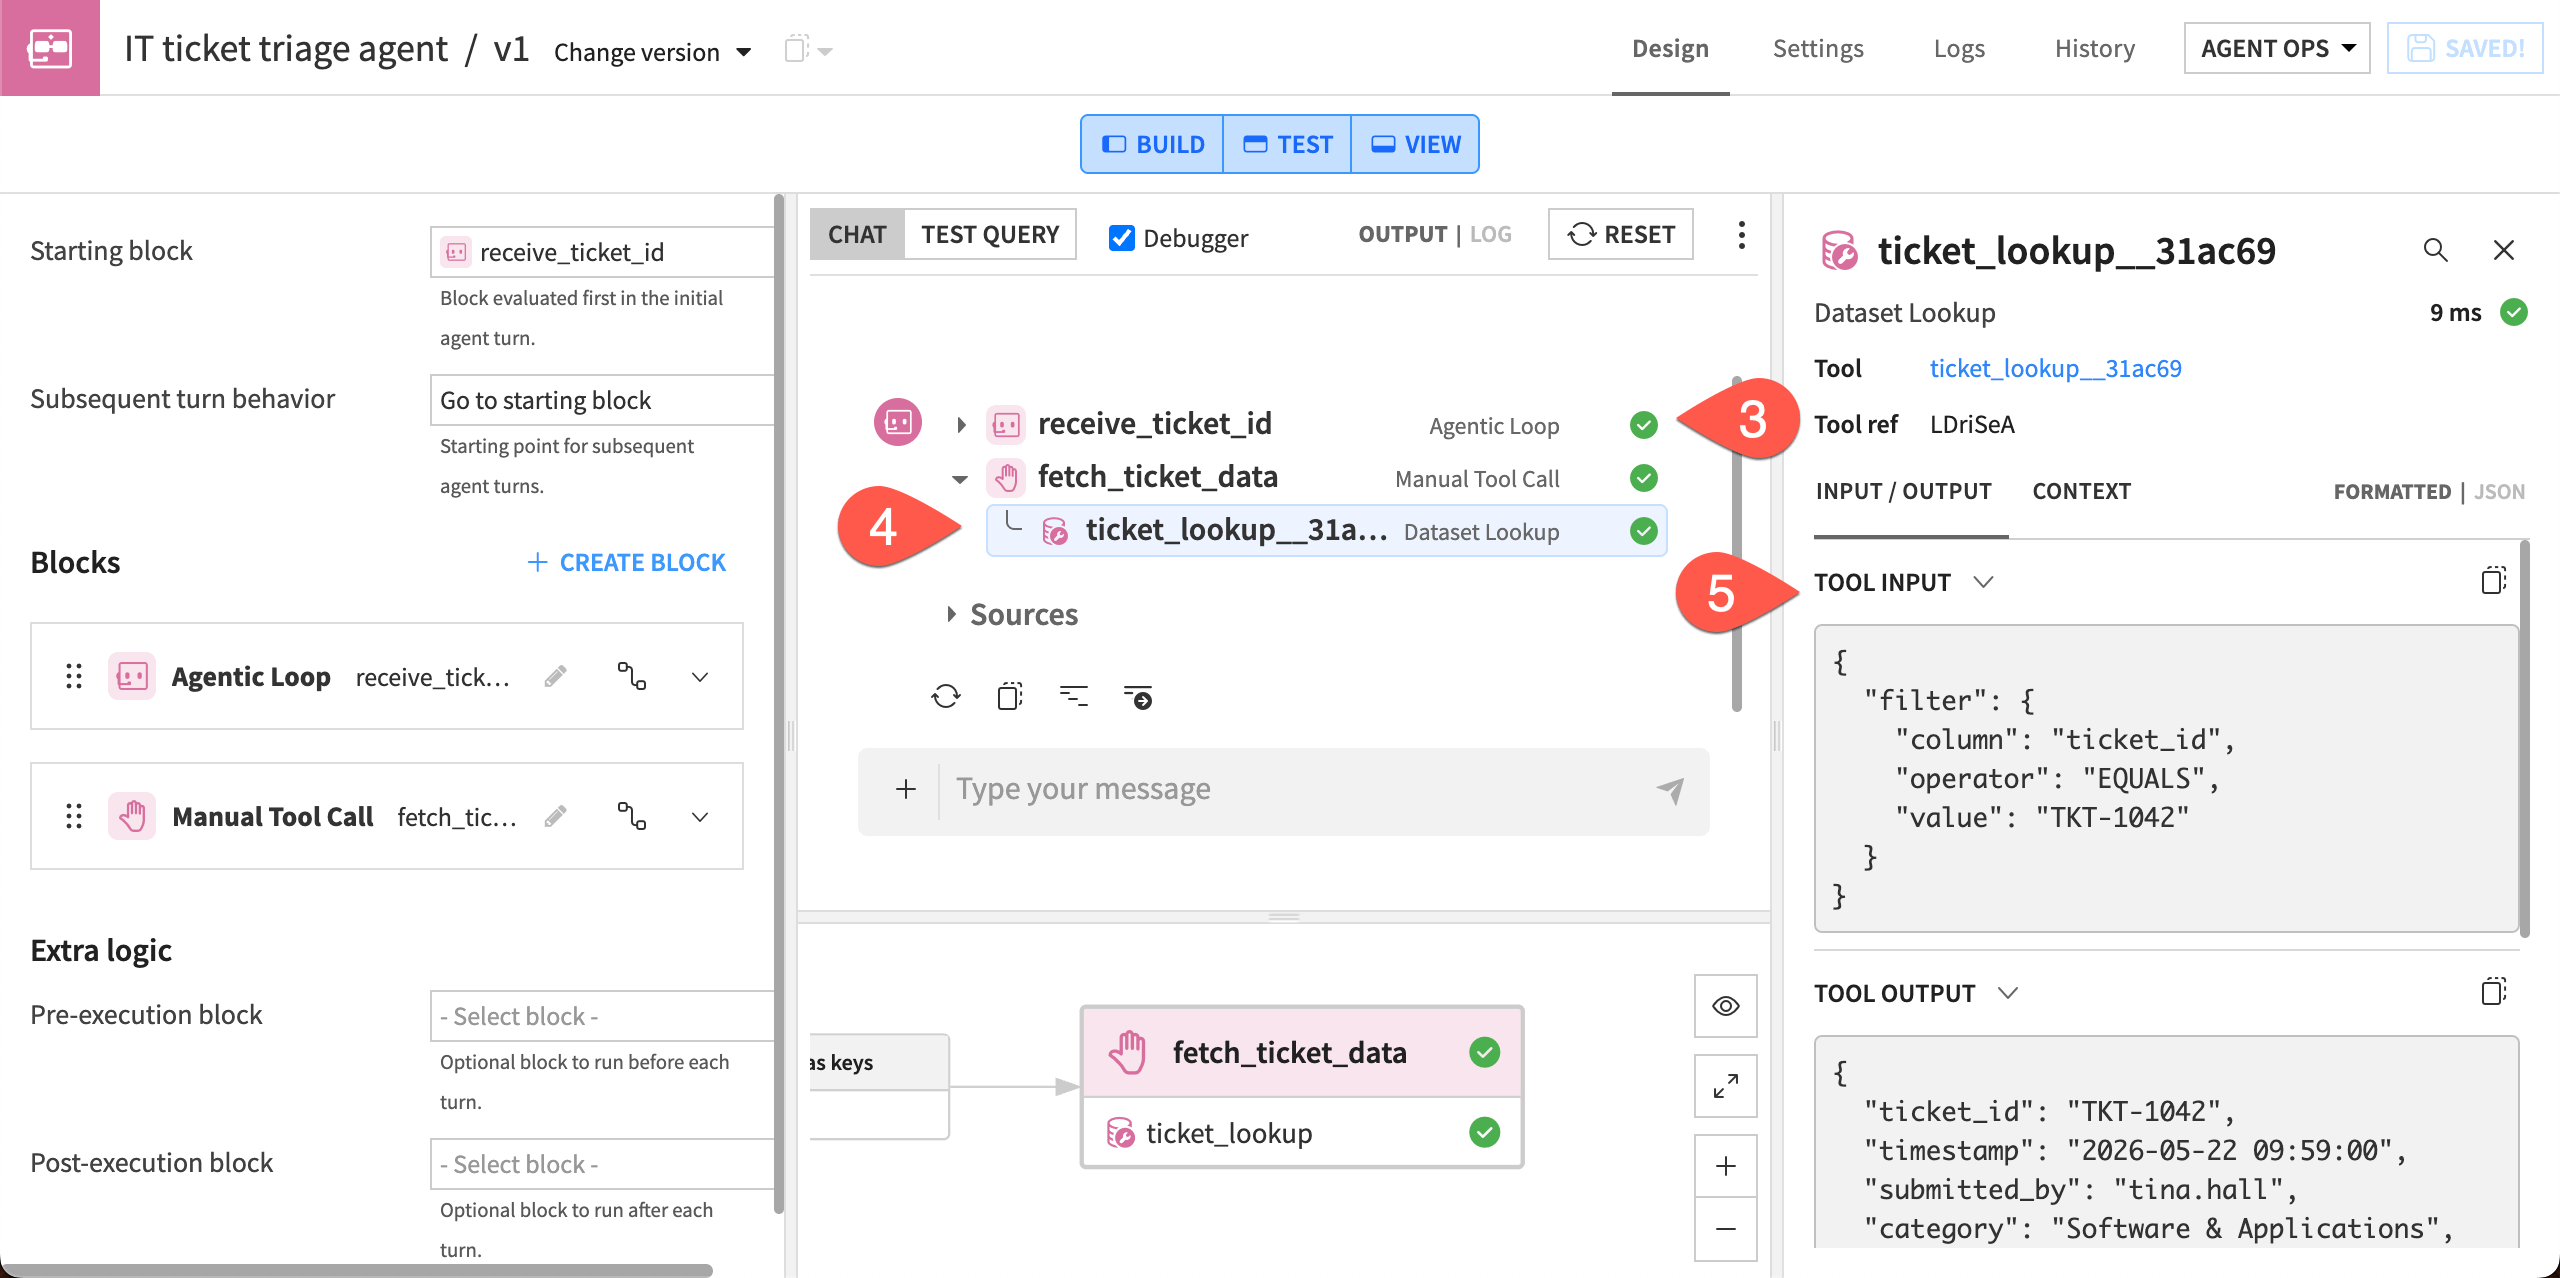
Click the dropdown arrow on the fetch_ticket_data and click on the ticket_lookup tool to view the debugger panel.
In the panel, note the Input/Output tab showing the chat messages and input from the tool.
Important
Results in this tutorial are heavily dependent on which LLM you use. You are likely to see different replies than those shown here, and you might even see different results in every run.
If you have access to multiple LLMs, it can be useful to experiment with different models to compare results.
Track memory across the agent#
Each of the first two blocks saves some information about the given ticket into a temporary memory called state.
The debugger lets you track what information is saved to the state and another type of temporary memory called scratchpad. In this section, you’ll practice tracking memory changes through the agent.
View context#
In the timeline from the last run, click on the receive_ticket_id block and view the debugger panel.
Click on the Context tab. You should see that the block added a value to
state.ticket_id.Next move in the timeline to the fetch_ticket_data block and view it in the debugger panel.
Click on the Context tab. You should see the
ticket_datavalues added as a long block of key-value pairs.
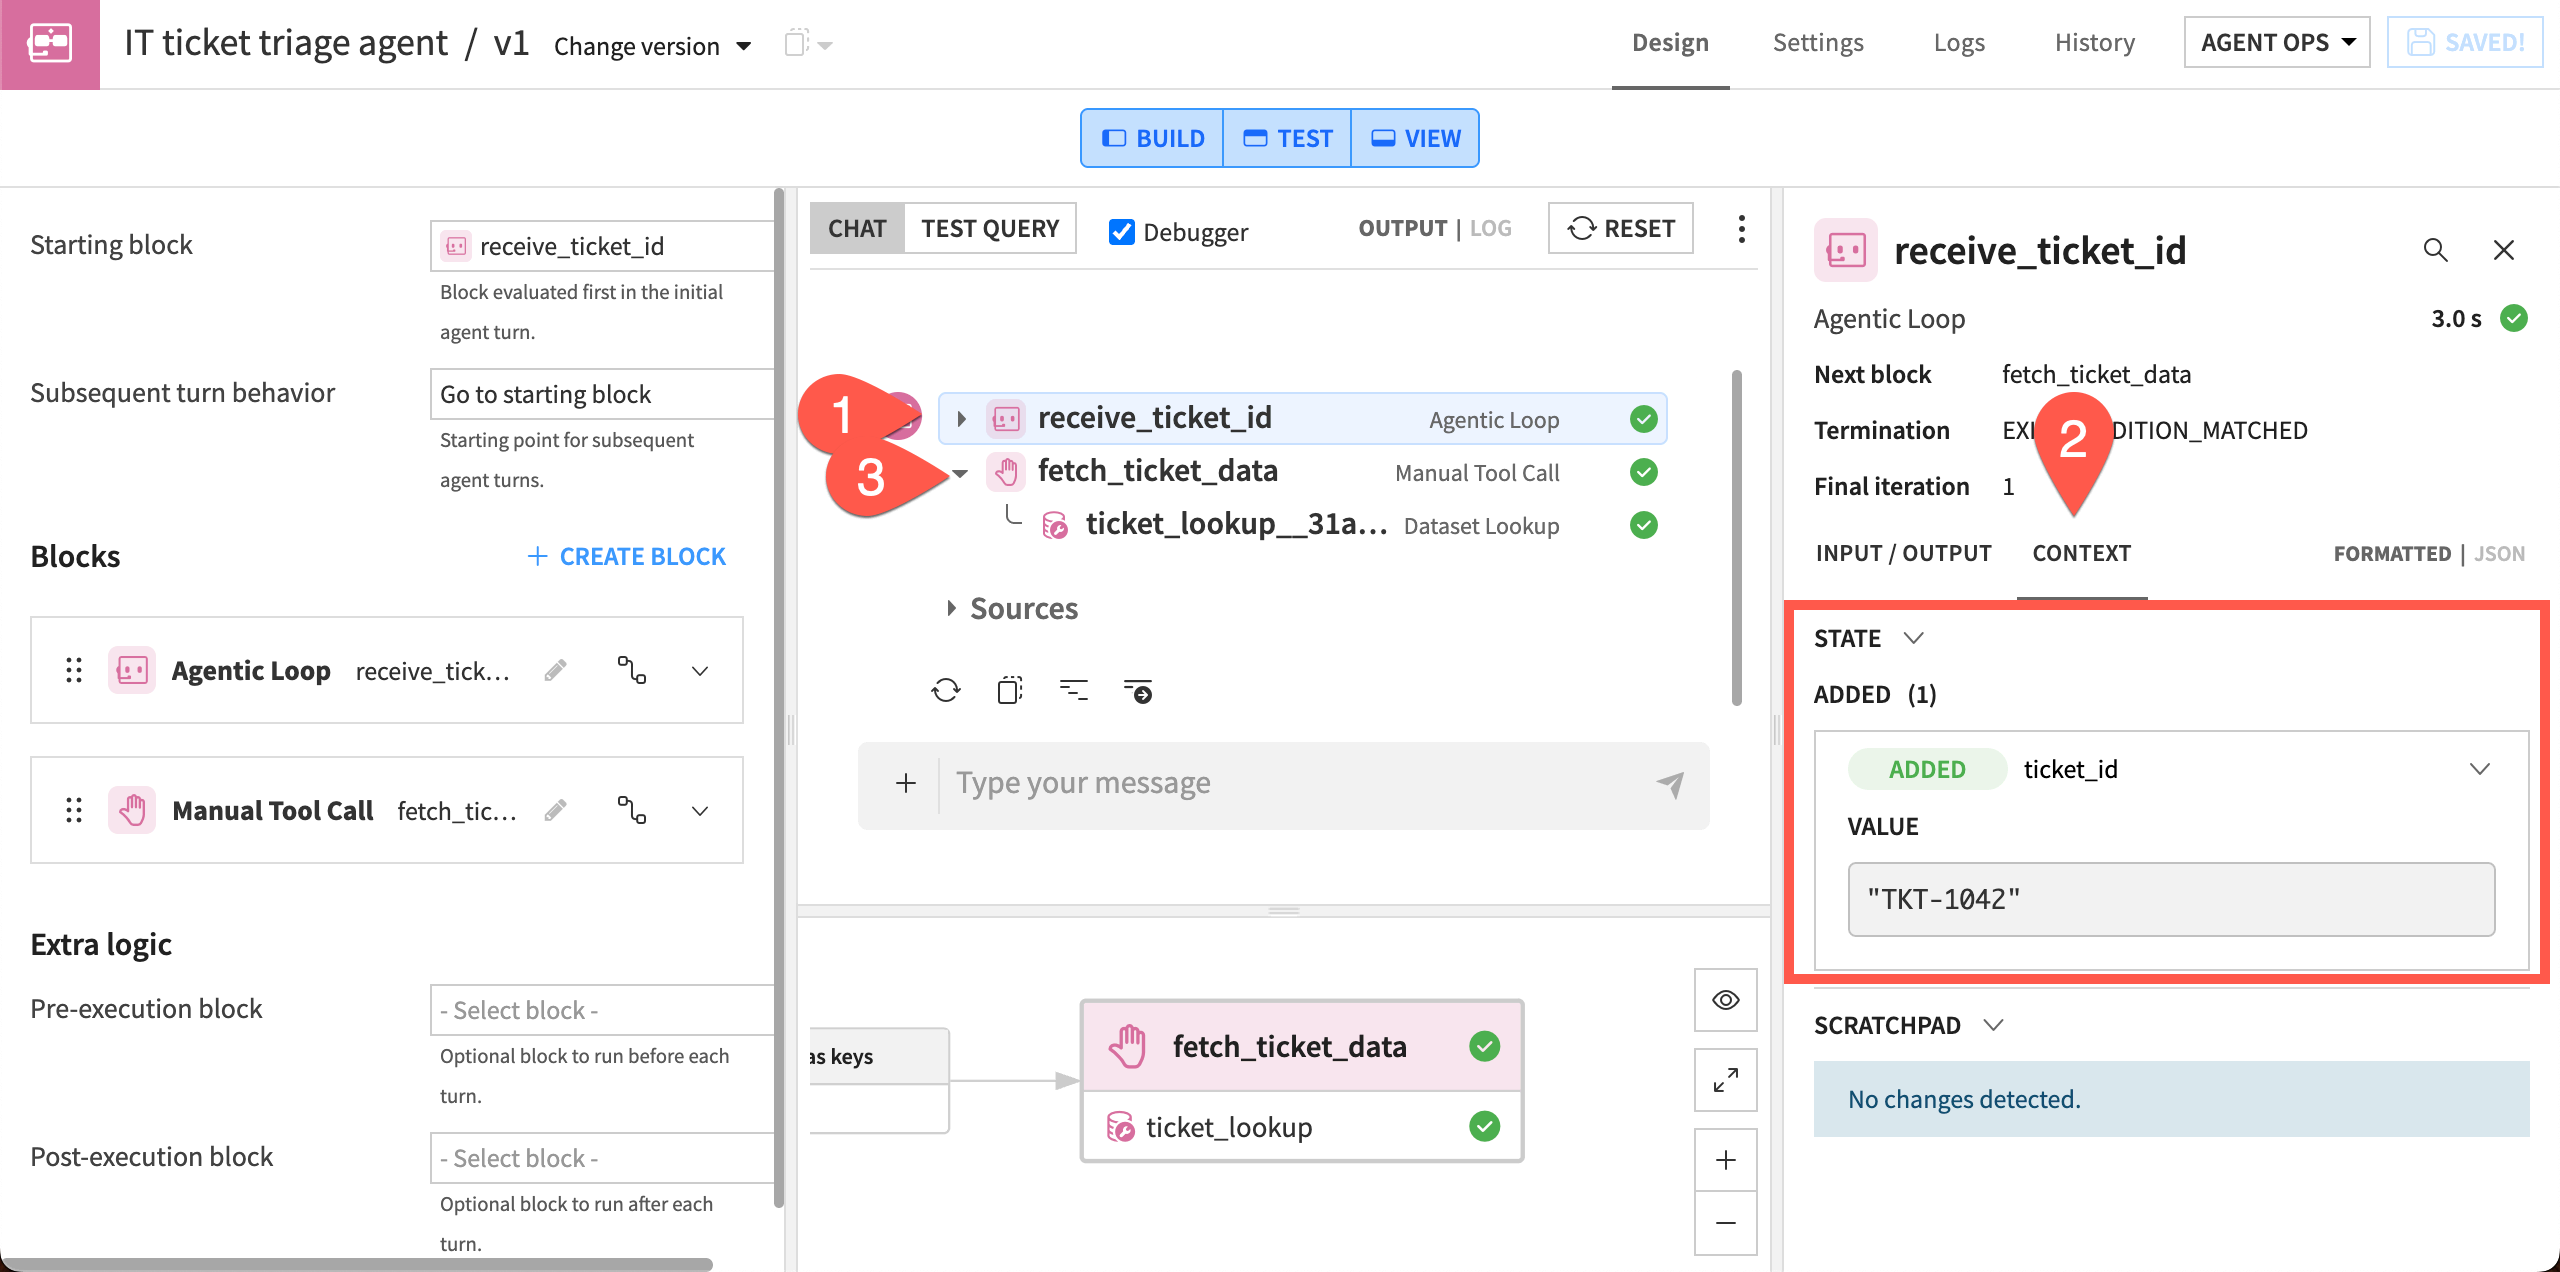
The fetch_ticket_data block saved the entire ticket data into state. You can also save some individual column values into state to make them easier to view in the debugger and use them later in the agent.
Create block 3: Save ticket details to state#
Adding a dedicated state-writing step makes the agent easier to debug because you can see the exact values stored at this point in the run before any further processing happens.
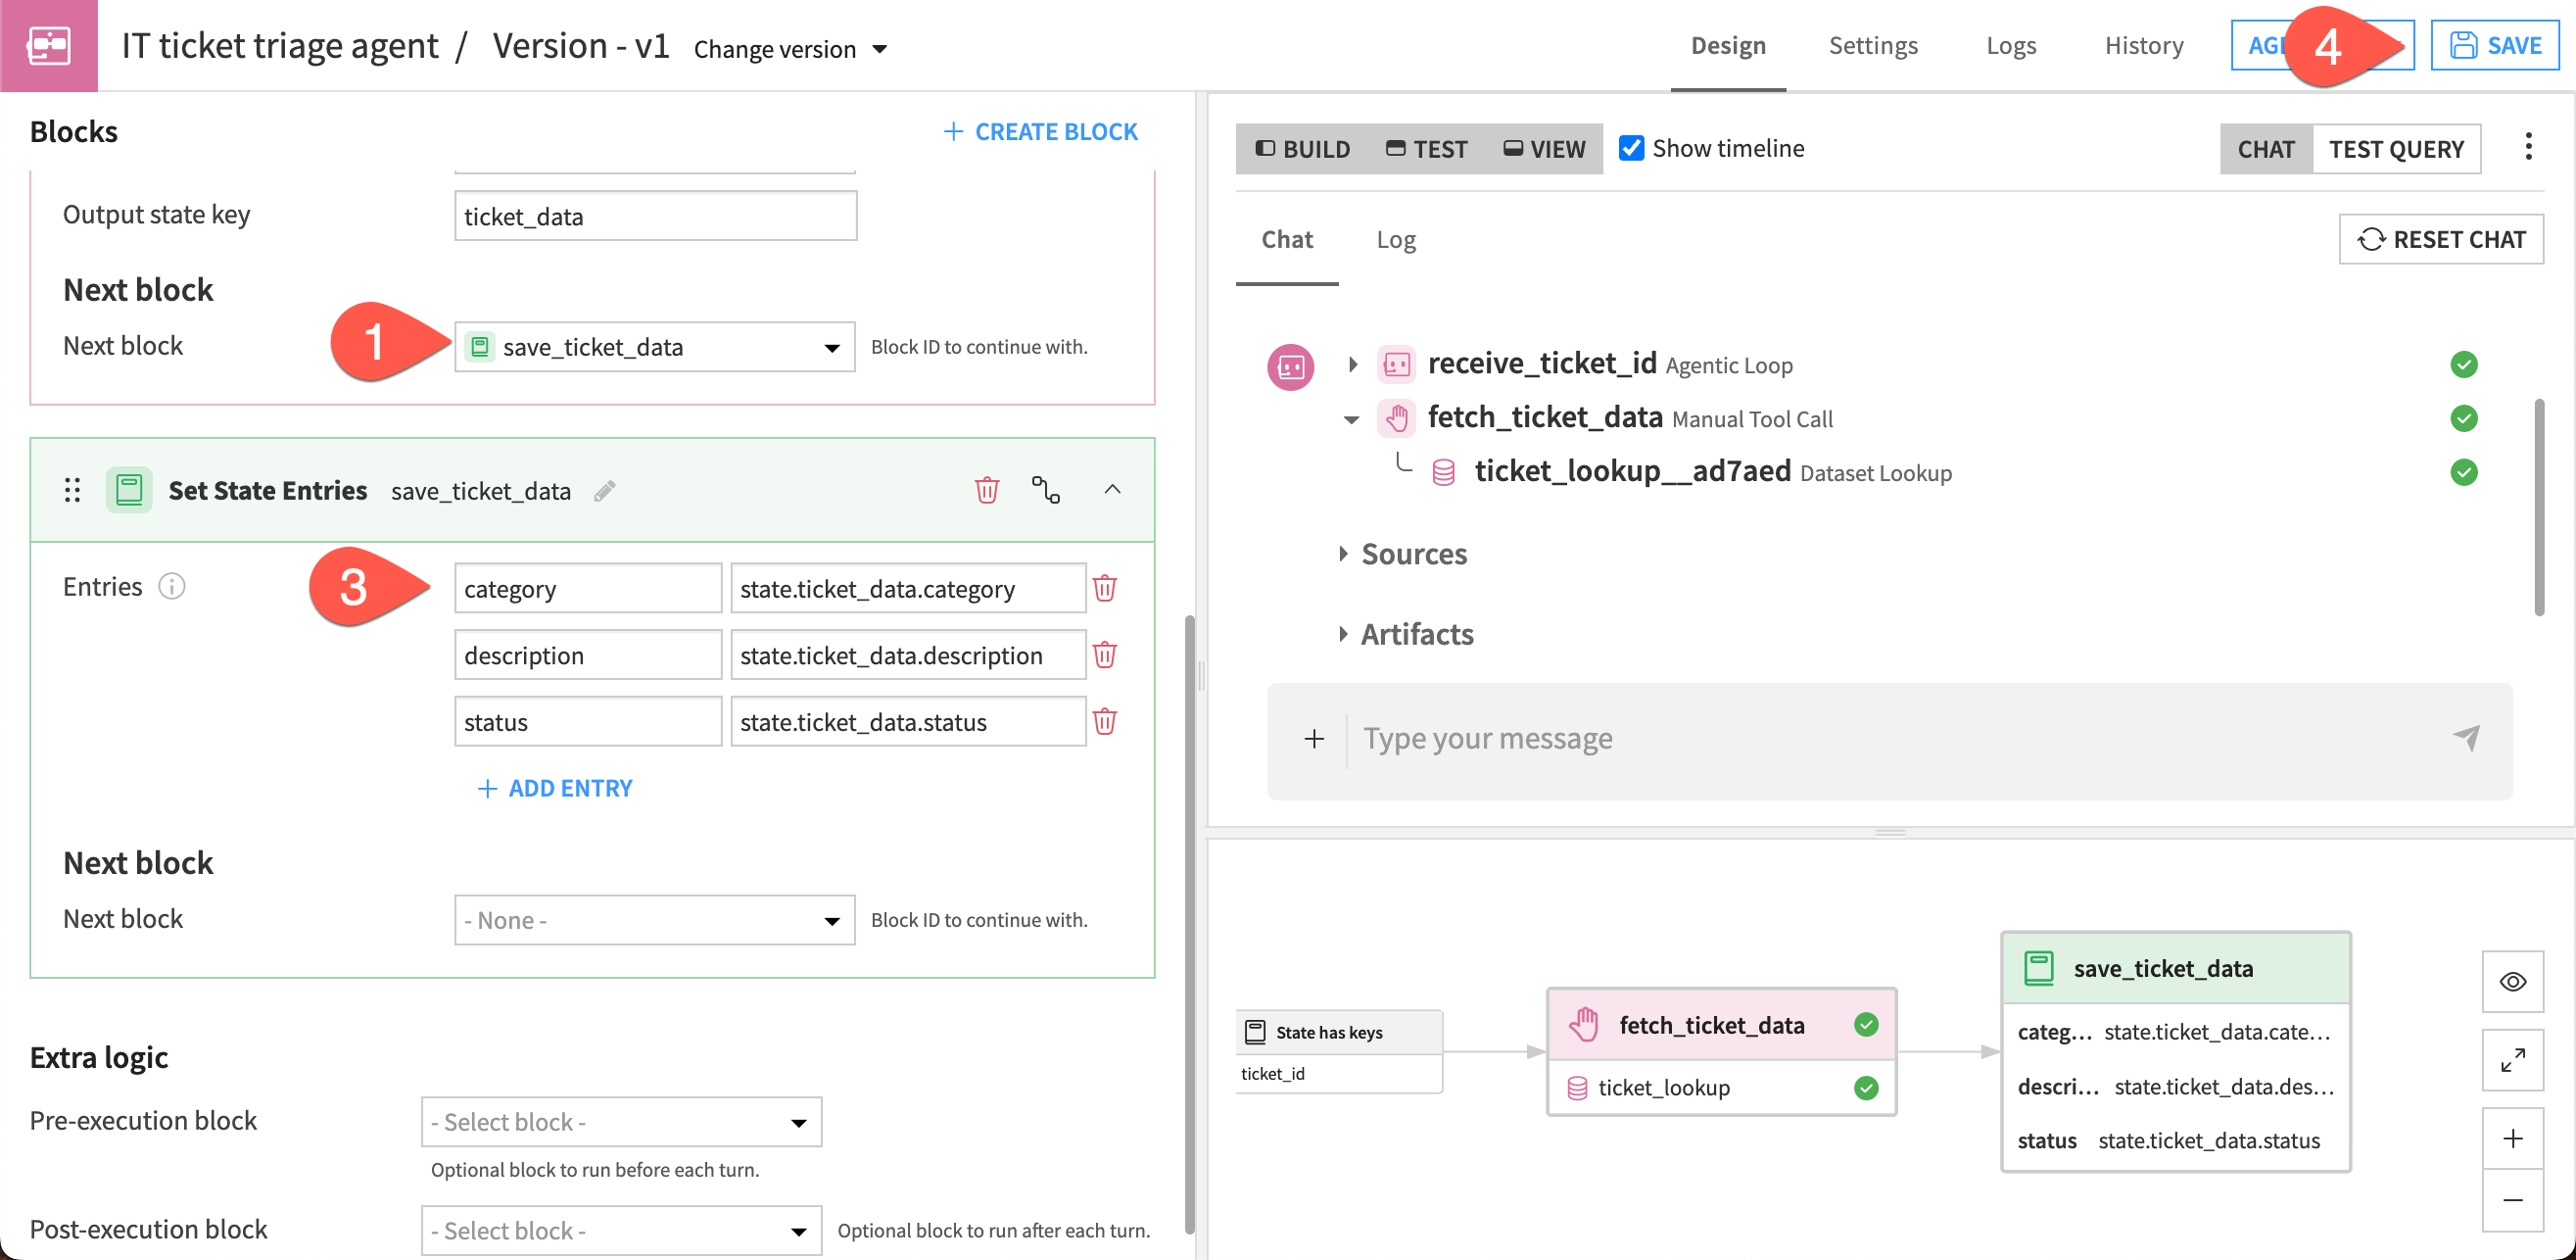
In the fetch_ticket_data block, under Next block, create a new next block.
Choose Set State Entries block, name it
save_ticket_data, and click Create.Add Entries for each of the following pairs:
State key |
CEL expression |
|---|---|
|
|
|
|
|
|
Click Save.
View context changes#
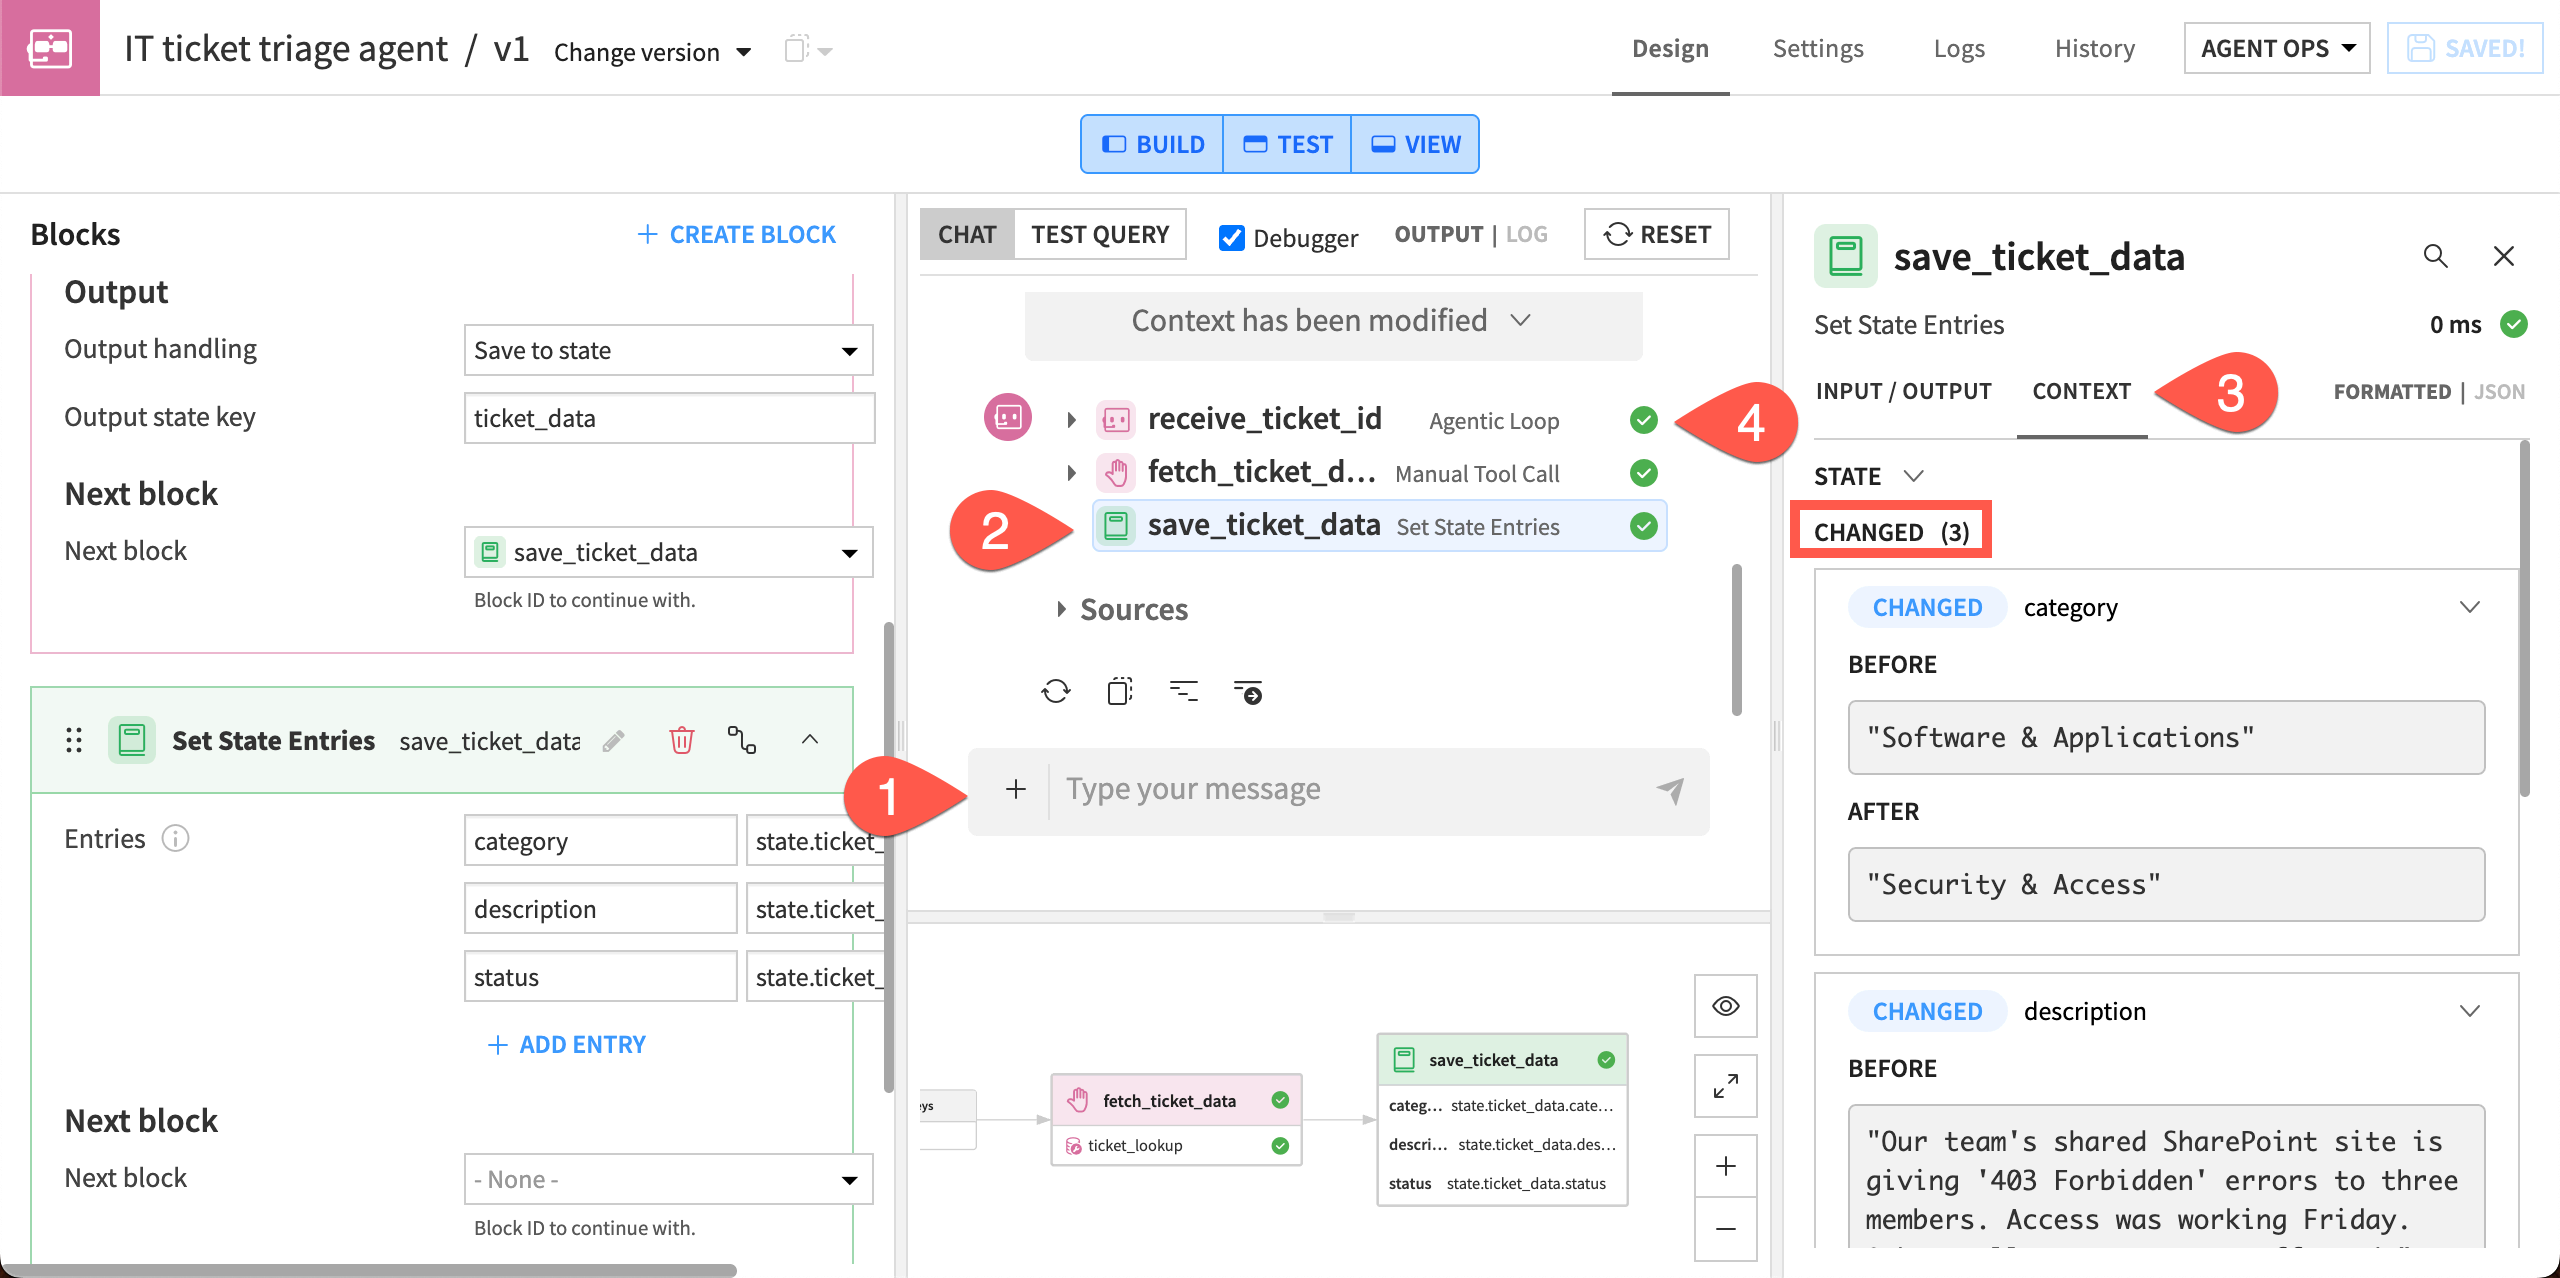
Now you can view the values the agent has gathered for these columns in the debugger.
Reset the chat, then send
TKT-1042.In the timeline, click on the save_ticket_data block.
In the debugger panel, click on Context. You should see the values added for each of the columns.
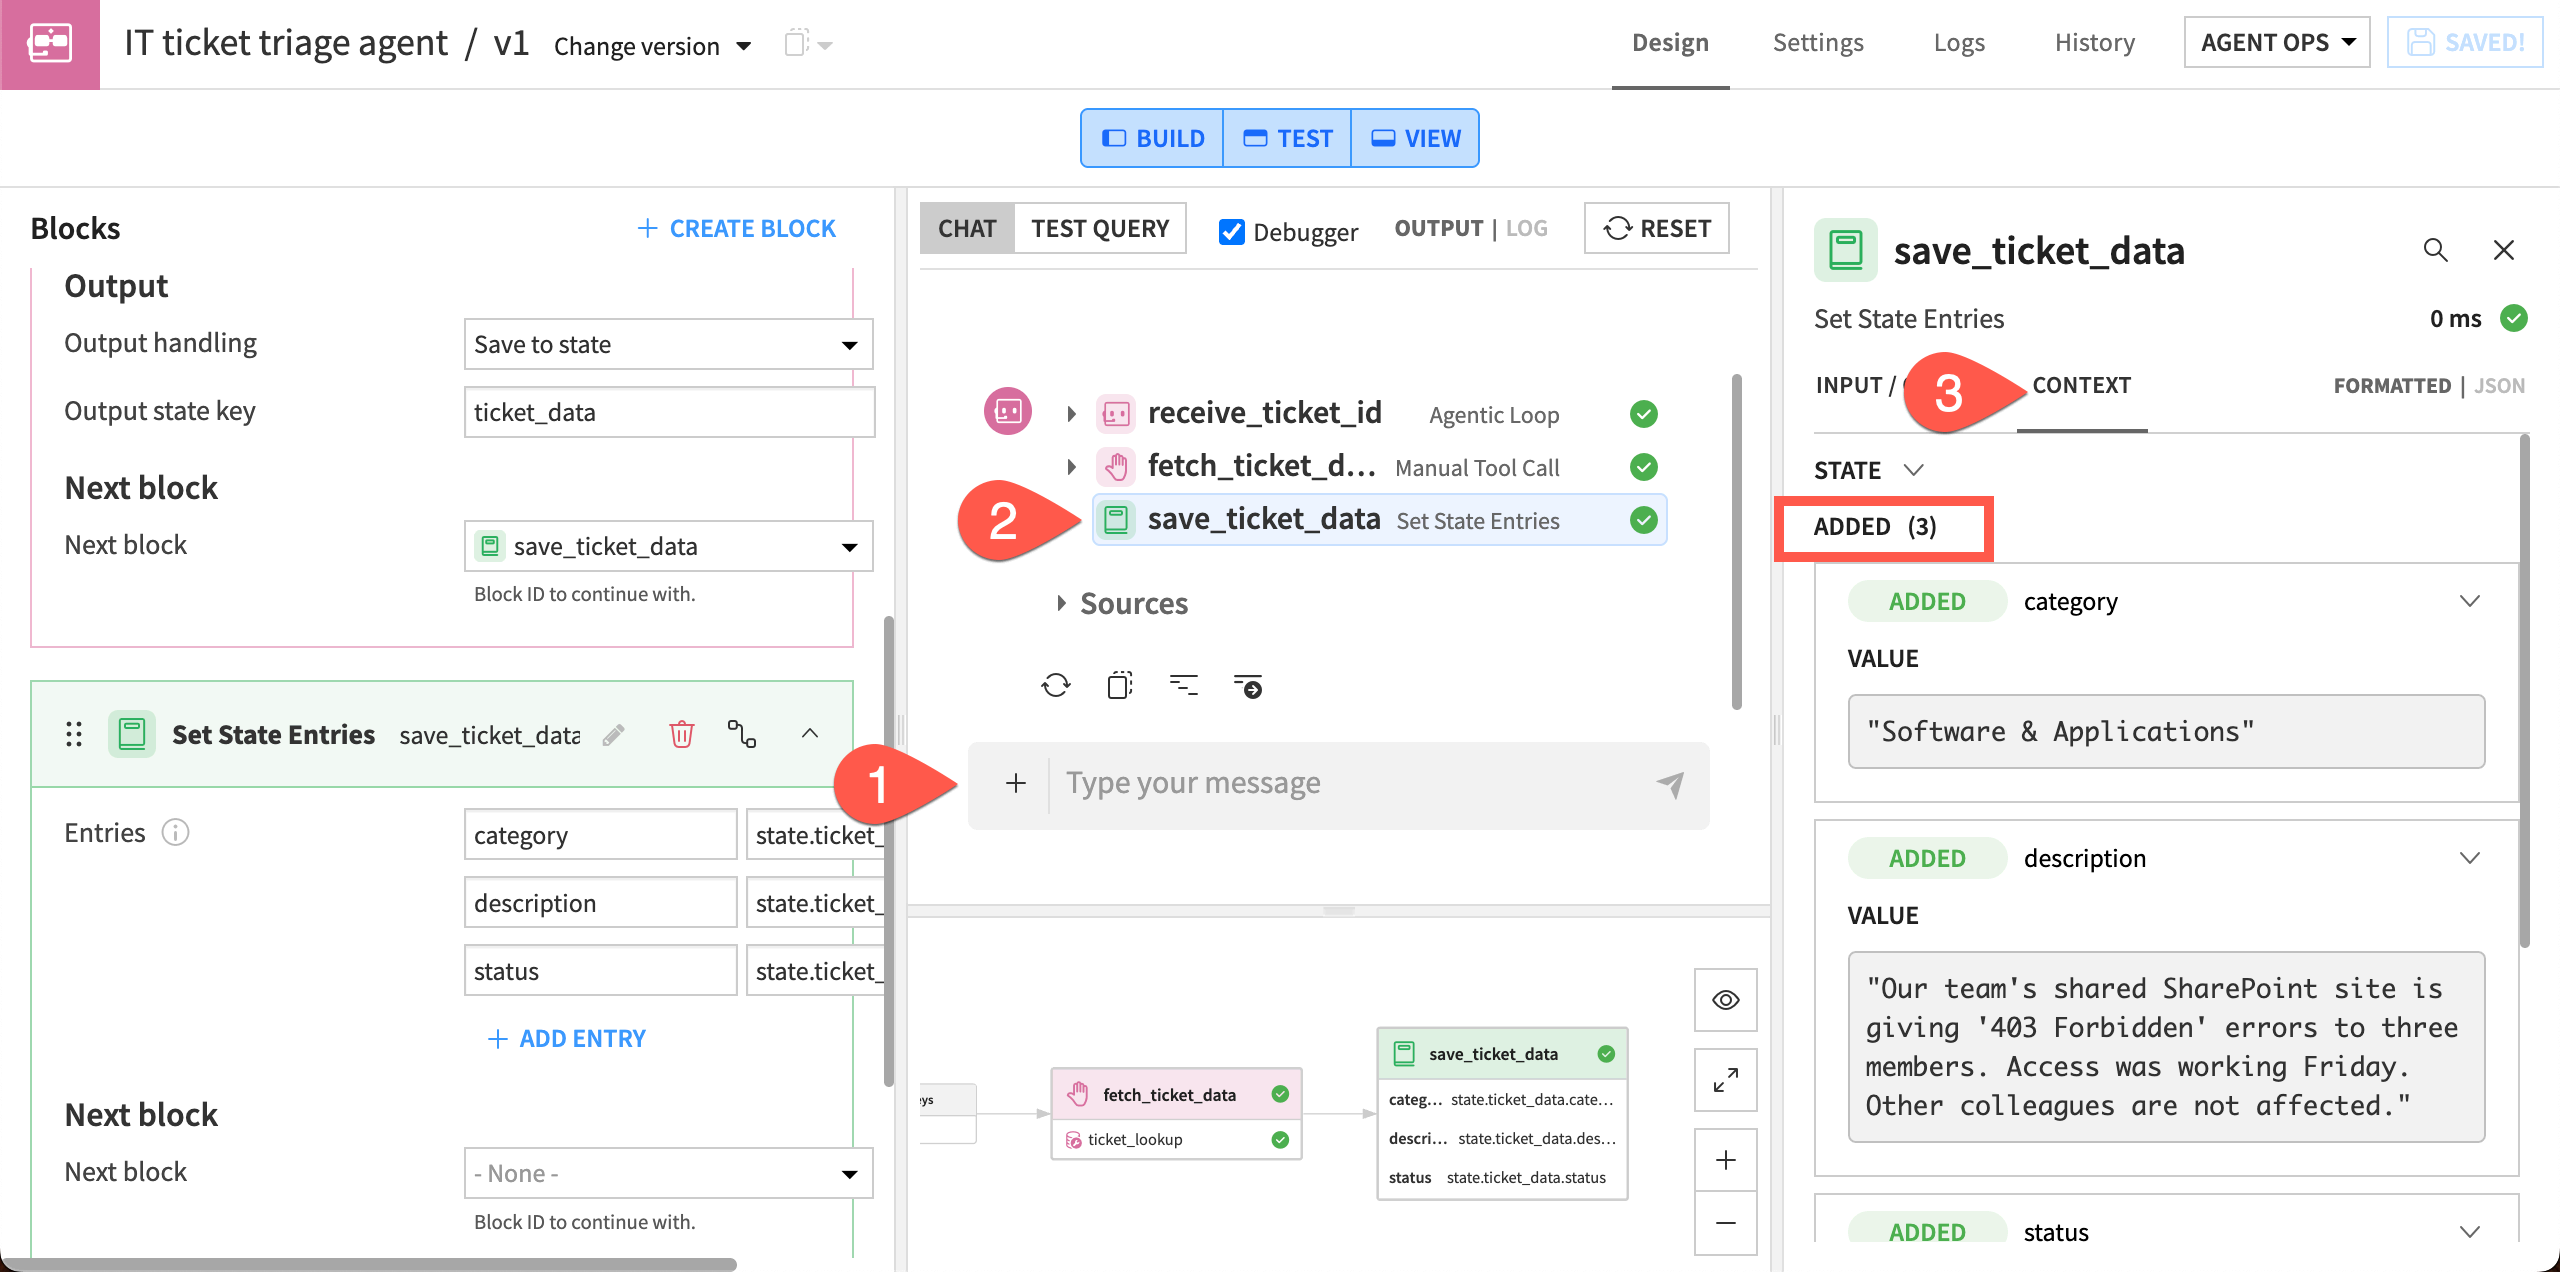
So far, you have reset the chat each time you use it. The debugger can also track changes in the context if you look up multiple tickets in the same chat.
In the chat, send
TKT-1001(without resetting the chat).In the timeline, click on the save_ticket_data block.
In the debugger panel, click on Context. This time, you should see that three of the values have changed.
Back in the timeline, click on the receive_ticket_id block and view the context in the debugger panel.
Note that the ticket_id saved to state has also changed.
Inspect agent execution#
The final block in this agent will classify the urgency of the IT ticket. Then you can view the logic and steps the agent takes in a full test run.
Create block 4: Make a decision#
This block will act on detailed instructions about classifying the IT tickets.
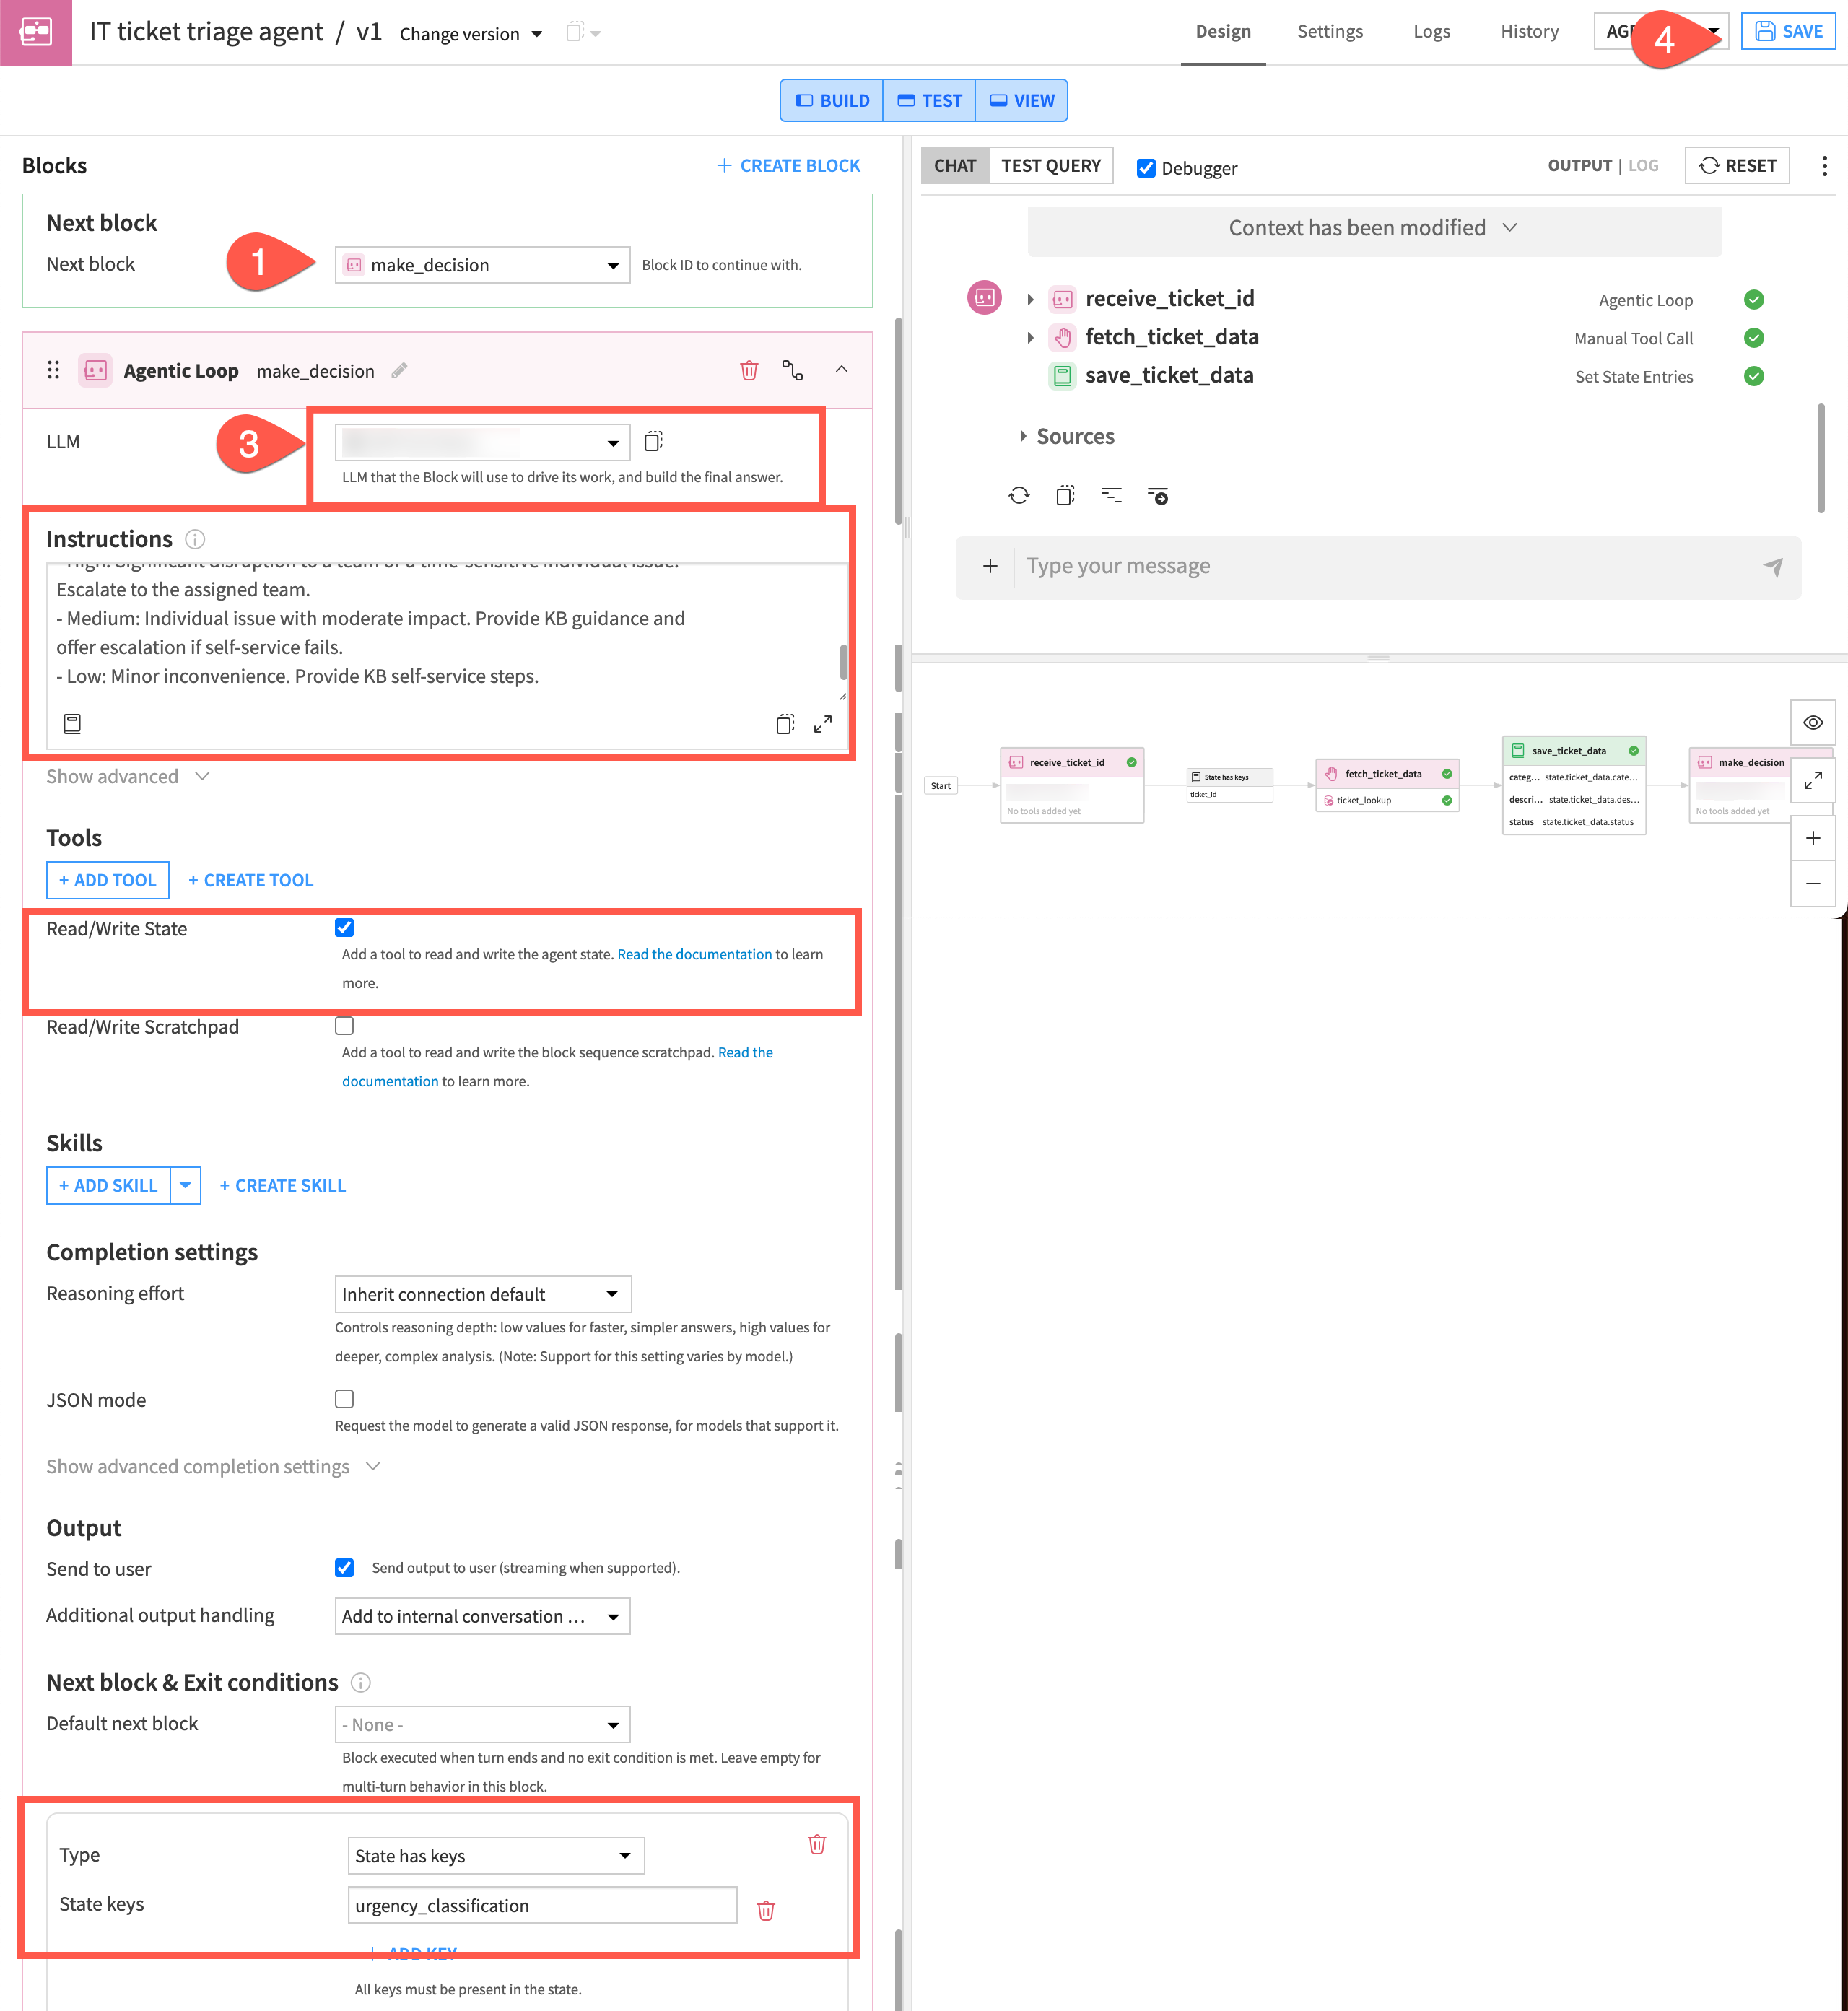
From the save_ticket_data block, create a next block.
Choose Agentic Loop, name it
make_decision, and click Create.Configure the following settings in the block:
Choose an LLM. The agent will perform best if you use the same LLM as the other Agentic Loop block.
In Instructions, copy and paste:
You are an IT support triage assistant. You will classify the urgency of a ticket based on the data saved in {state.ticket_data}.

Classify the ticket's urgency based on the description and any scope indicators present (such as number of users affected, revenue impact, security implications, or production system involvement).

Urgency levels:
- Critical: Affects many users, involves production systems, revenue loss, or
security breach. Requires immediate escalation. Do not attempt self-service.
- High: Significant disruption to a team or a time-sensitive individual issue.
Escalate to the assigned team.
- Medium: Individual issue with moderate impact. Provide KB guidance and
offer escalation if self-service fails.
- Low: Minor inconvenience. Provide KB self-service steps.

Save your classification to state as urgency_classification.
Under Tools, check the box for Read/Write State.
Under Next block & Exit conditions, add an exit condition of State has keys and add the State keys
urgency_classification.
Click Save.
Test block 4#
As you test the final block, use the debugger to inspect the agent’s activity.
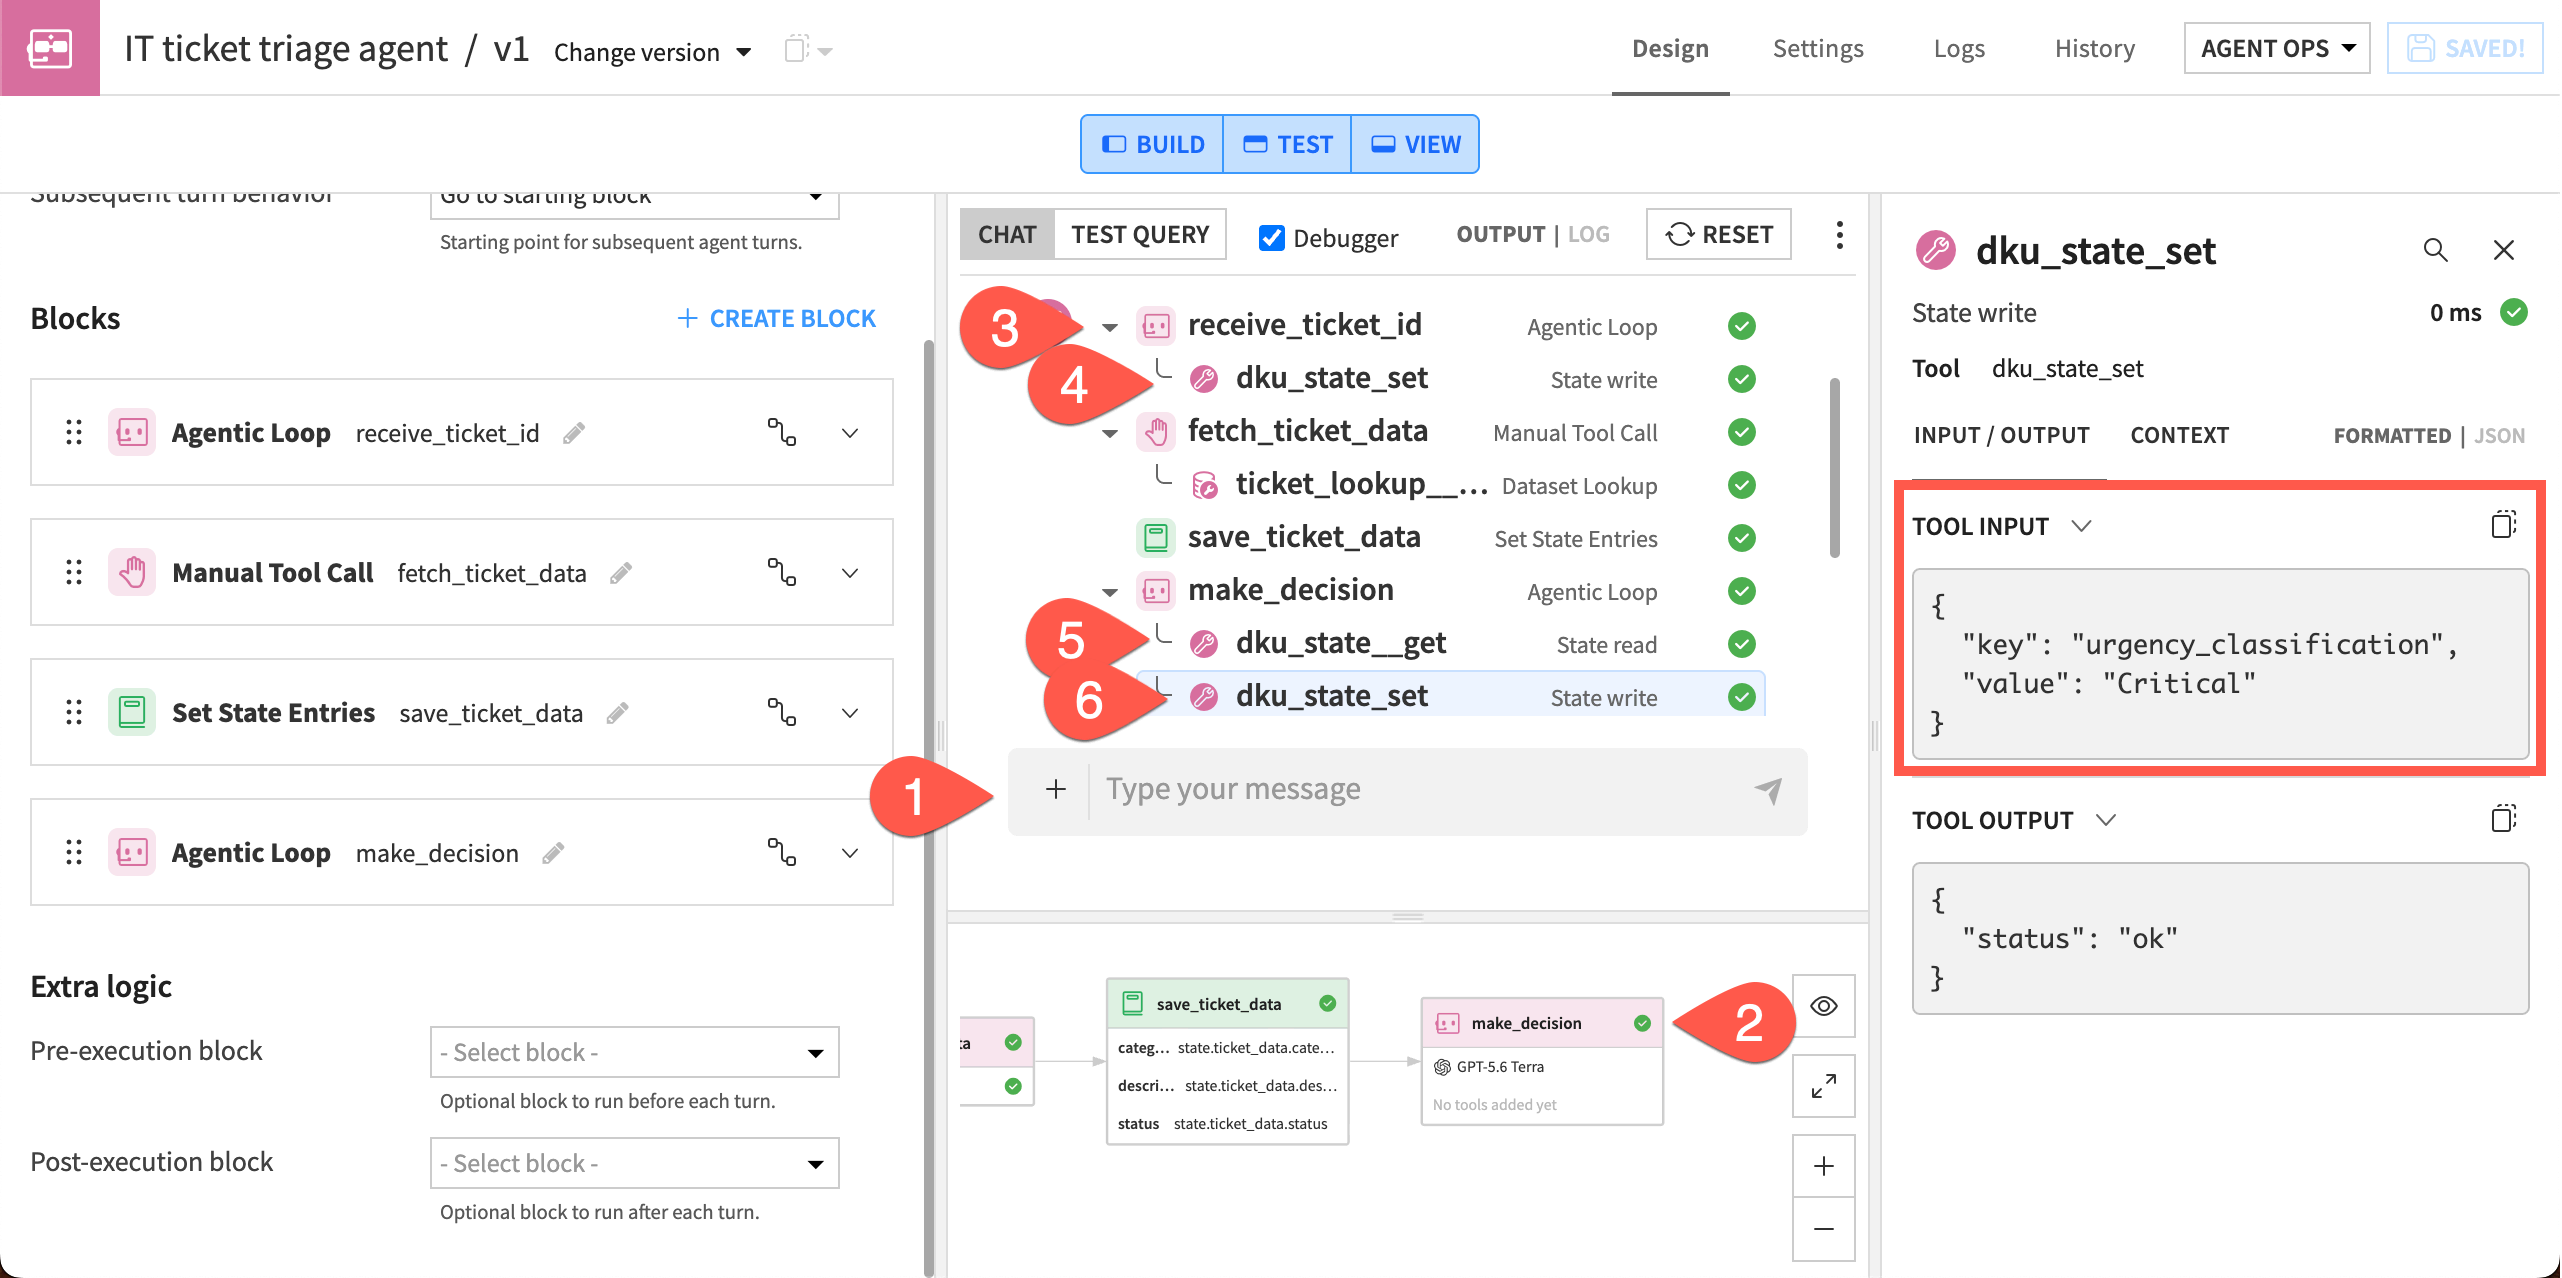
Reset the chat and send
TKT-1116.Verify in the agent diagram that all blocks and tools executed (have green checkmarks).
Click the dropdown arrows next to blocks in the timeline (receive_ticket_id, fetch_ticket_data, and make_decision).
Review the tool calls and steps under each block, noting the agent’s logical reasoning, such as Ticket TKT-1116 Captured or Let me look up the ticket data. These messages will depend on your LLM.
Under the make_decision block, click on the dku_state__get tool and view the debugger panel. This is a tool created within the block to read the ticket_data state.
Click on the dku_state_set tool and verify that the agent has created a state key of urgency_classification and assigned it a value.
You’ve now used the timeline, agent diagram, and debugger panel to understand the agent’s reasoning, memory, and steps.