

Concept | Deployed agent activity#
IT owners can monitor live activity of agents through a standard dashboard in the Project Deployer.
The dashboard gives visibility into how agentic projects on Automation nodes are performing.
Viewing the dashboard#
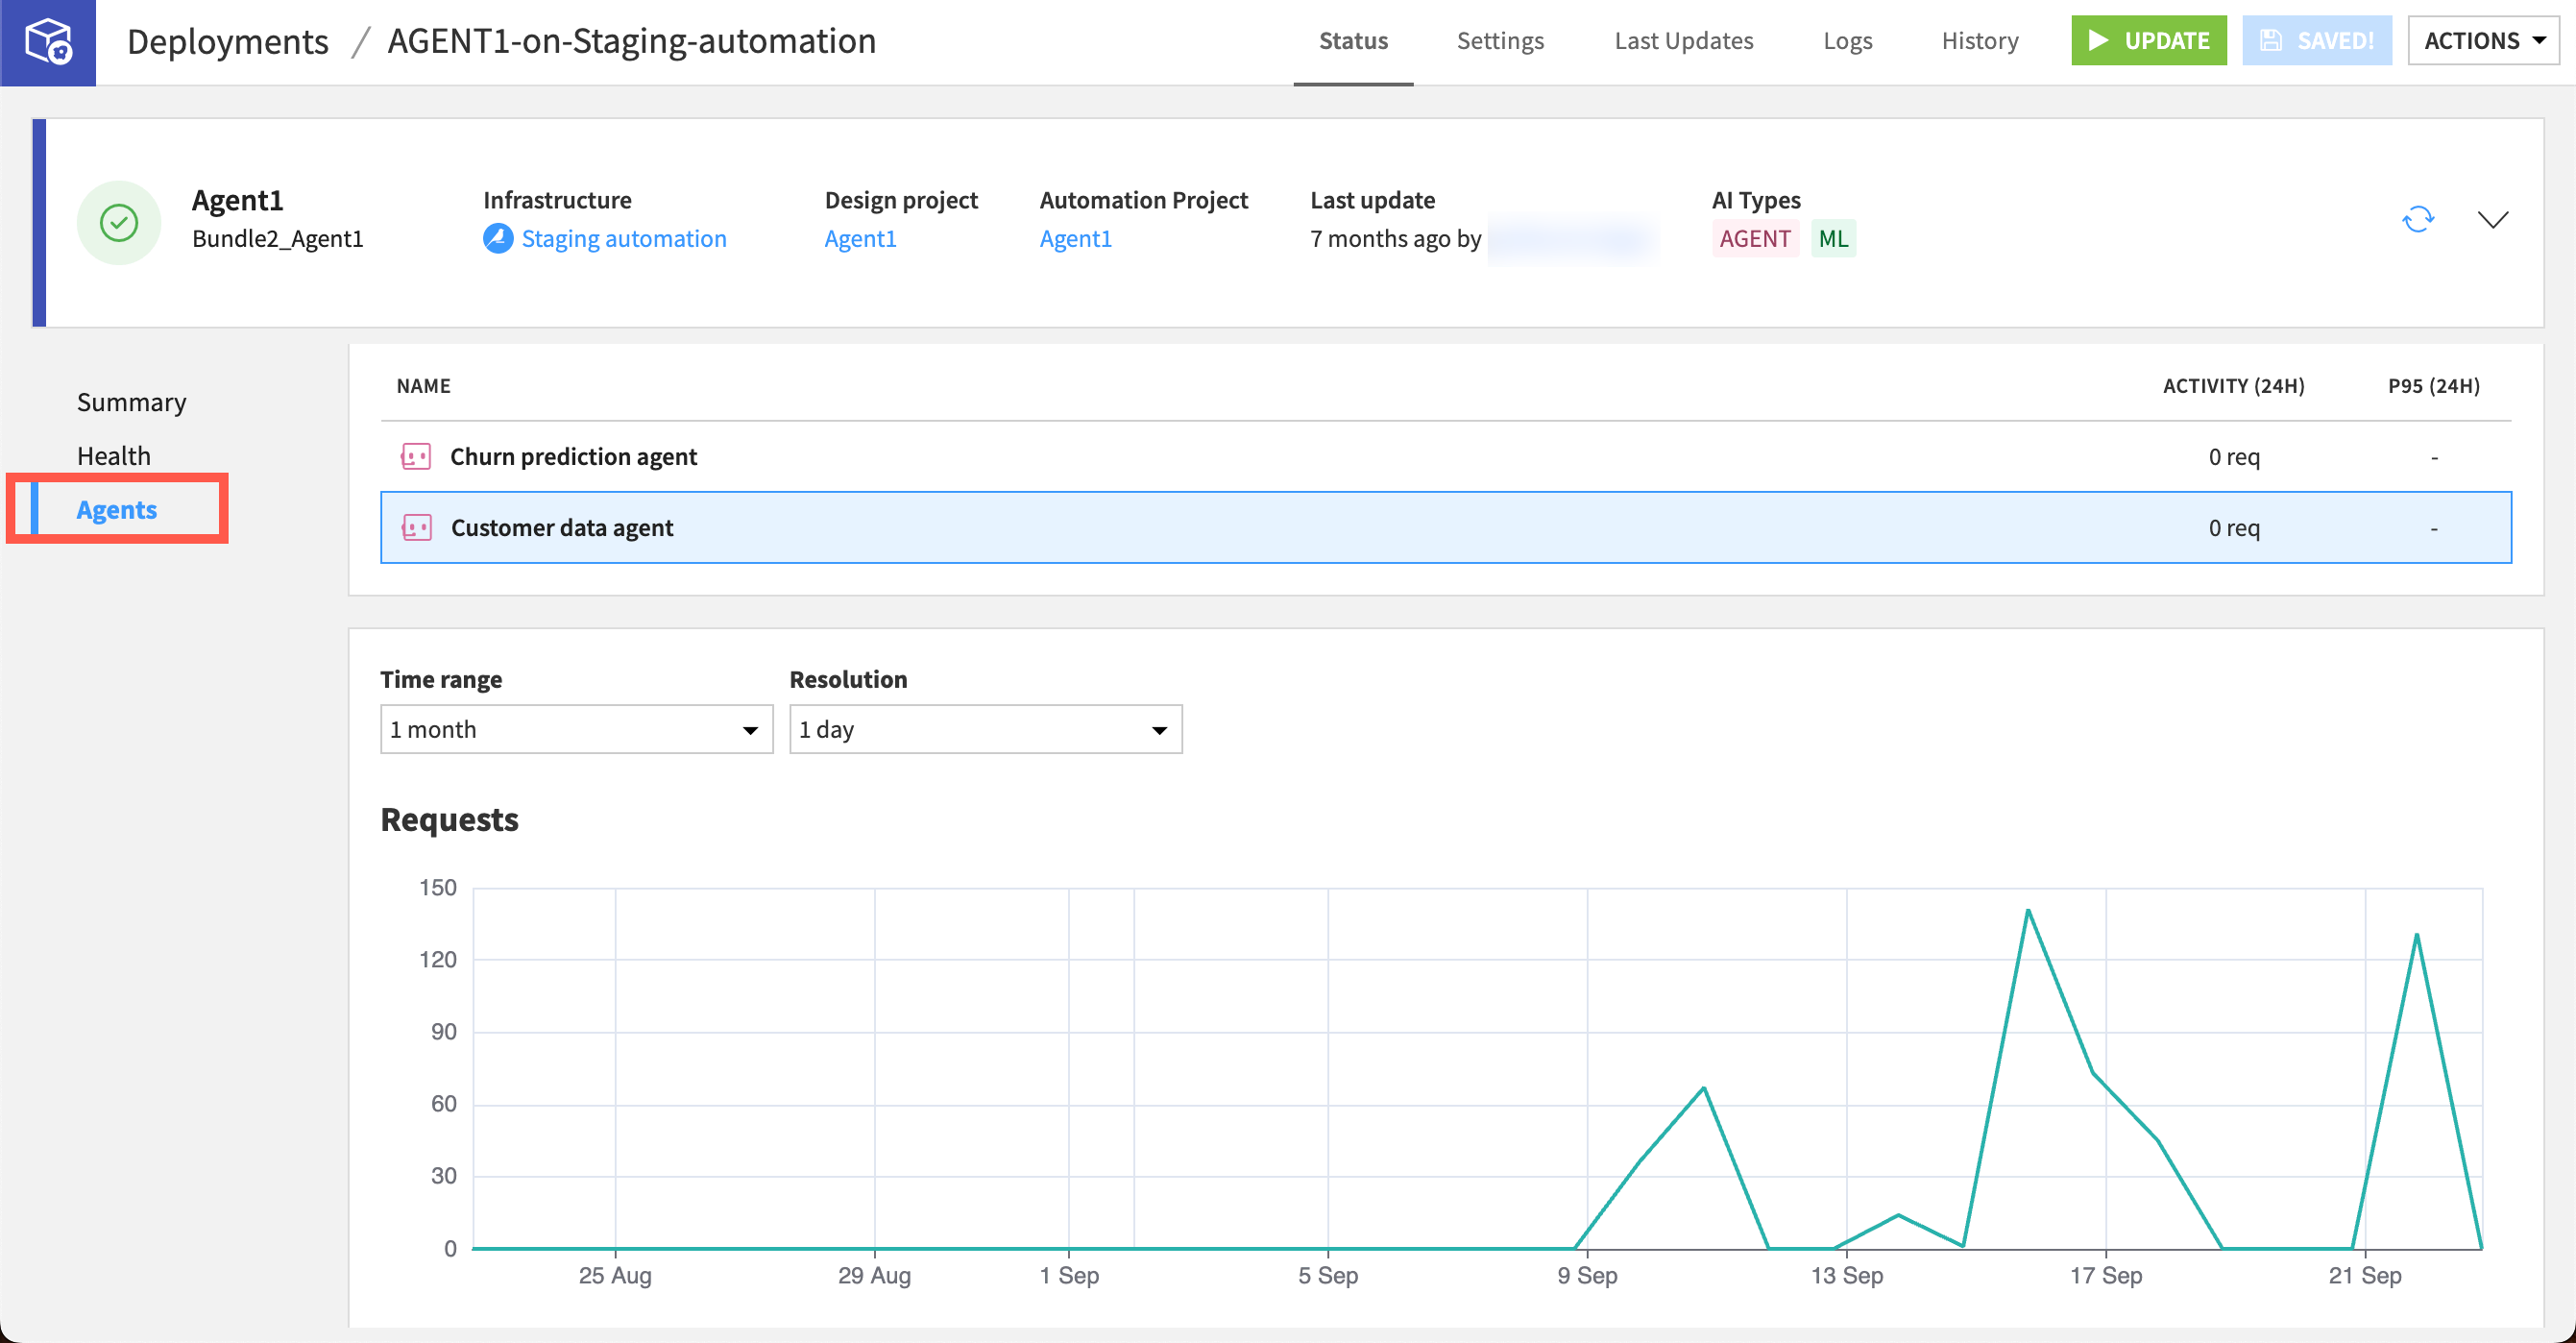
When viewing a deployment in the Project Deployer, click the Agents tab to see the dashboard.
The dashboard contains a list of agents and retrieval-augmented LLMs in the deployed project.
It also displays warnings when it detects configuration issues with the agents, such as missing code environments, LLM connections, or knowledge banks.
Click on an agent/LLM to view basic metrics, including:
The number of requests to the agent.
Agent response time (P95).
See also
For instructions on deploying a project, see How-to | Deploy an agentic project.