

Concept | Process Mining#
Business processes rarely follow the path they were designed to. Orders stall at approval gates, loans wait days between review steps, and payments loop through exception handling that was never planned.
Understanding how a process actually runs can be difficult, especially when it spans multiple systems and teams. Process mining addresses this challenge by analyzing event data generated by operational systems to reconstruct the real execution of a process.
What’s process mining?#
Process mining is a set of data-driven techniques that use event logs to reconstruct and analyze how business processes actually run. Unlike interviews, workshops, or manual observations, it relies on recorded system data to provide an objective view of process execution.
The result is a visual representation of the process enriched with metrics such as frequency, duration, bottlenecks, and deviations.
Organizations use process mining to understand how processes are executed in practice and identify opportunities for improvement.
Common use cases#
Process mining can be applied to any process that generates event data. Common use cases include:
Use case |
Description |
|---|---|
Order-to-cash and purchase-to-pay (P2P) |
Identifying approval delays, payment bottlenecks, and non-compliant process variations. |
Loan processing and financial services |
Monitoring service-level agreements (SLAs) compliance and locating manual interventions that slow workflows. |
Payment processing systems |
Detecting routing anomalies, latency spikes, and unexpected exception paths. |
IT service management |
Understanding how tickets move through triage, assignment, and resolution to reduce resolution time. |
Manufacturing and supply chain |
Identifying delays, rework loops, and inefficiencies across production and fulfillment processes. |
Agentic and AI-driven workflows |
Analyzing how AI agents execute tasks, make decisions, and interact with systems to identify failures and unexpected paths. |
Key concepts#
Process mining relies on event logs: structured datasets that record activities performed during the execution of a process.
Understanding the concepts below will help you interpret process mining analyses and understand how event data is transformed into process insights.
Concept |
Definition |
|---|---|
Event log |
A dataset where each row records an activity performed for a specific case at a specific time. Event logs are the primary input for process mining. |
Case |
One complete execution of the process, identified by a unique Case ID. A sales order, a support ticket, or a payment transaction each represents one case. |
Activity |
A named step in the process (for example Order Received or Invoice Sent). Activities appear as nodes (rectangles) in the process graph. |
Timestamp |
Records when an activity occurred. Used to order events within a case and calculate durations and cycle times. |
Variant |
A unique ordered sequence of activities followed by a case. Variants reveal the most common execution paths (the happy path) and highlight exceptions or rework. |
Cohort |
A subpopulation of cases defined by a filter, such as the orders handled in one region, or the cases that ended in a given activity. Comparing cohorts shows how cycle times, bottlenecks, and paths differ from one segment of the process to another. |
The example below illustrates how these concepts relate to each other in a simplified event log.
Case ID |
Activity |
Timestamp |
|---|---|---|
Order-001 |
Order Received |
2025-01-15 09:00 |
Order-001 |
Credit Check |
2025-01-15 09:05 |
Order-001 |
Order Approved |
2025-01-15 09:12 |
Order-002 |
Order Received |
2025-01-15 09:03 |
Order-002 |
Credit Check |
2025-01-15 09:08 |
Order-002 |
Manual Review |
2025-01-15 09:25 |
Order-002 |
Order Approved |
2025-01-15 09:45 |
In this example:
The event log contains two cases:
Order-001andOrder-002.Each row represents an activity associated with a timestamp.
- The two cases follow different variants:
Order Received > Credit Check > Order ApprovedOrder Received > Credit Check > Manual Review > Order Approved
Although both cases follow the same process, they take different paths. Variant analysis helps identify the most common execution paths and highlight exceptions or rework.
Process Mining Business Application#
The concepts above apply to process mining in general. In Dataiku, these capabilities are available through the Process Mining Business App. It provides a dedicated interface for exploring and analyzing business processes through process mining.
With the Process Mining Business App, you can:
Visualize process execution through interactive process graphs.
Identify the most common execution paths (variants) and their frequency.
Detect bottlenecks and long-running activities.
Drill down into specific variants or cases for further analysis.
Save and share analyses as reusable studies.
Important
Business Applications are packaged apps designed for business users who don’t need access to the full Dataiku platform. For a complete presentation and administrator guidance on installation, configuration, and instance management, see Installing and configuring Business Applications.
See also
For access requirements and licensing information, see Process Mining in the reference documentation.
App overview#
The Process Mining Business App is organized around a shared landing page where you manage studies, and three views you move through when running an analysis: the data configuration step, the Process explorer, and the Cases & Variants explorer.
Landing page and studies#
The landing page is the starting point for all process mining analyses. From here, you can create a new study (1), reopen a recent one (2), browse the available datasets (3), or open the built-in Documentation page (4).
Every app instance includes a sample dataset and a pre-created study, so you can explore the app immediately without configuring your own data first.
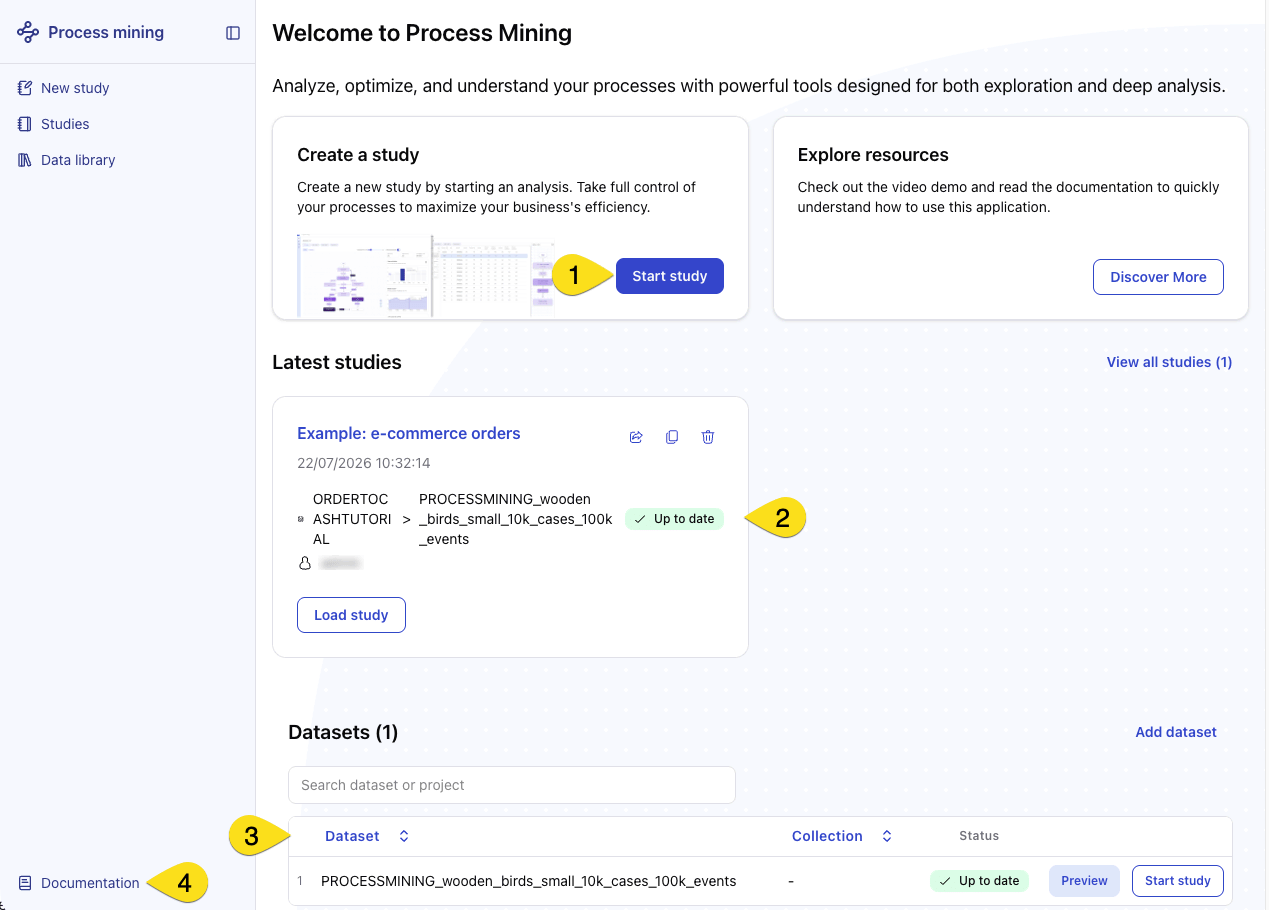
Studies are saved analysis configurations. Each study captures a dataset selection, column mappings, and any active filters. Changes are saved automatically as you work.
From the landing page, you can share a study by copying a direct link or duplicate it to use the same configuration as the starting point for a new analysis.
Note
Studies are shared across the app instance: all users with access to the app can view and open them. They store a reference to the dataset, not the data itself. Changes to the underlying dataset aren’t reflected automatically. To update a study, users and administrators can run Check dataset.
The Data library lists the datasets available for analysis. The list is managed by an administrator, who controls which datasets are accessible in the app.
Data configuration#
Data configuration defines which dataset a study analyzes and how its columns map to the process mining fields the app uses to reconstruct process execution. Column mapping is done directly from the data preview, where each column header can be assigned to a field type.
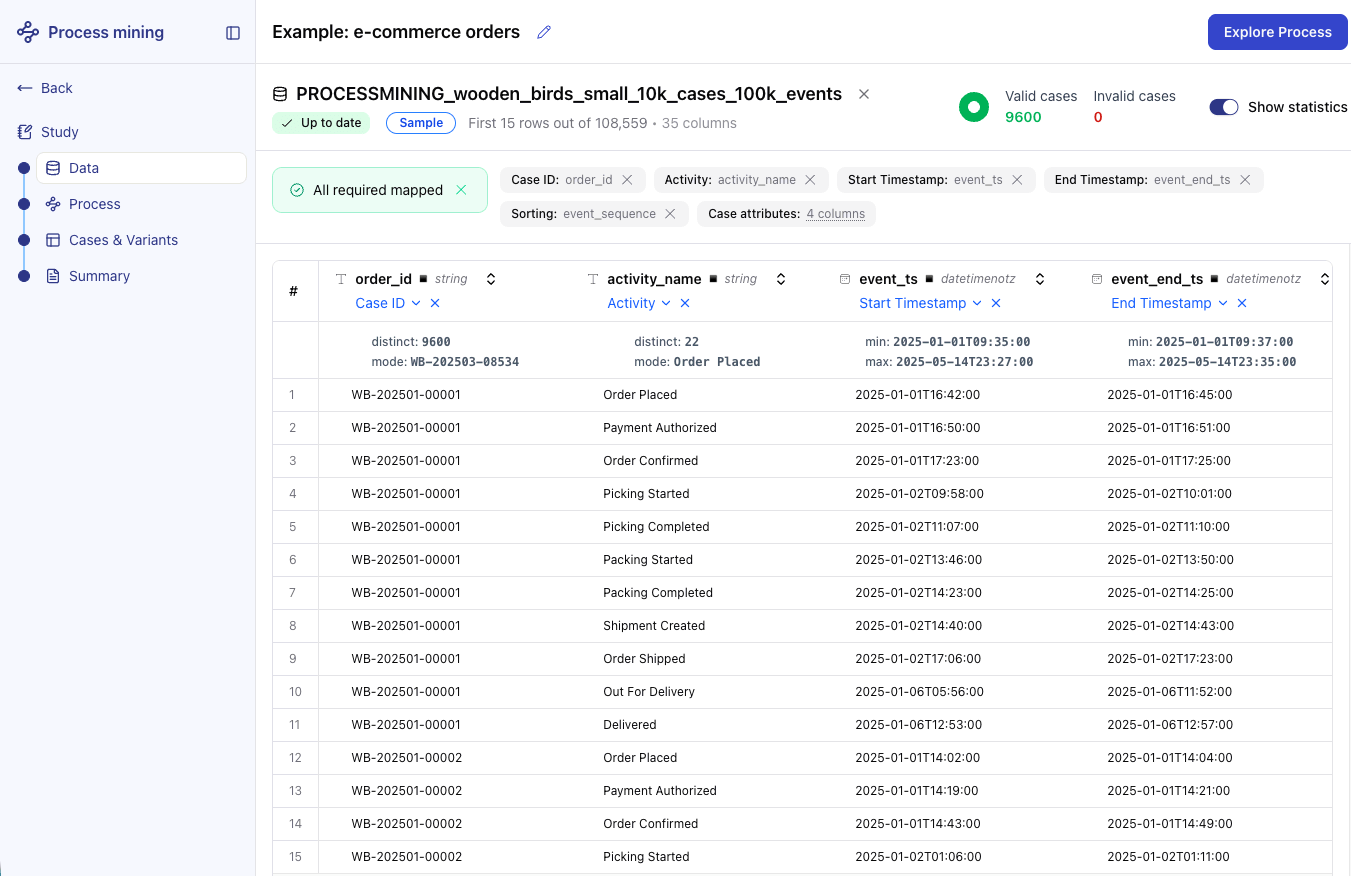
Three fields are required: a Case ID, an Activity name, and a Start Timestamp. Optional fields such as an End Timestamp, a Sorting column, or Case attributes, enrich the analysis with duration data, ordering, and filtering dimensions.
Tip
A status banner at the top confirms when all required fields are mapped. The valid and invalid case counts shown alongside help identify data quality issues before proceeding. A high proportion of invalid cases typically signals mapping problems or missing values in the source dataset.
Process explorer#
The Process Explorer is the main analysis view. It displays the process as a directed graph that maps directly to the key concepts introduced earlier:
Nodes (rectangles) represent activities.
Edges (arrows) represent transitions between them.
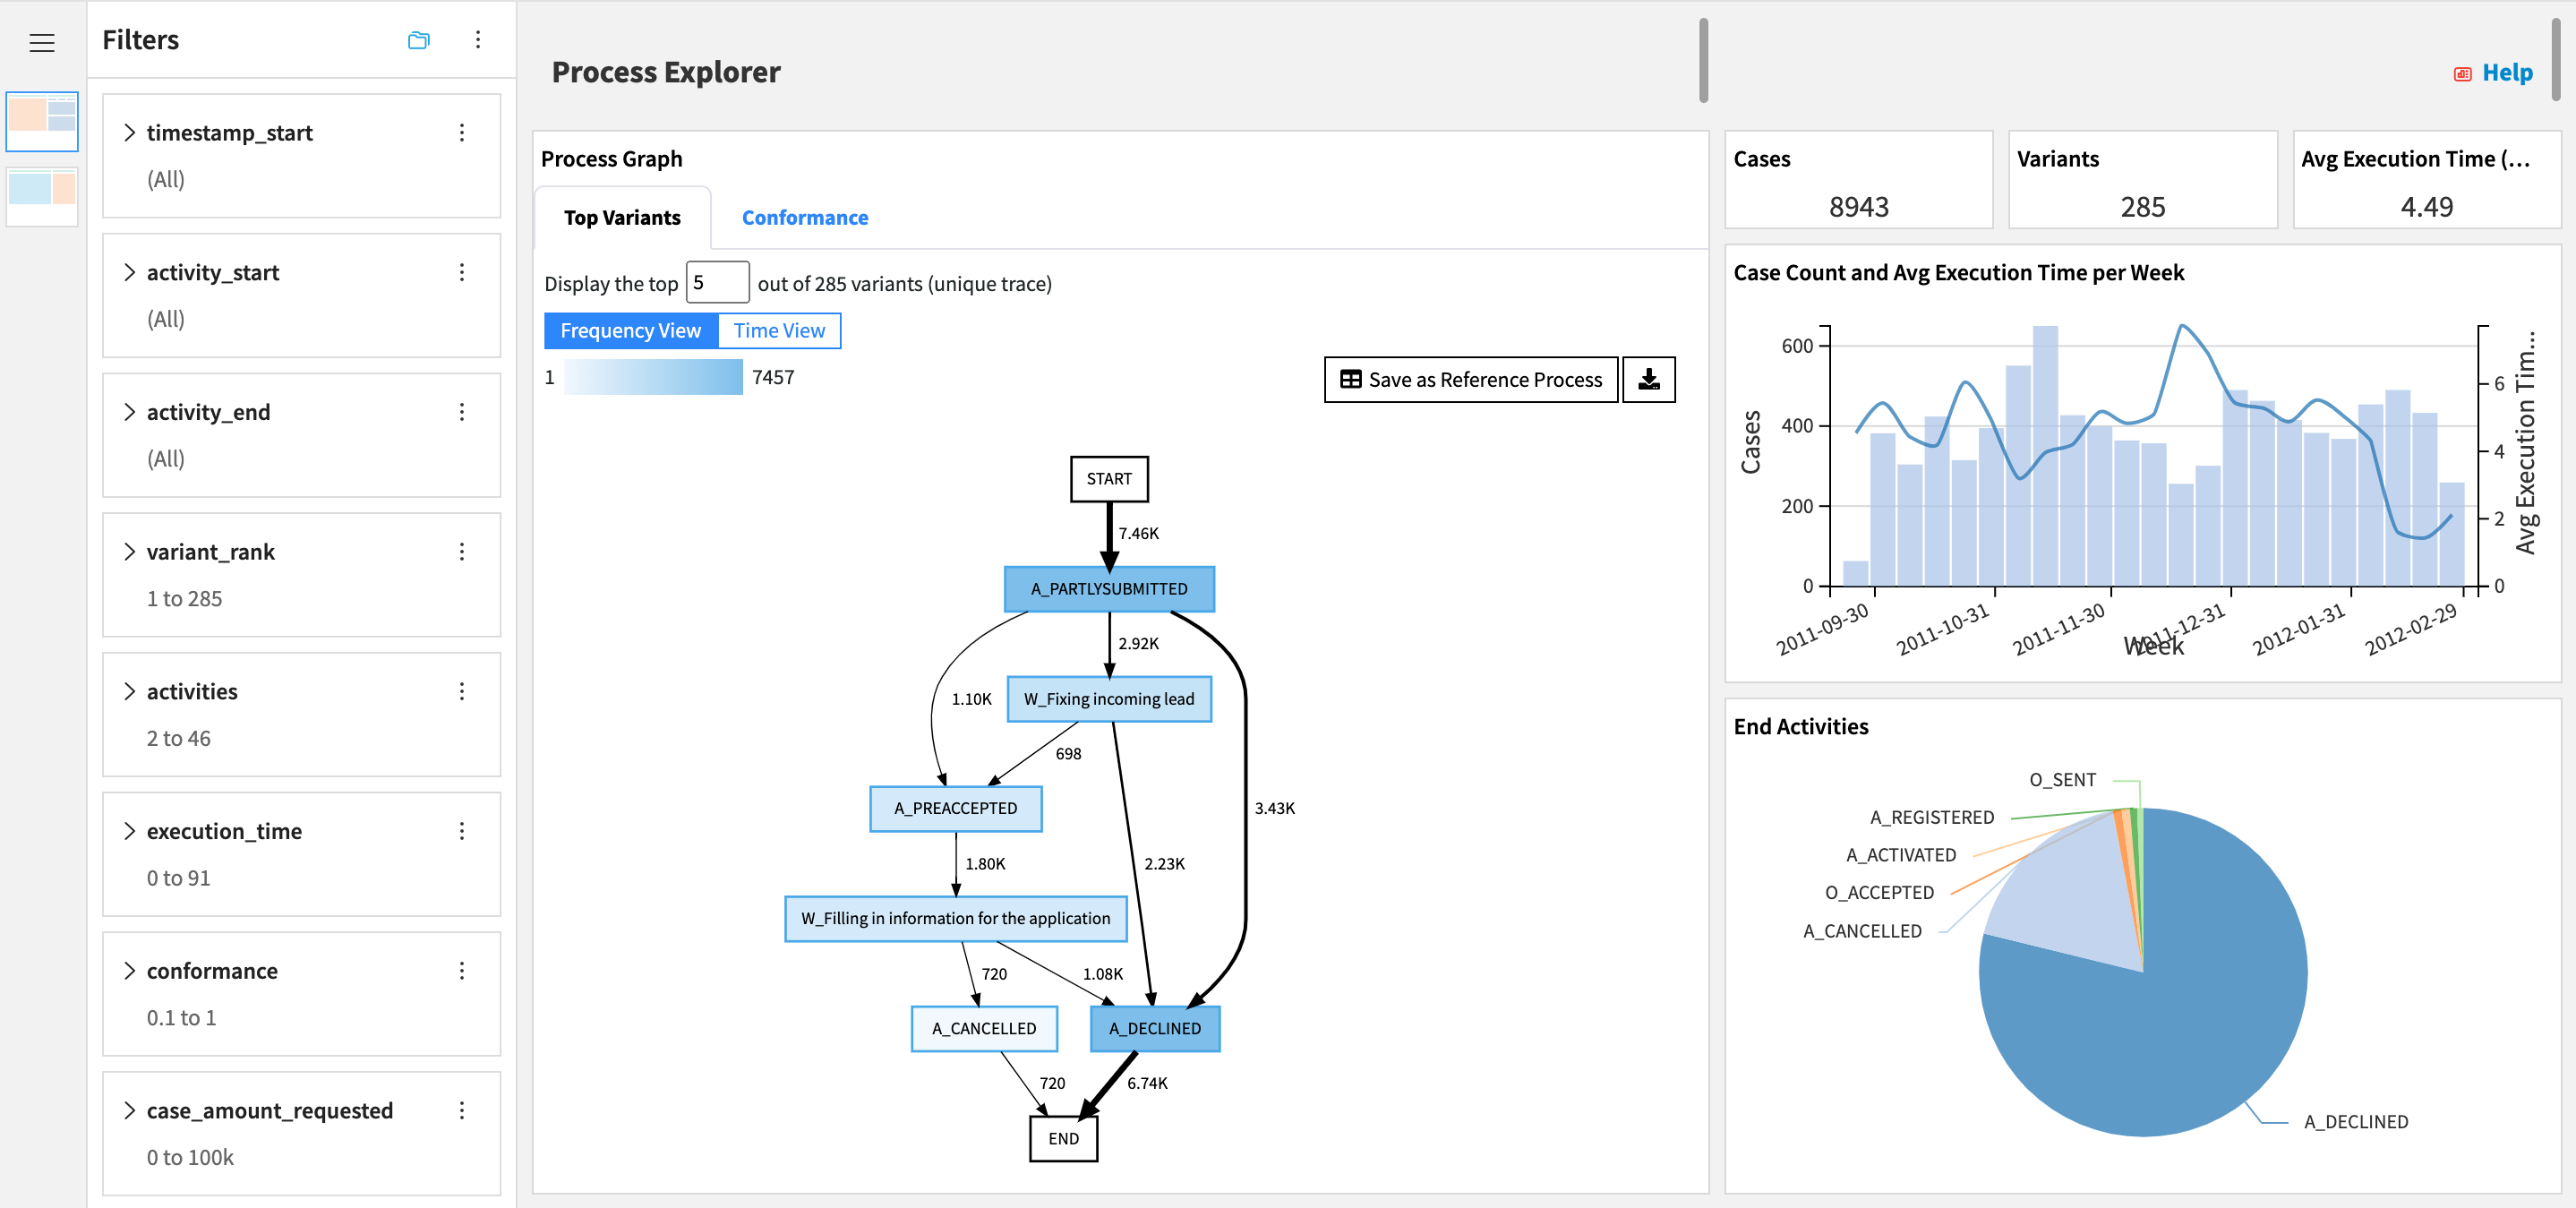
From the Process explorer, you can:
Switch between frequency and time views to analyze process volume or duration (1).
Focus on the most common execution paths using the variant slider (2).
Use the Customize panel to define custom metrics and custom charts, compare cohorts, or apply filters to narrow the analysis to specific dates, activity counts, or case attributes (3).
Click any activity node to explore detailed statistics for that step.
Tip
The right sidebar shows key performance indicators cards and charts computed from the current dataset and active filters, including end activity distribution and case volume over time.
Cases & Variants explorer#
While the Process Explorer shows the aggregate picture, the Cases & Variants Explorer lets you drill into specific variants and individual cases. Any filters applied in the Process Explorer carry over, so the variants and cases displayed here reflect the same scope.
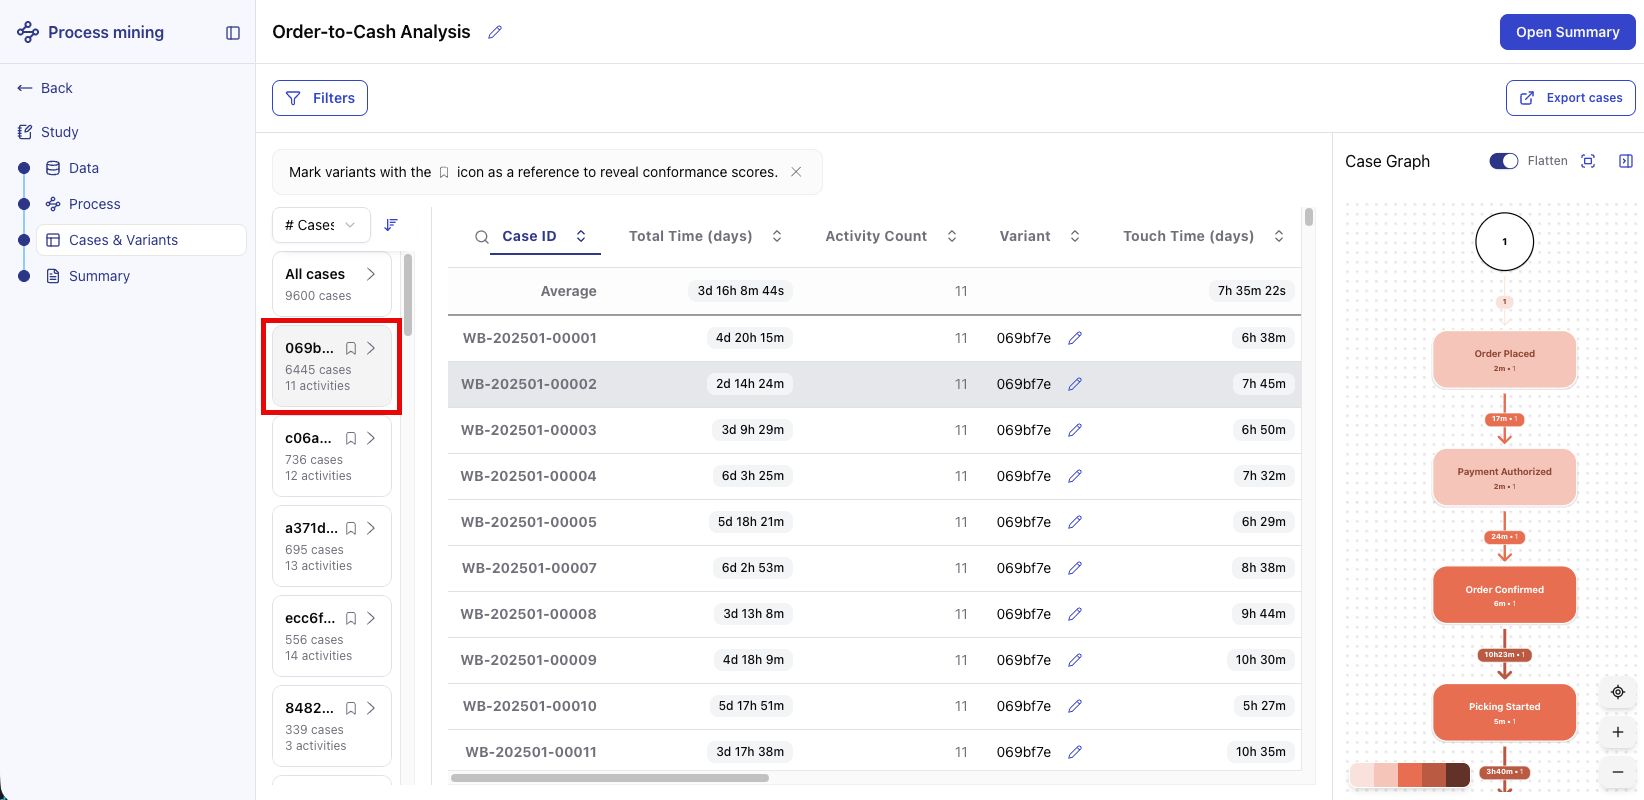
The left sidebar lists all variants discovered in the data, ordered by frequency. The variants at the top represent the most common execution paths. Lower-ranked ones are edge cases or exceptions worth investigating separately. Variants can also be given custom names to replace their default identifiers, making it easier to communicate findings across teams.
Selecting a variant shows all cases that followed that path in the center table. Clicking a specific case displays its individual process graph on the right, with the exact sequence of activities and the time spent on each step.
Summary page#
The Summary page is a dedicated space for teams to surface and share the key insights from a process mining analysis. It consolidates the outputs of the full study, including the analyzed dataset, the process graph, business metrics, and charts created during the analysis.
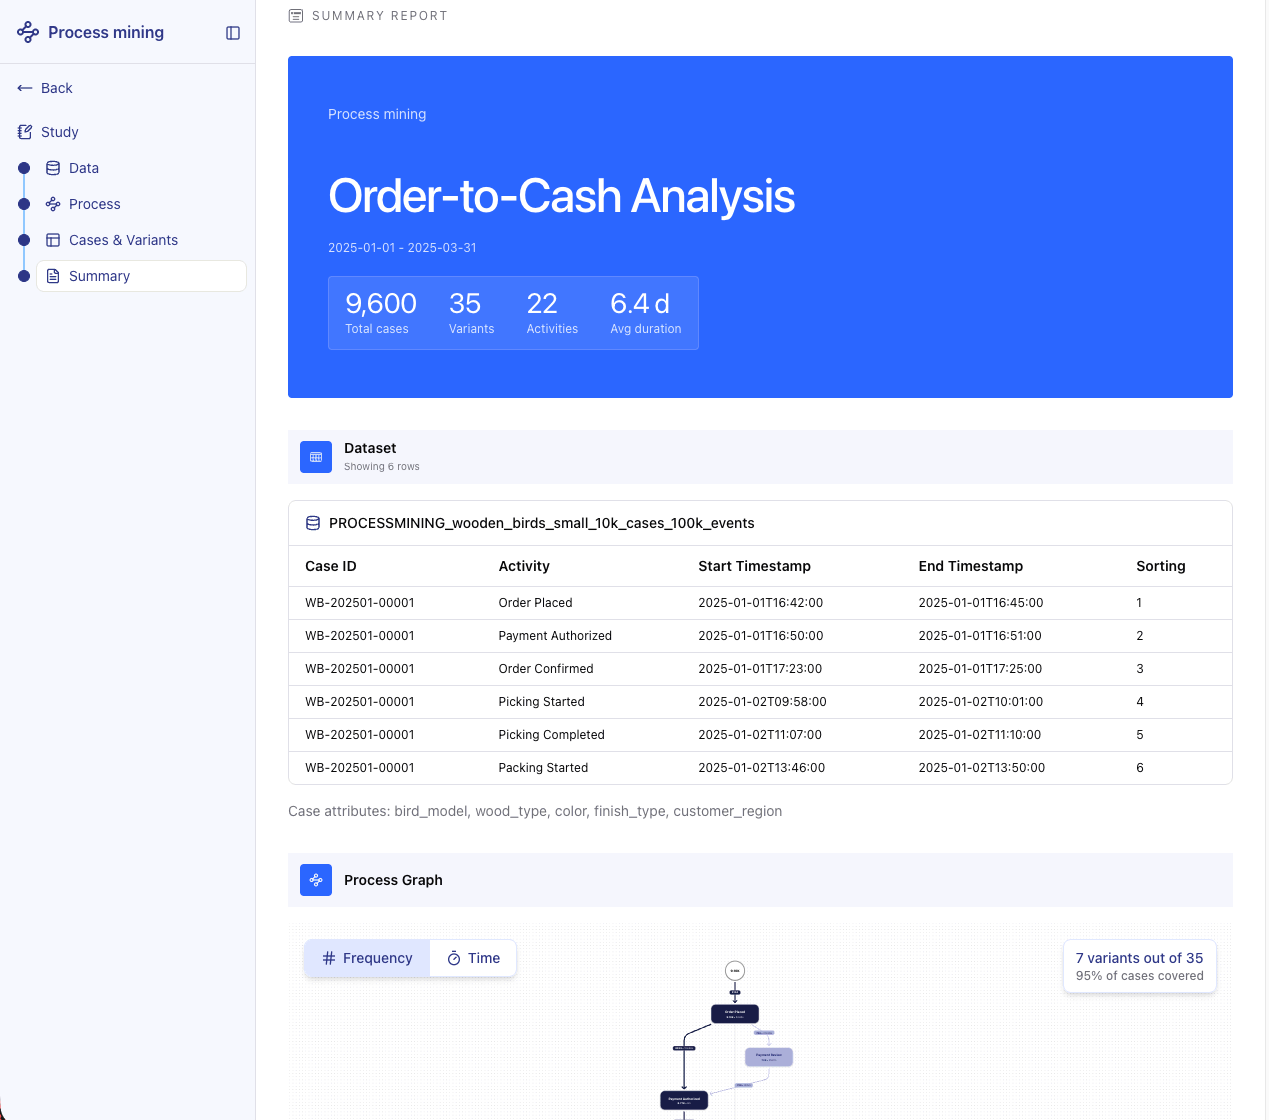
Instead of requiring stakeholders to navigate the full study, teams can highlight key findings in a format designed for a broader audience. These findings can include the most frequent activities, processing times, the most common execution paths, identified bottlenecks, and deviations from the reference variant.
You can also export the Summary page to PDF, to circulate your findings to stakeholders who don’t have access to the app.
Next steps#
Continue learning by working through the Tutorial | Process Mining tutorial, where you analyze an order-to-cash event log step by step.
Important
In addition to reading this article, it’s recommended to explore the built-in Documentation page in the app before running your first analysis. It covers data model requirements, methodology, administration guidance, and release notes.