

Concept | Live debugging#
Live debugging provides visual feedback on an agent’s activities, giving you real-time insight into its logic so you can debug issues as they arise.
As an AI builder, you can track a test run live, and after the fact, see each step the agent took, what happened during that step, and exactly where the agent failed.
The debugger provides feedback in three areas of the visual agent editor interface:
An event timeline in the chat
The agent diagram
The debugger panel
Timeline#
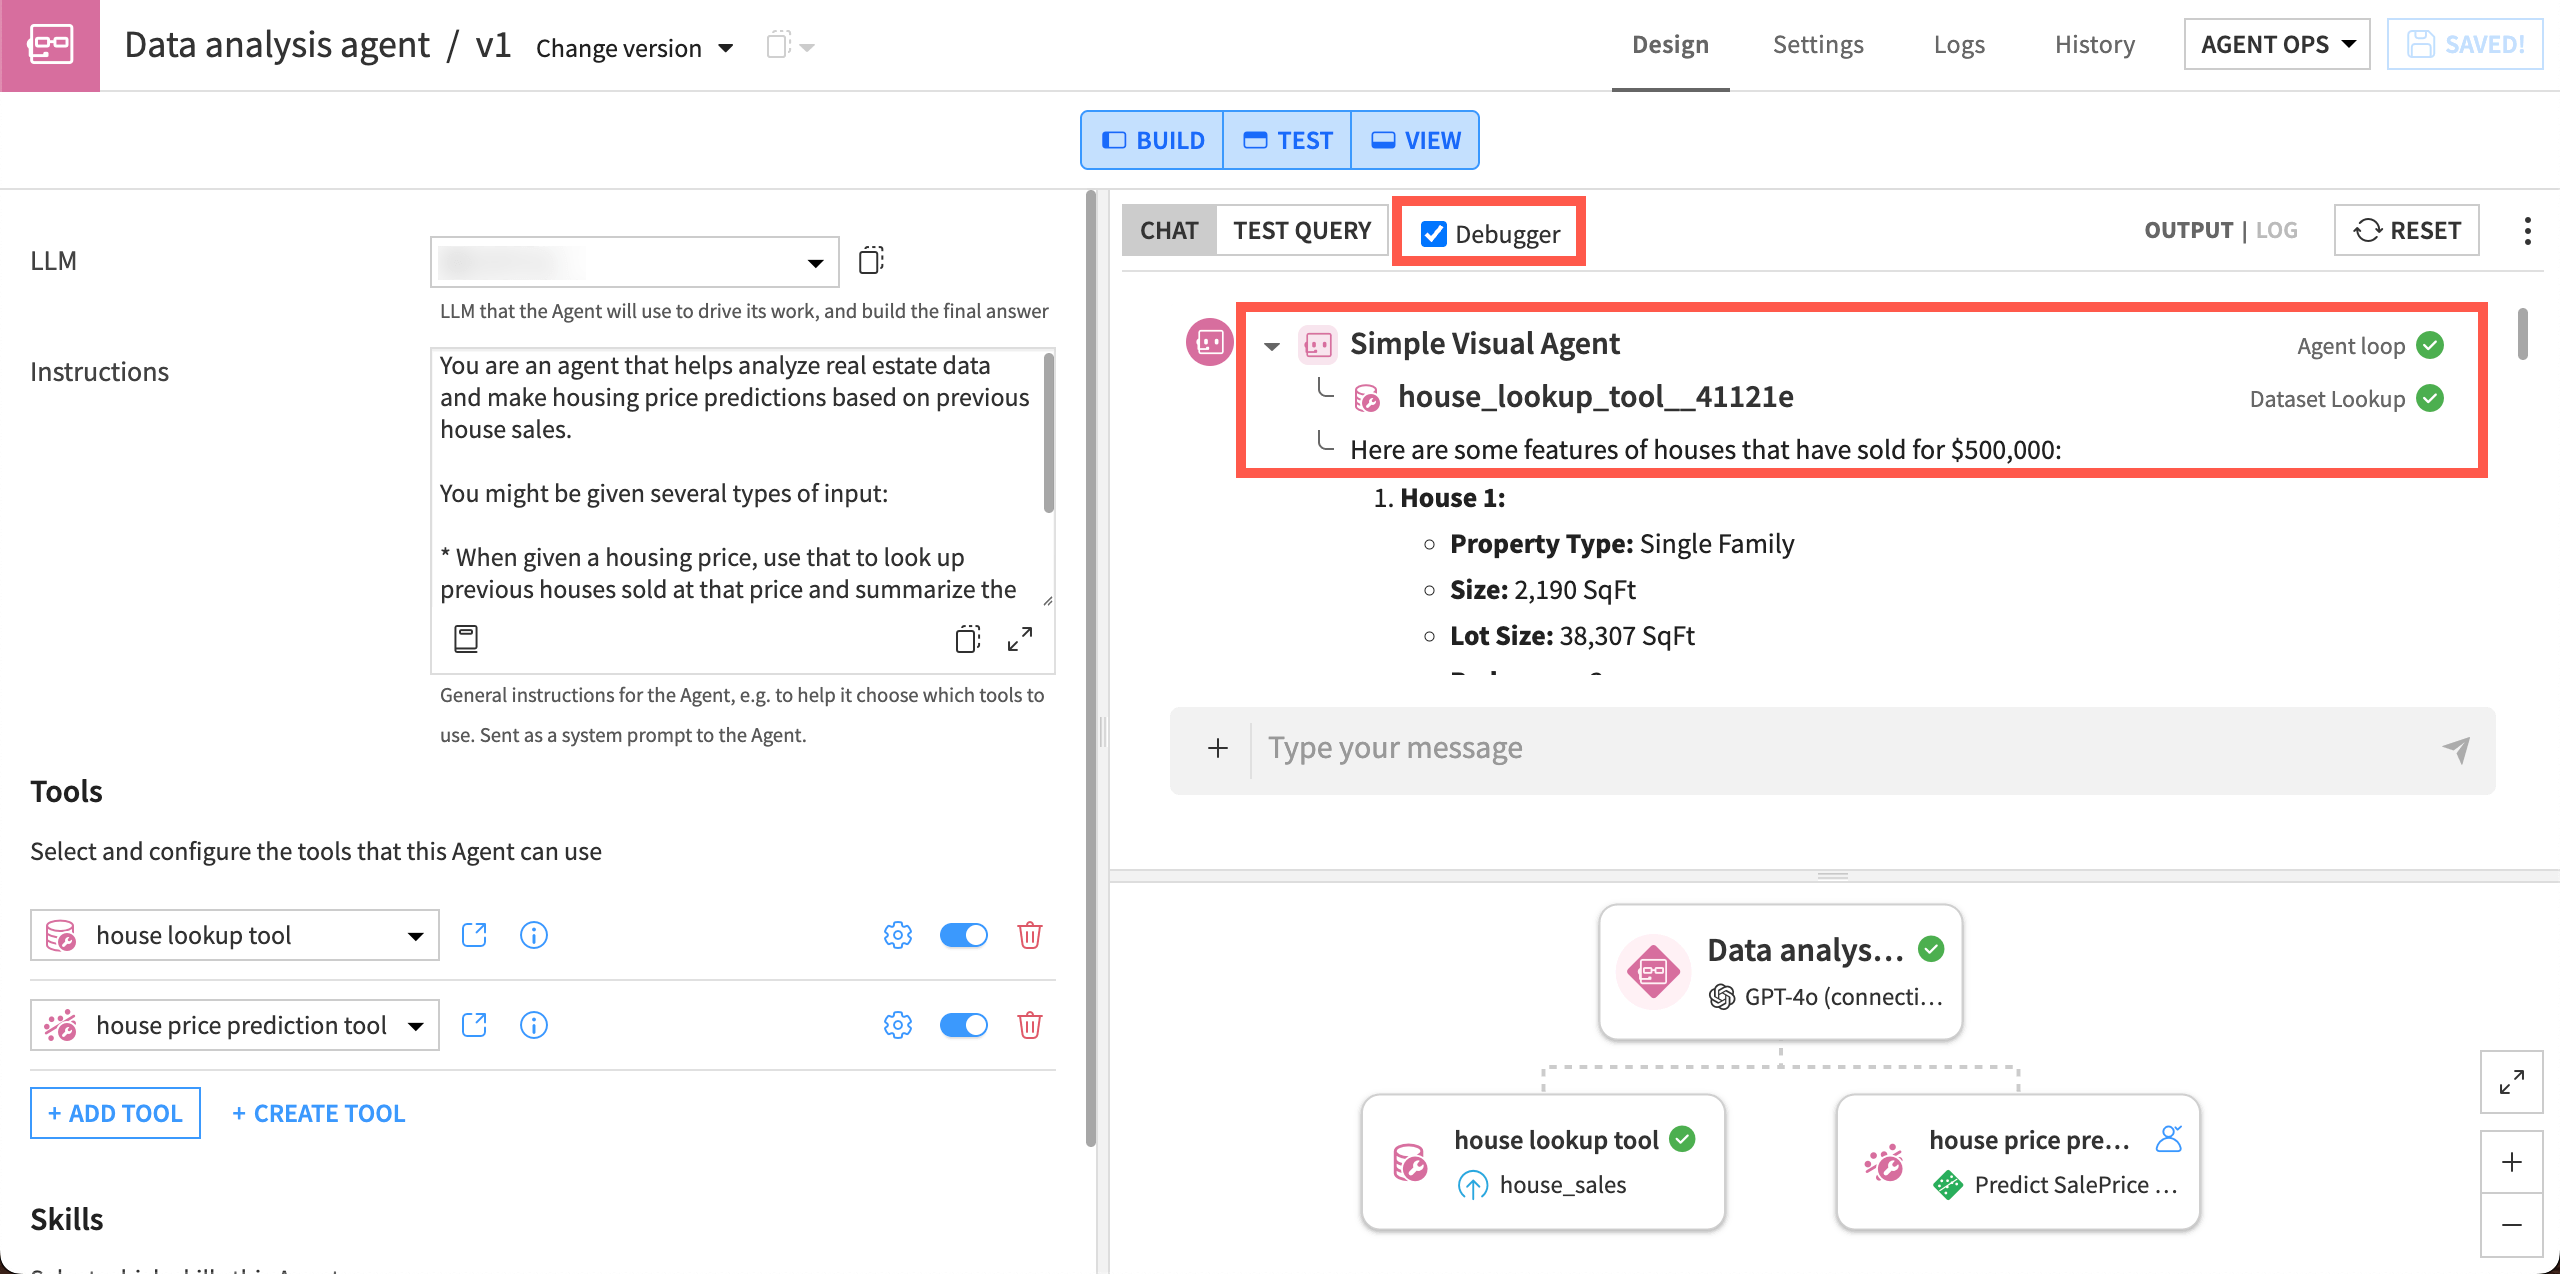
As you chat with an agent in the editor, a timeline in the chat interface shows the real-time sequence of steps as they process. You can see whether the steps have successfully completed or failed.
The timeline includes visibility into LLM reasoning, tool calls, and guardrails. For Structured Visual Agents, the timeline also includes nested tool calls.
Turn on the timeline by checking the Debugger box in the Chat section of the agent editor.
Agent diagram#
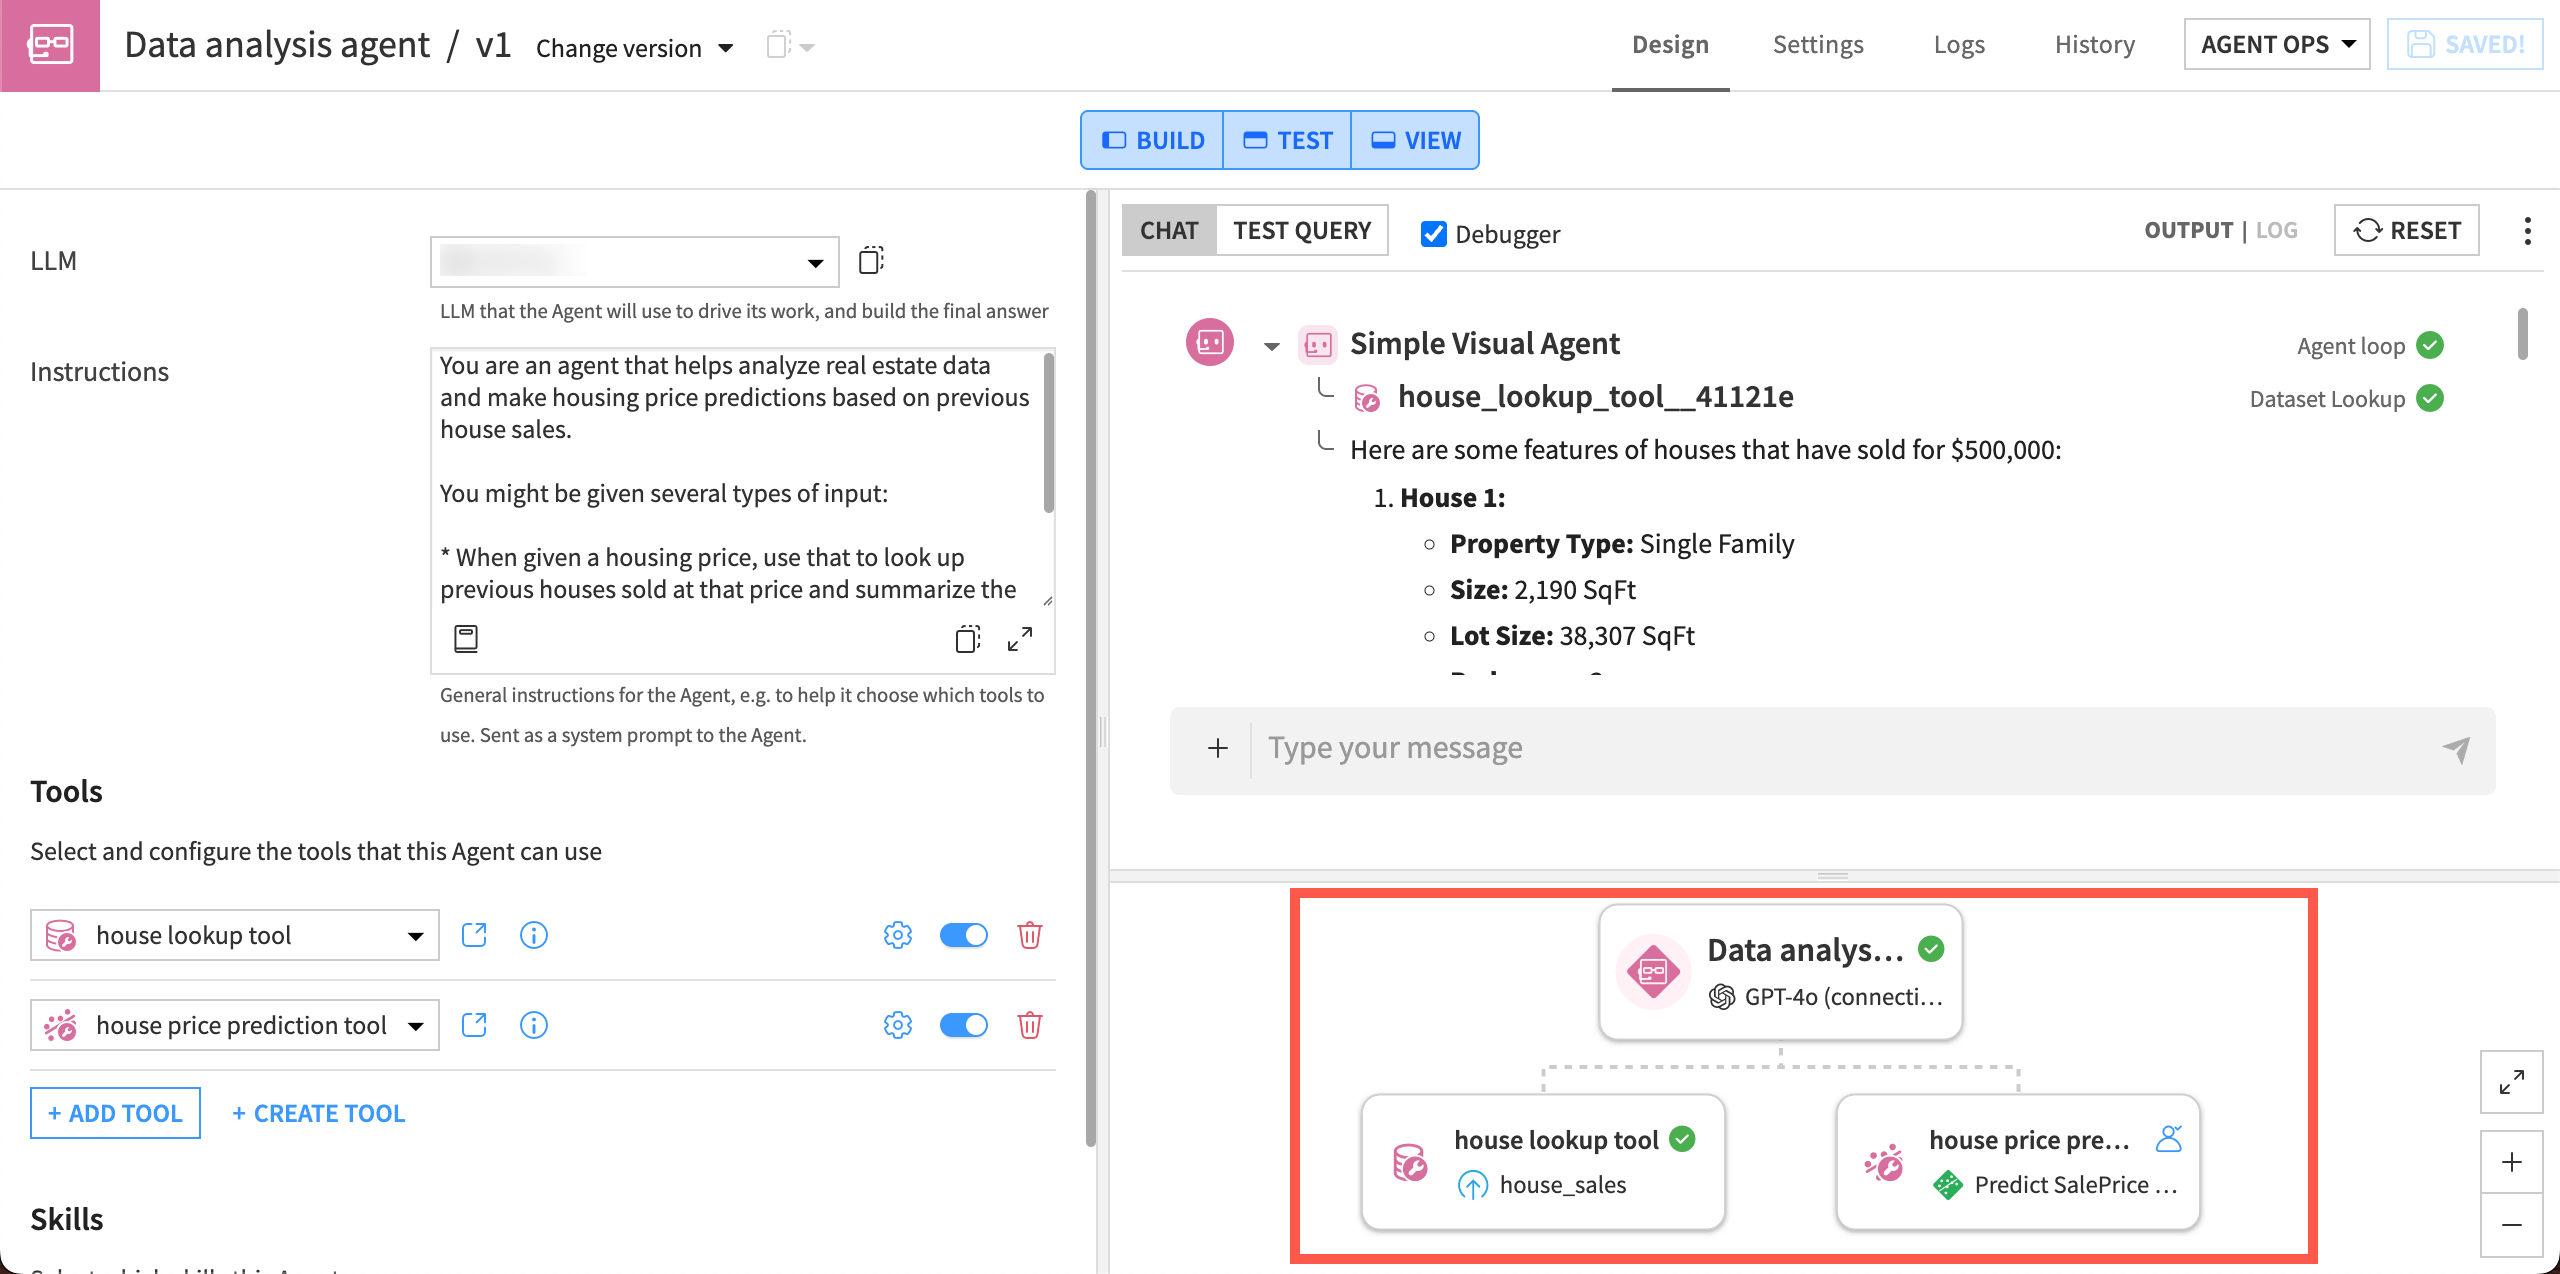
As the agent continues through its steps, the active reasoning step, tool call, or block showing in the timeline is also highlighted in the agent diagram.
The diagram is a graph in the lower right panel of the agent editor showing the components that make up the agent.
Debugger panel#
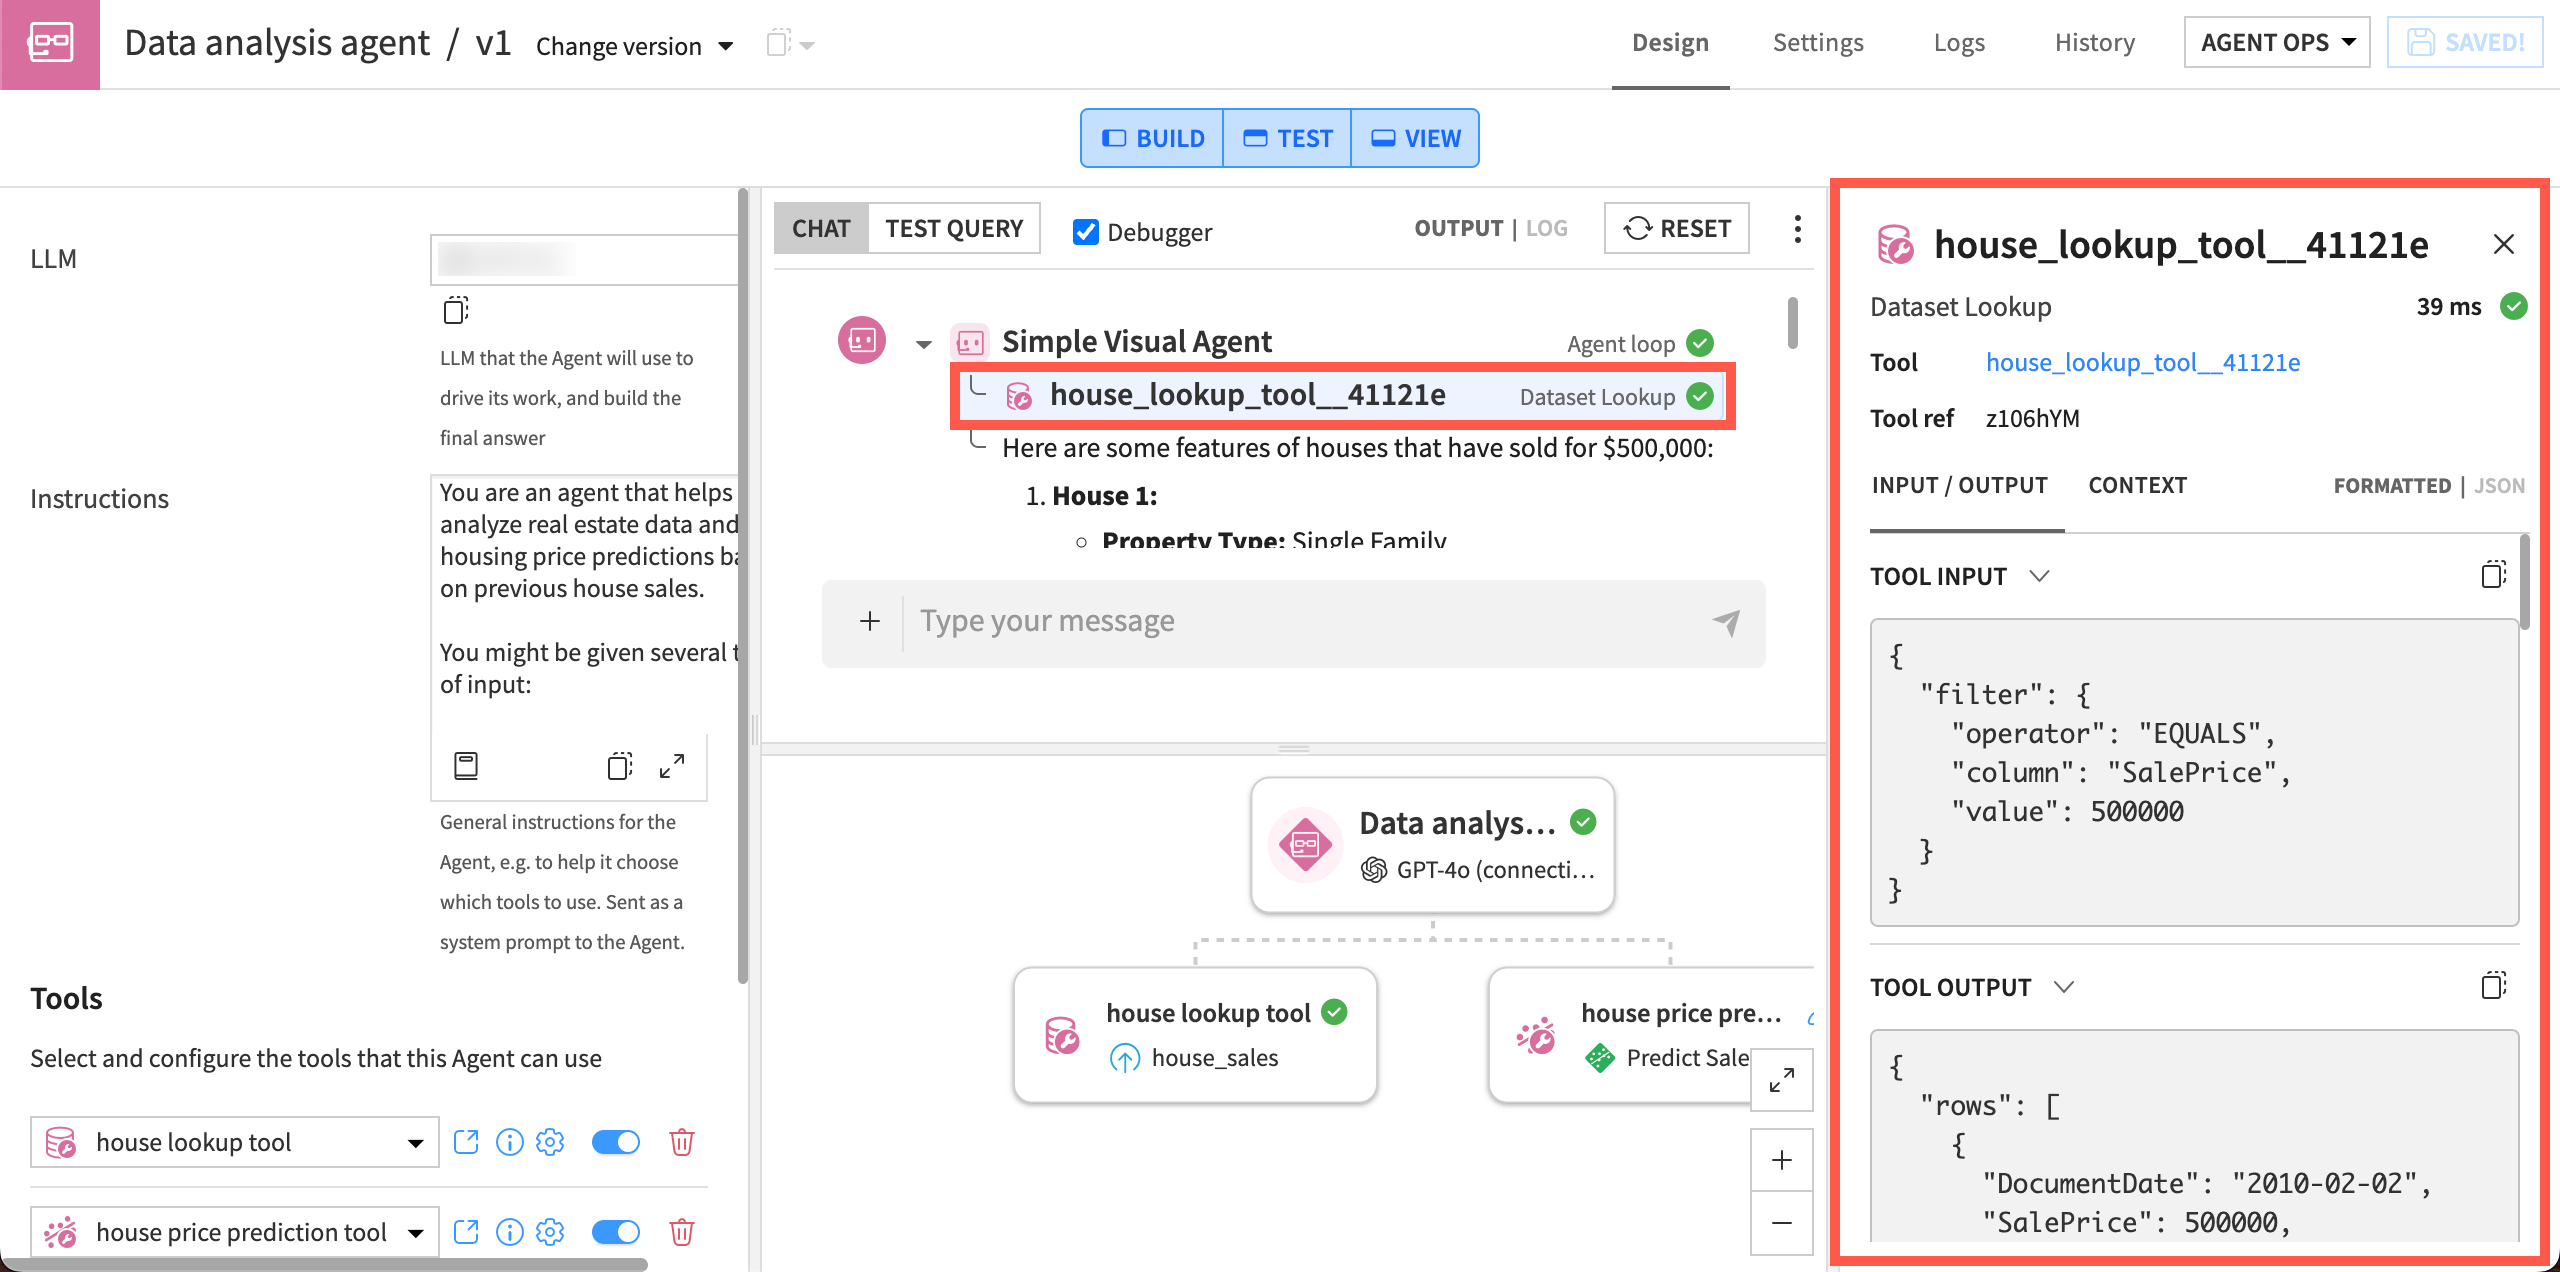
After a test run completes, you can drill into the details in the debugger panel. Open it by clicking on a step, tool call, or block in the timeline.
You can view input/output data, error messages, and metadata such as time to complete the step.
For Structured Visual Agents, the panel also shows state and scratchpad snapshots at specific steps.
See also
For more information, see the debugger reference.
Next steps#
Practice live debugging in Tutorial | Live debugging.