Tutorial | Time series preparation#
Get started#
Time is often an important quantity for many phenomena that we would like to predict. However, before we can build forecasts with time series data, we often need to prepare the data to meet certain properties.
Objectives#
In this tutorial, you will:
Visualize time series data before performing analysis and preparation steps with recipes in the Time Series Preparation plugin.
Use the Resampling recipe to equally space, interpolate, extrapolate, and clip time series data.
Use the Interval Extraction recipe to extract intervals of interest from a time series.
Use the Windowing recipe to build aggregations over a variety of causal and non-causal window frames.
Use the Extrema Extraction recipe to extract aggregations around windows frames with respect to global maxima or minima.
Use the Decomposition recipe to split a time series into its underlying components.
Prerequisites#
Dataiku 12.0 or later.
The Time Series Preparation plugin installed.
Basic knowledge of Dataiku (Core Designer level or equivalent).
The Time Series Analysis & Forecasting course contains highly relevant material, but isn’t strictly required to complete this tutorial.
Create the project#
From the Dataiku Design homepage, click + New Project.
Select Learning projects.
Search for and select Time Series Preparation.
If needed, change the folder into which the project will be installed, and click Create.
From the project homepage, click Go to Flow (or type
g+f).
From the Dataiku Design homepage, click + New Project.
Select DSS tutorials.
Filter by ML Practitioner.
Select Time Series Preparation.
From the project homepage, click Go to Flow (or type
g+f).
Note
You can also download the starter project from this website and import it as a ZIP file.
Use case summary#
The orders_by_date dataset consists of four columns:
Column |
Description |
|---|---|
order_date |
Stores a parsed date of a t-shirt order. |
tshirt_category |
Stores a label identifying one of six t-shirt categories. |
tshirt_quantity |
Stores the daily number of items sold in a category. |
amount_spent |
Stores the daily amount spent on a t-shirt category. |
Visualize time series data#
Before preparing our time series data, we’ll want to analyze and visualize it.
Inspect the data#
What can we learn about each column in the order_date dataset?
Lack of equal spacing between timestamps#
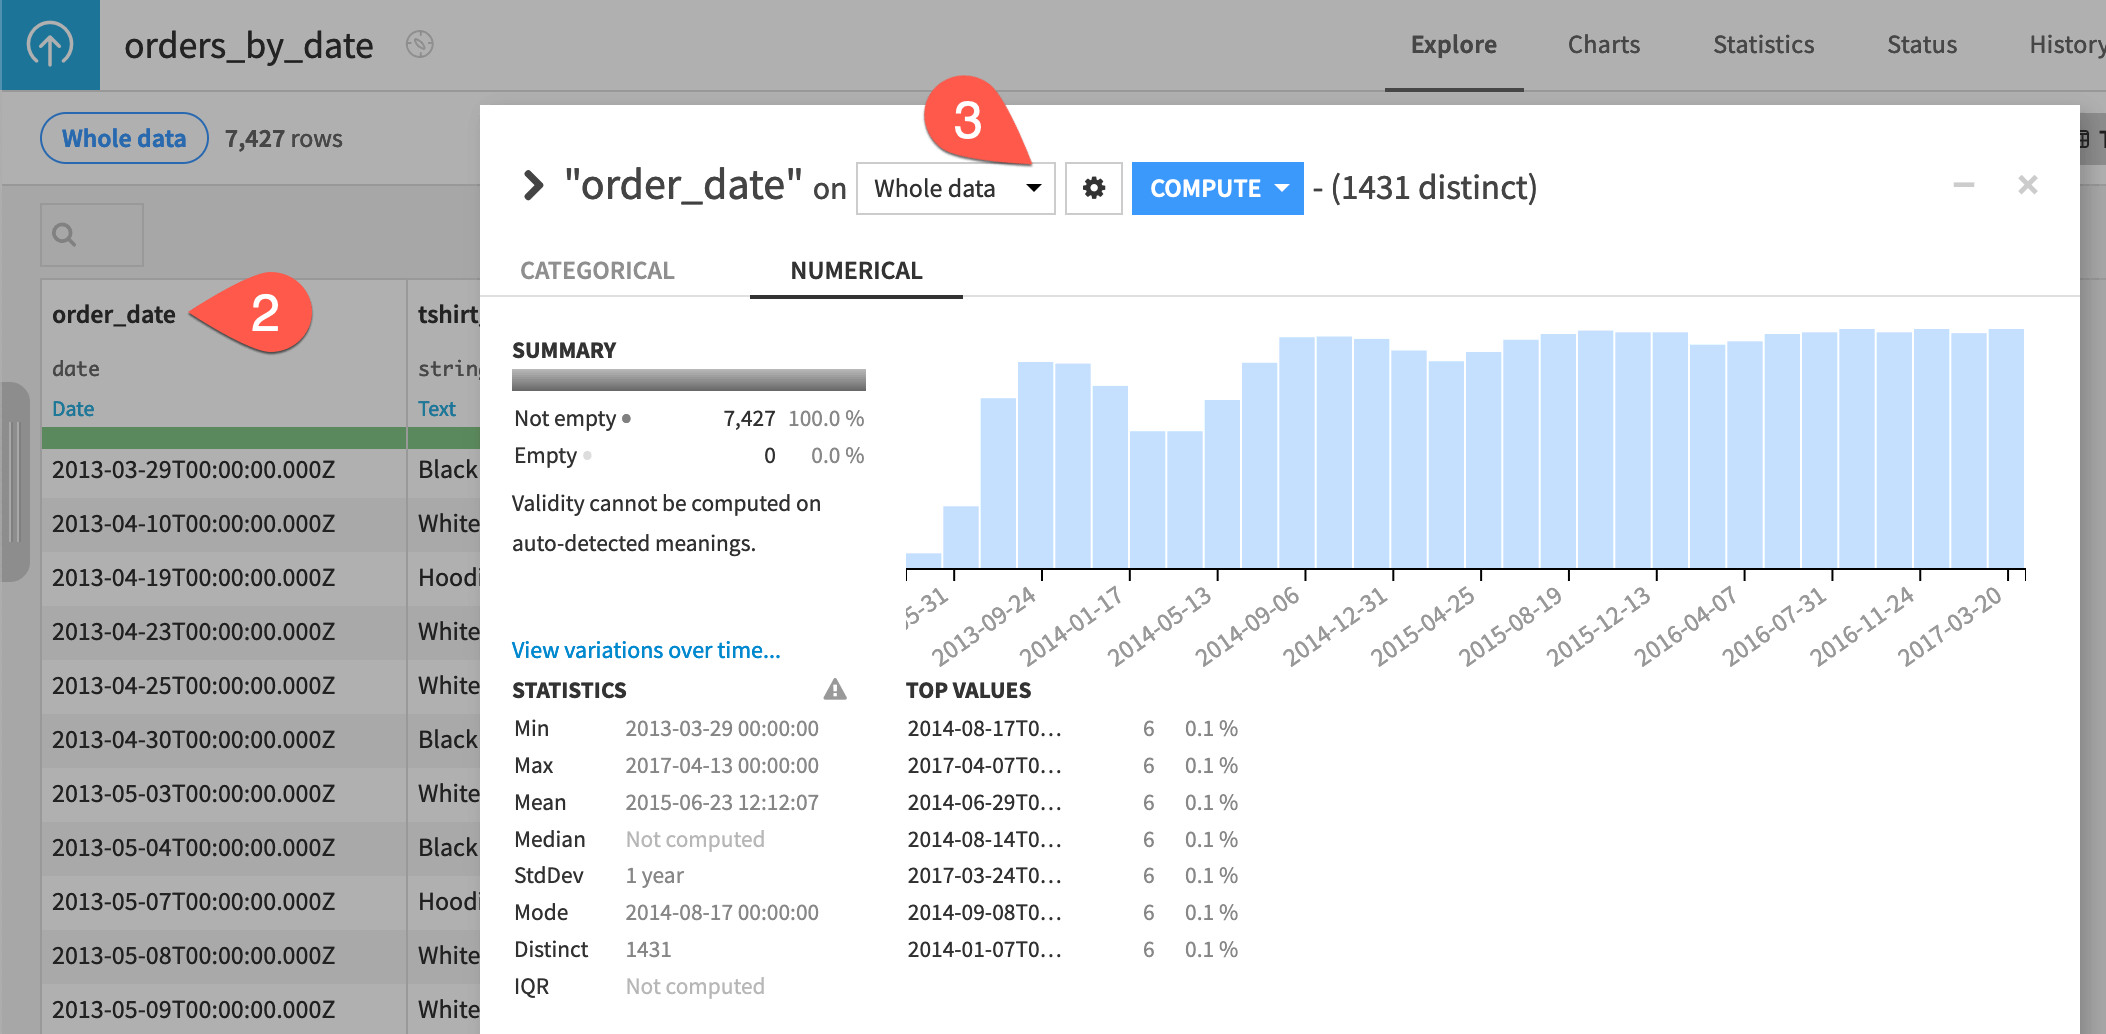
The order_date column isn’t equally spaced. Many dates appear to be missing, and there are large gaps in the timestamps.
Open the orders_by_date dataset.
Open the order_date column header dropdown, and select Analyze.
Change from Sample to Whole data, and click Save and Compute.
Multiple time series#
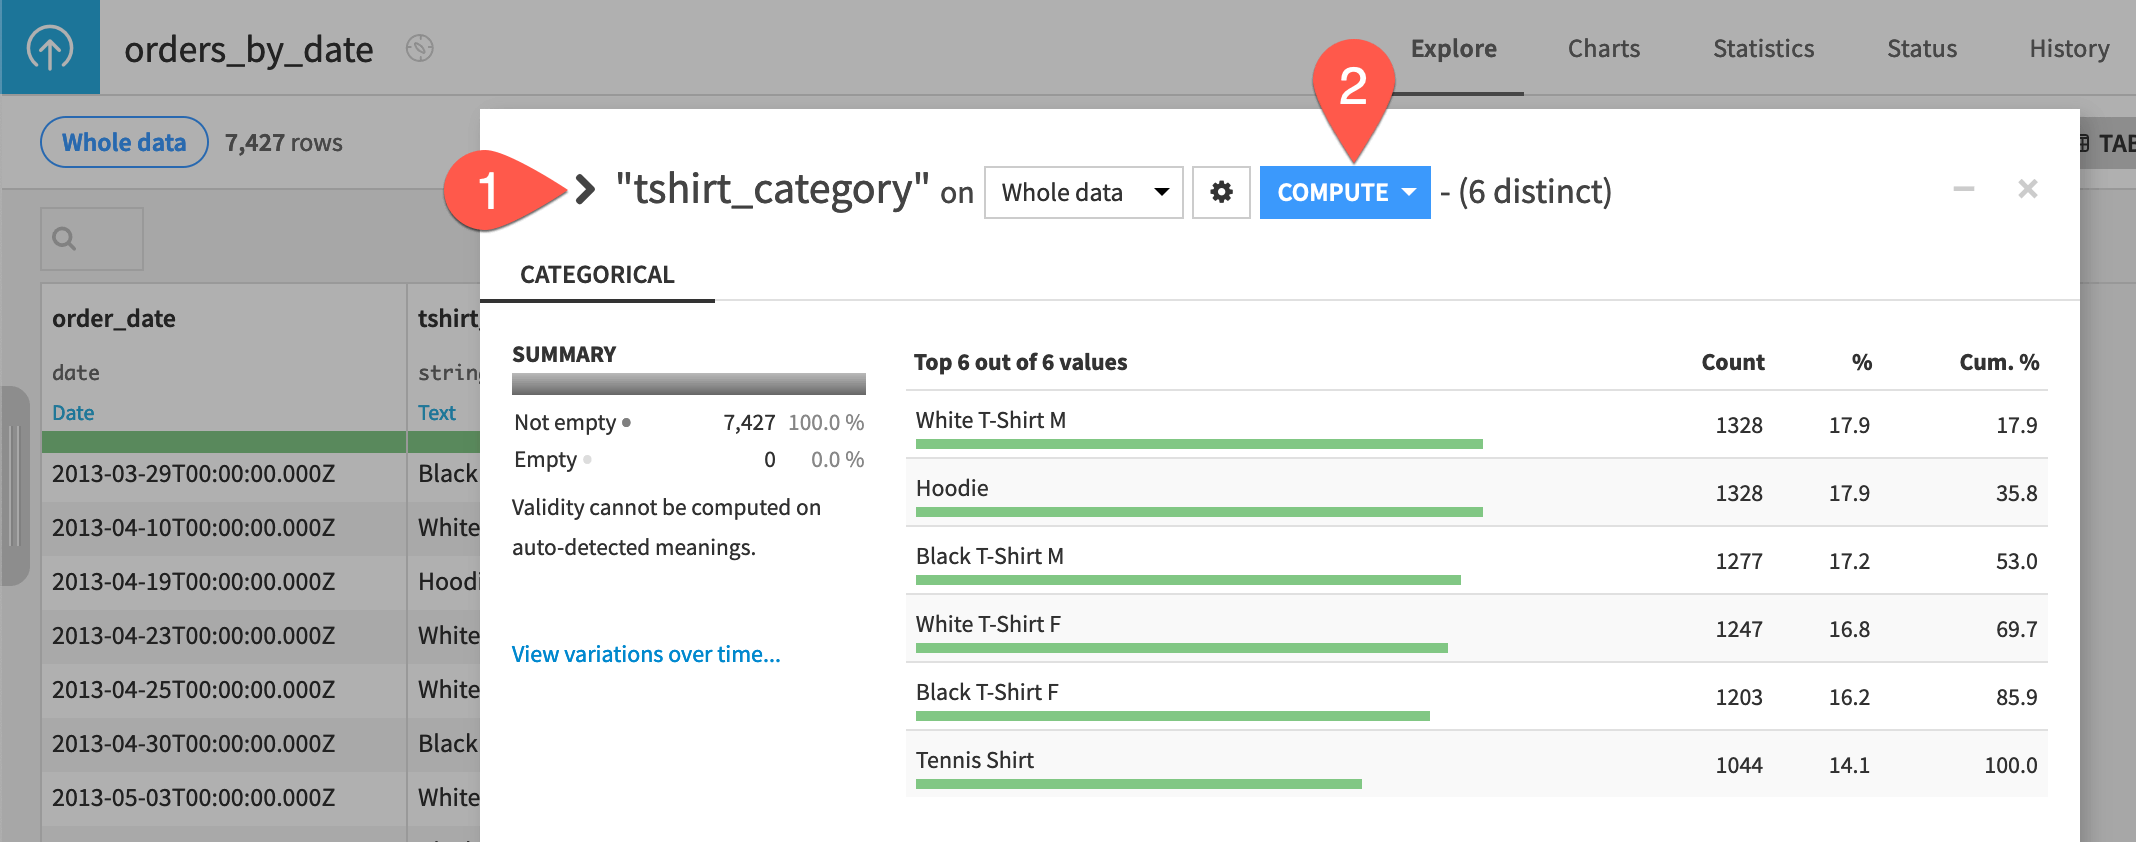
The dataset consists of six independent time series (one for each value of the tshirt_category column). Also, the length of each series isn’t the same.
In the Analyze window for the orders_by_date dataset, use the arrows at the top left to analyze the tshirt_category column.
Click Compute on this column.
Multivariate time series#
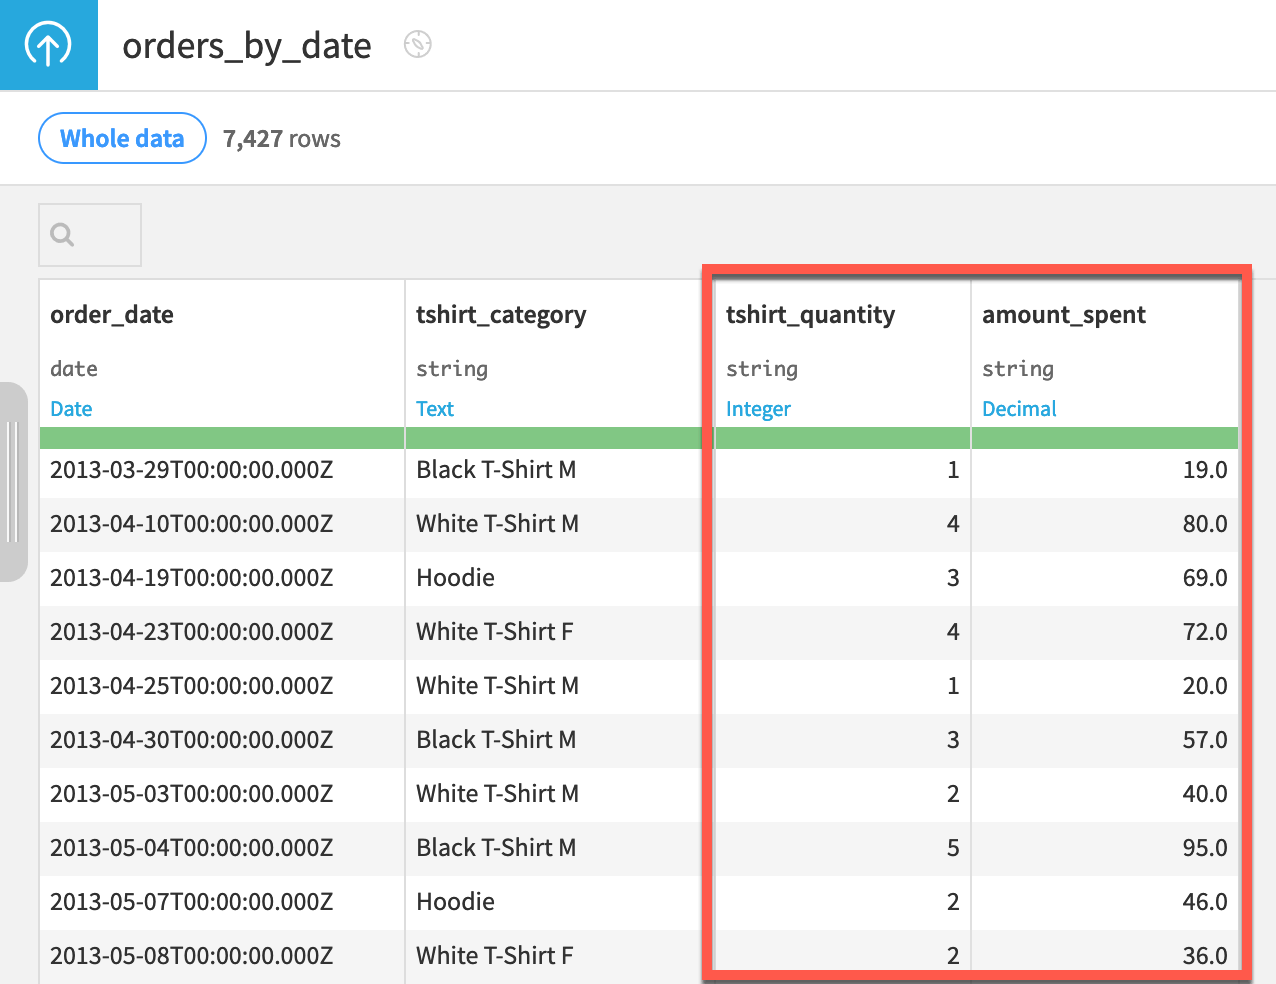
Each independent time series consists of two variables (or dimensions): tshirt_quantity and amount_spent. There is a simple, mathematical relationship between these two variables.
Important
Also note that the data is stored in long format.
Plot the time series#
The native chart builder has a number of tools to assist with Time series visualization.
Create a line plot#
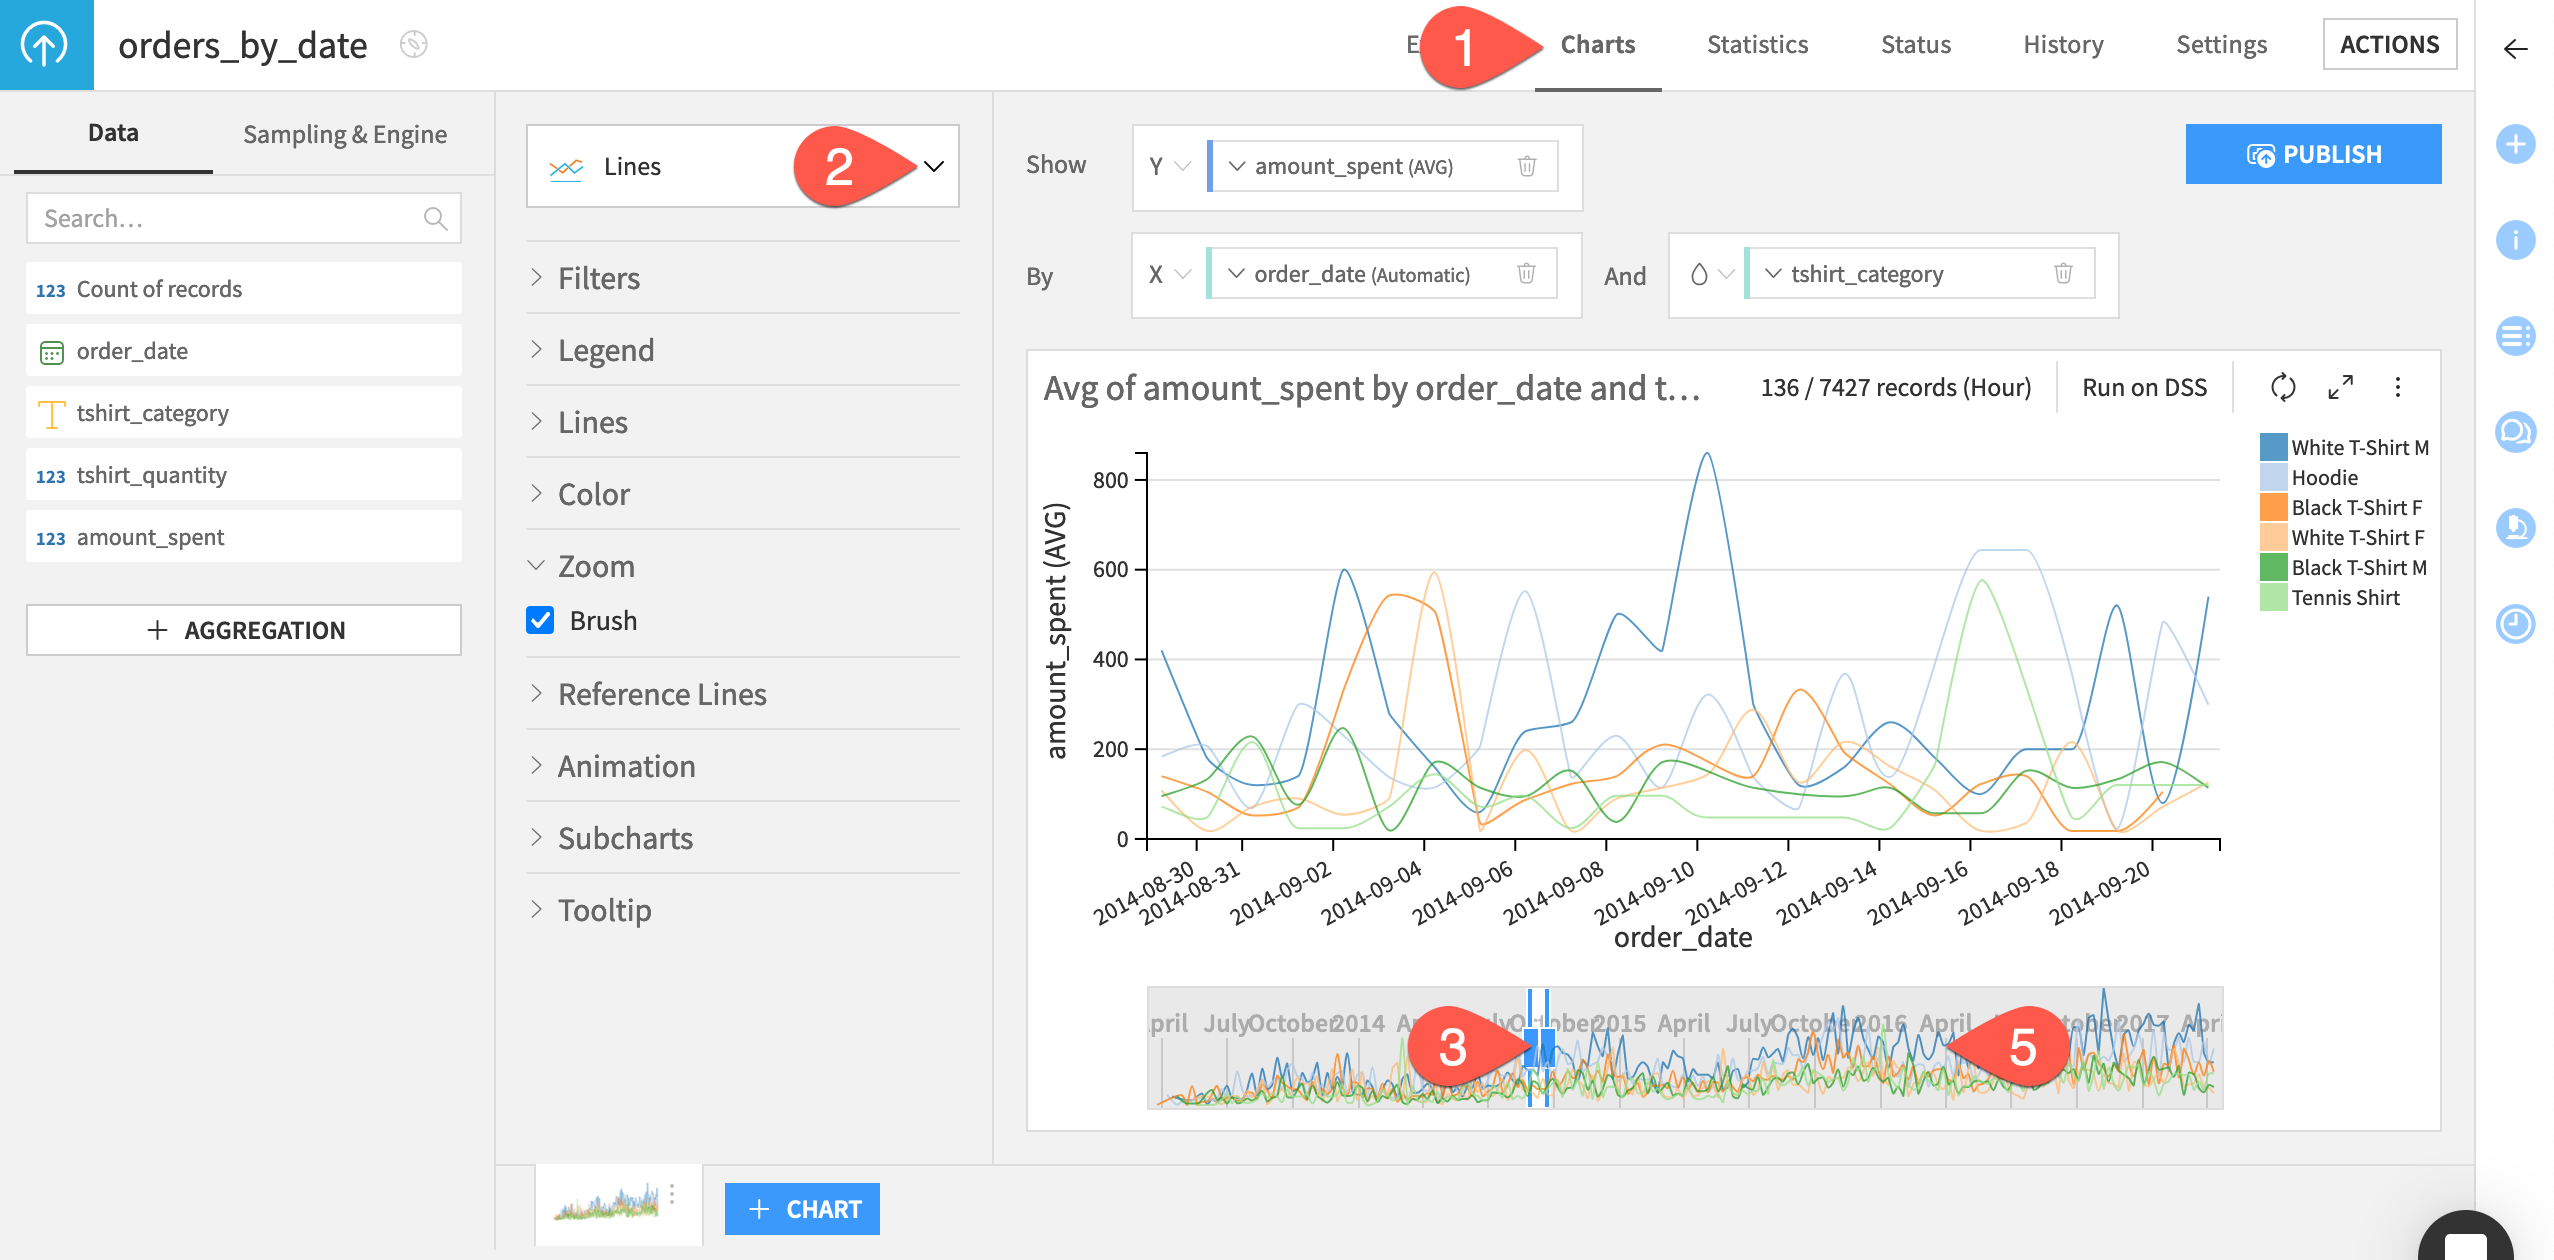
A basic bar chart for this dataset of amount_spent by order_date and colored by tshirt_category already exists in the starter project. Let’s turn it into a line chart.
Navigate to the Charts tab of the orders_by_date dataset.
In the existing bar chart, use the chart picker to switch to a Lines chart.
Now with a brush zoom option underneath the chart, reduce the range of the time series displayed in the main chart by dragging the bars of the brush area closer together.
Click and drag the brush area to pan trends in the main line plot.
Double click anywhere in the brush area to reset the plot to the full range.
Create a bar plot regrouped by a time unit#
If you click on order_date in the X axis field, you’ll see that the date ranges are set to Automatic. Because of this dynamic timeline, the units automatically adjust as you change the size of the display range.
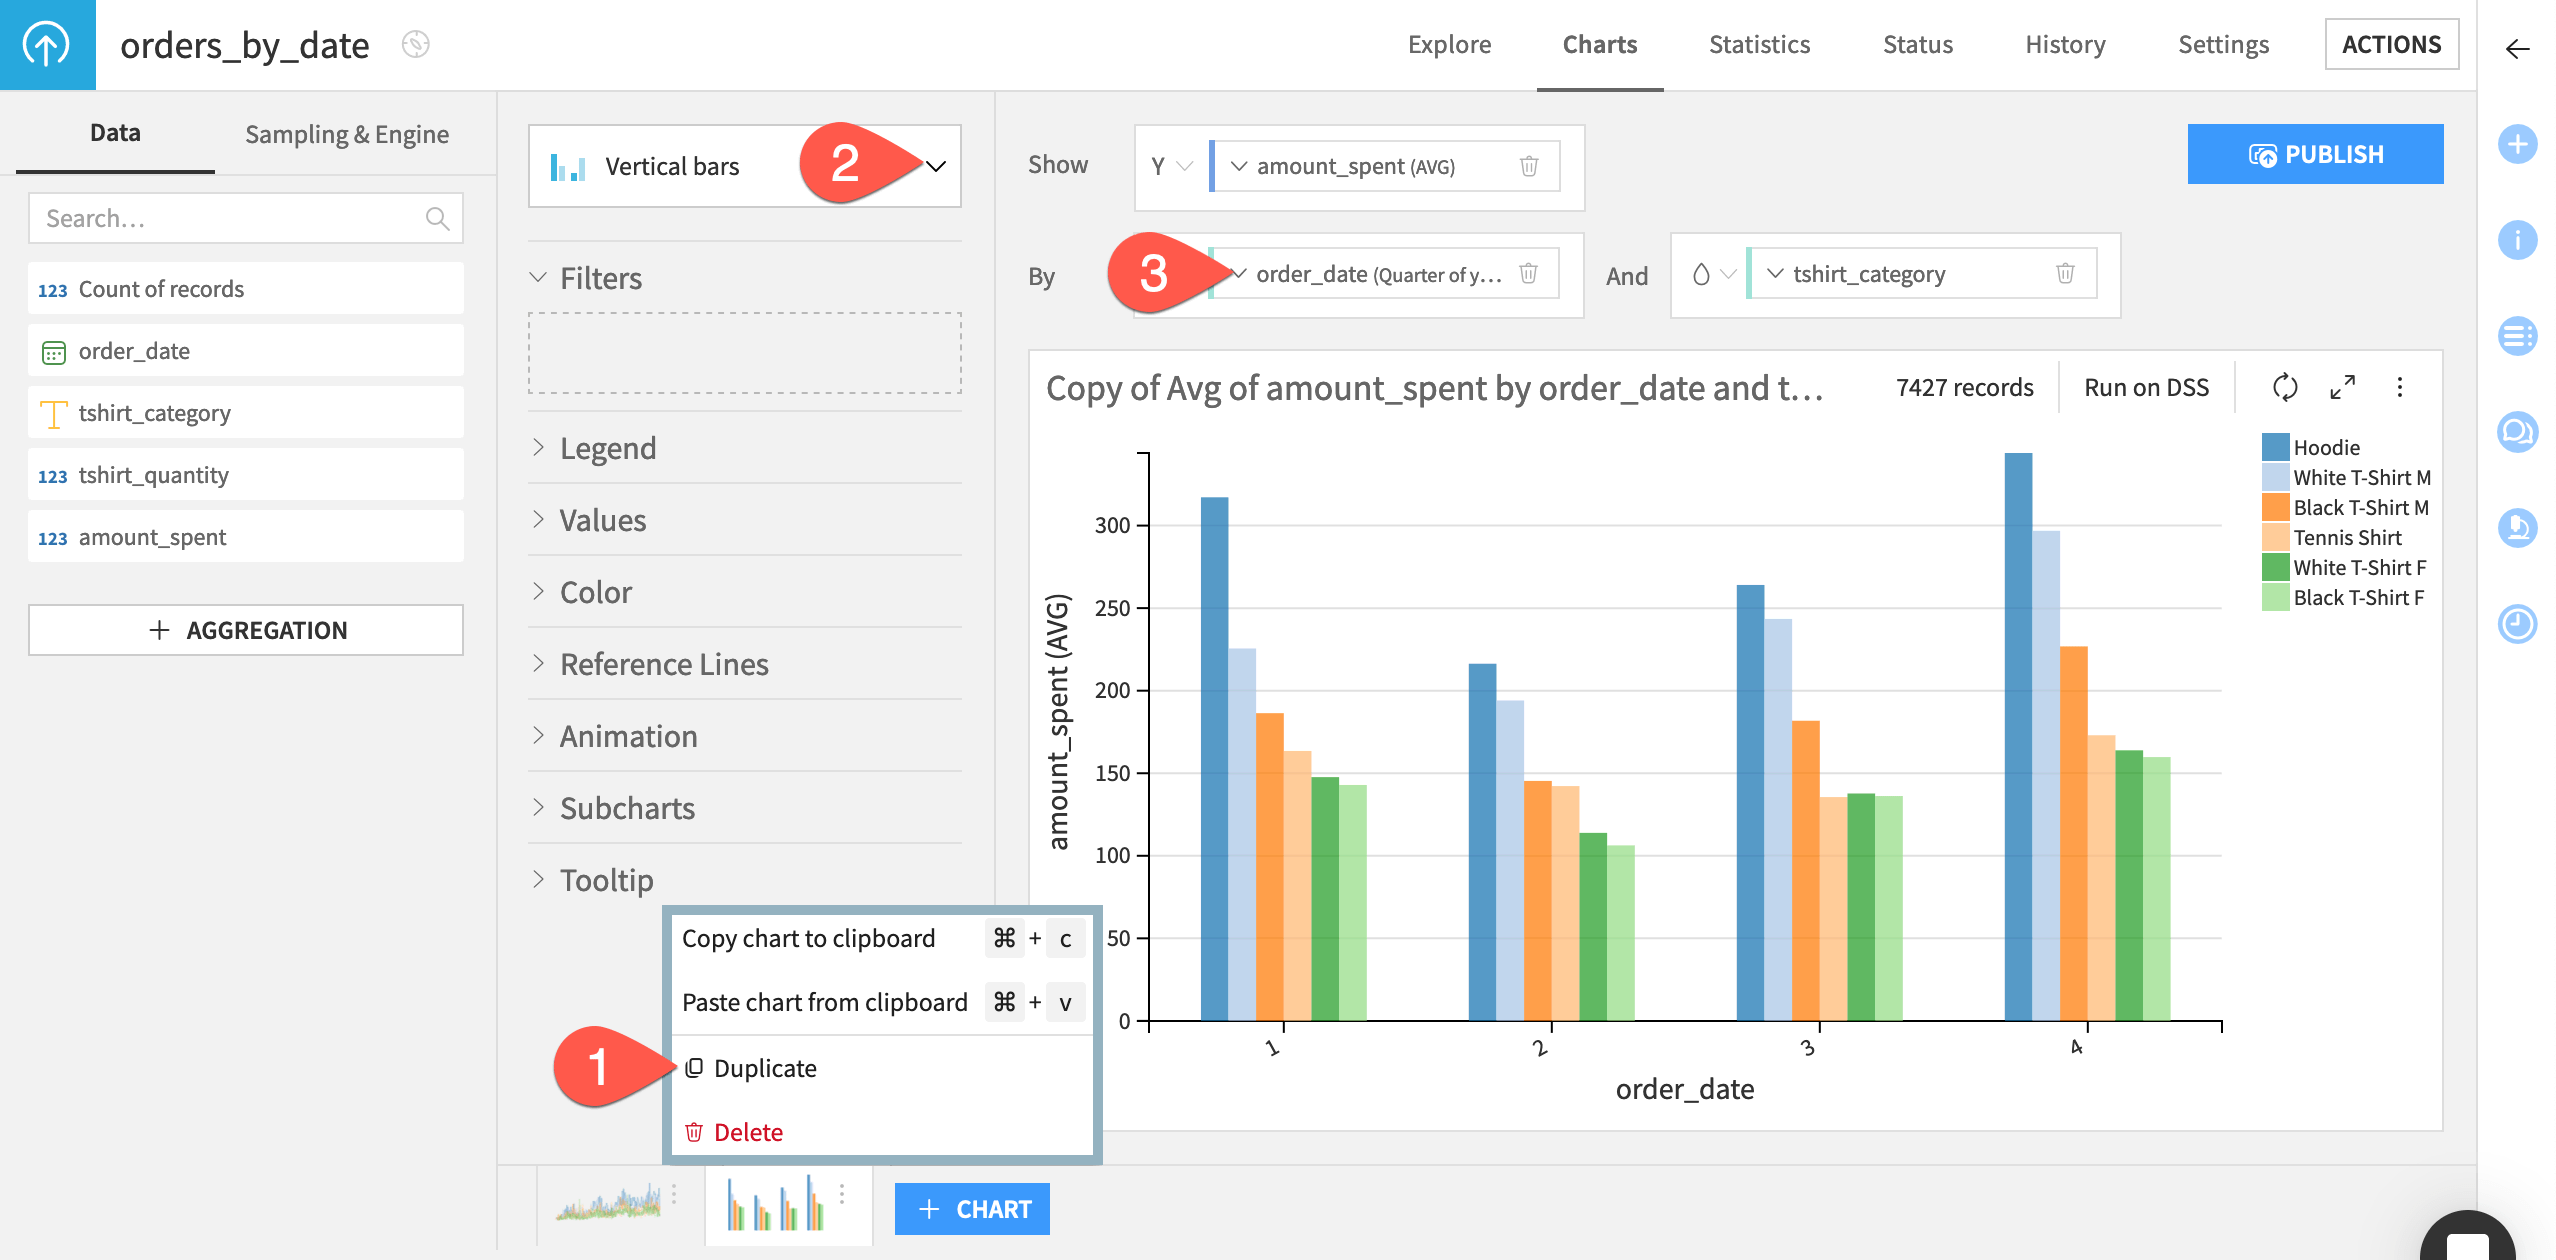
You can also choose a fixed timeline or several regroup options that aggregate observations by your choice of time unit. Let’s show the data aggregated by quarter of year.
From the vertical dots menu of the first chart at the bottom left, select Duplicate.
Use the chart picker to switch to a Vertical bars chart.
Open the dropdown for order_date in the X axis. Change the date range from Automatic to Quarter of year.
Resample time series data#
Many common time series operations assume (if not explicitly require) equally spaced timestamps. If our data doesn’t have them, we can create them with the Resampling recipe.
Note
See Concept | Time series resampling for a detailed walkthrough if unfamiliar with the recipe.
Equally space timestamps#
As shown above, the orders_by_date dataset doesn’t have equally spaced timestamps so let’s fix this!
Create a Resampling recipe#
Let’s start by defining the recipe’s input and output datasets.
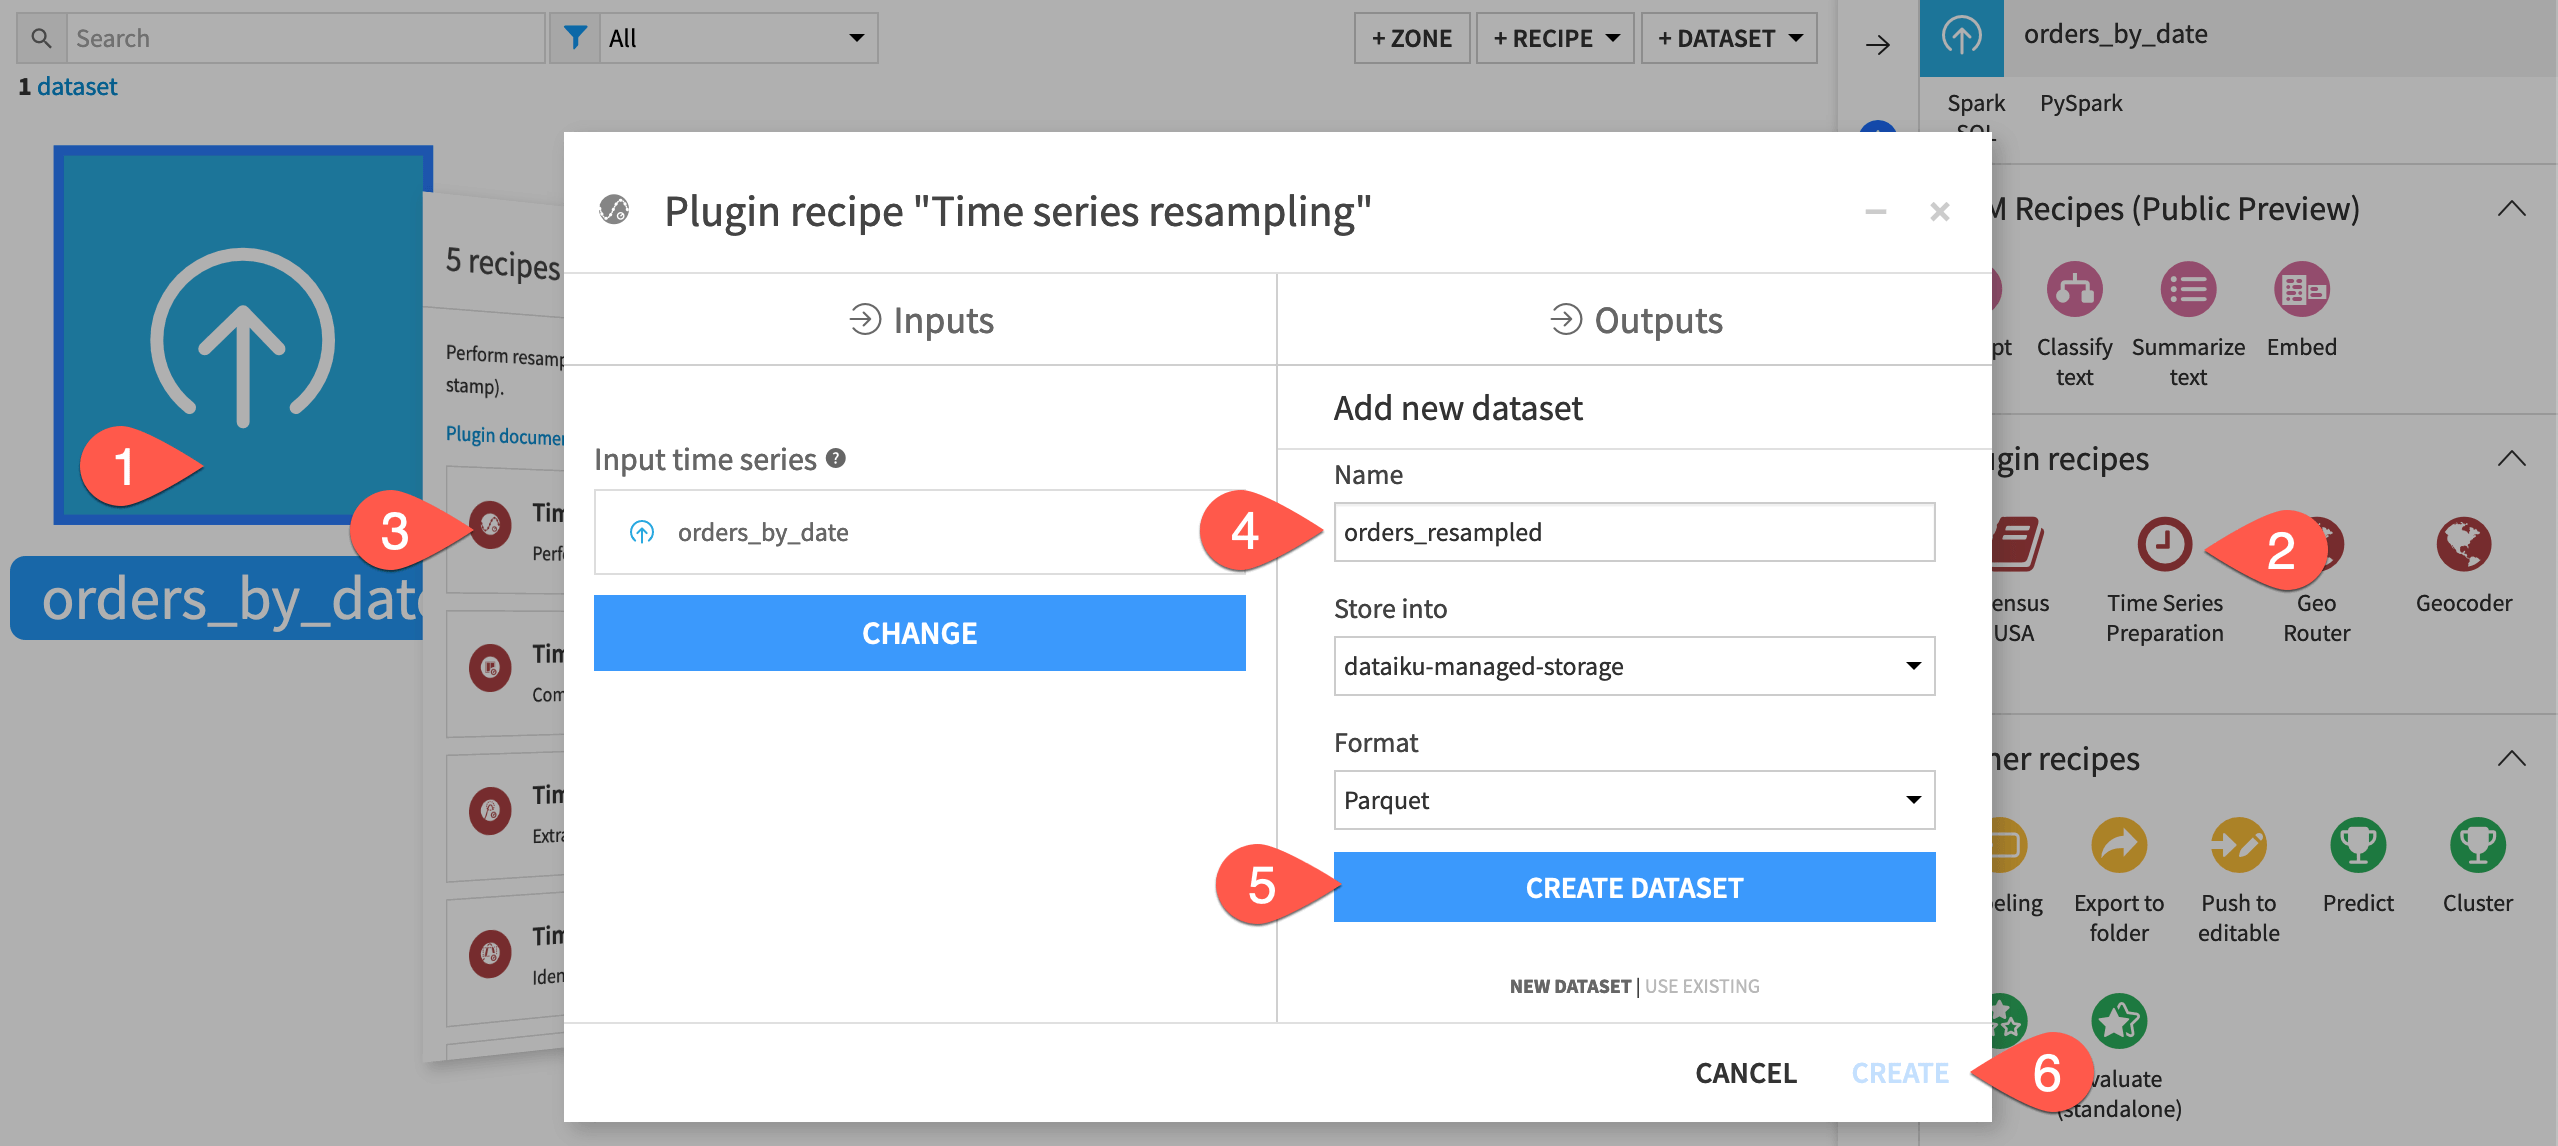
From the Flow, select the orders_by_date dataset.
In the Actions tab of the right panel, select Time Series Preparation from the menu of plugin recipes.
Select the Time series resampling recipe from the dialog.
In the new dialog, click Set, and name the output dataset
orders_resampled.Click Create Dataset to create the output.
Click Create to generate the recipe.
Configure the Resampling recipe#
Now we can configure the recipe’s parameters.
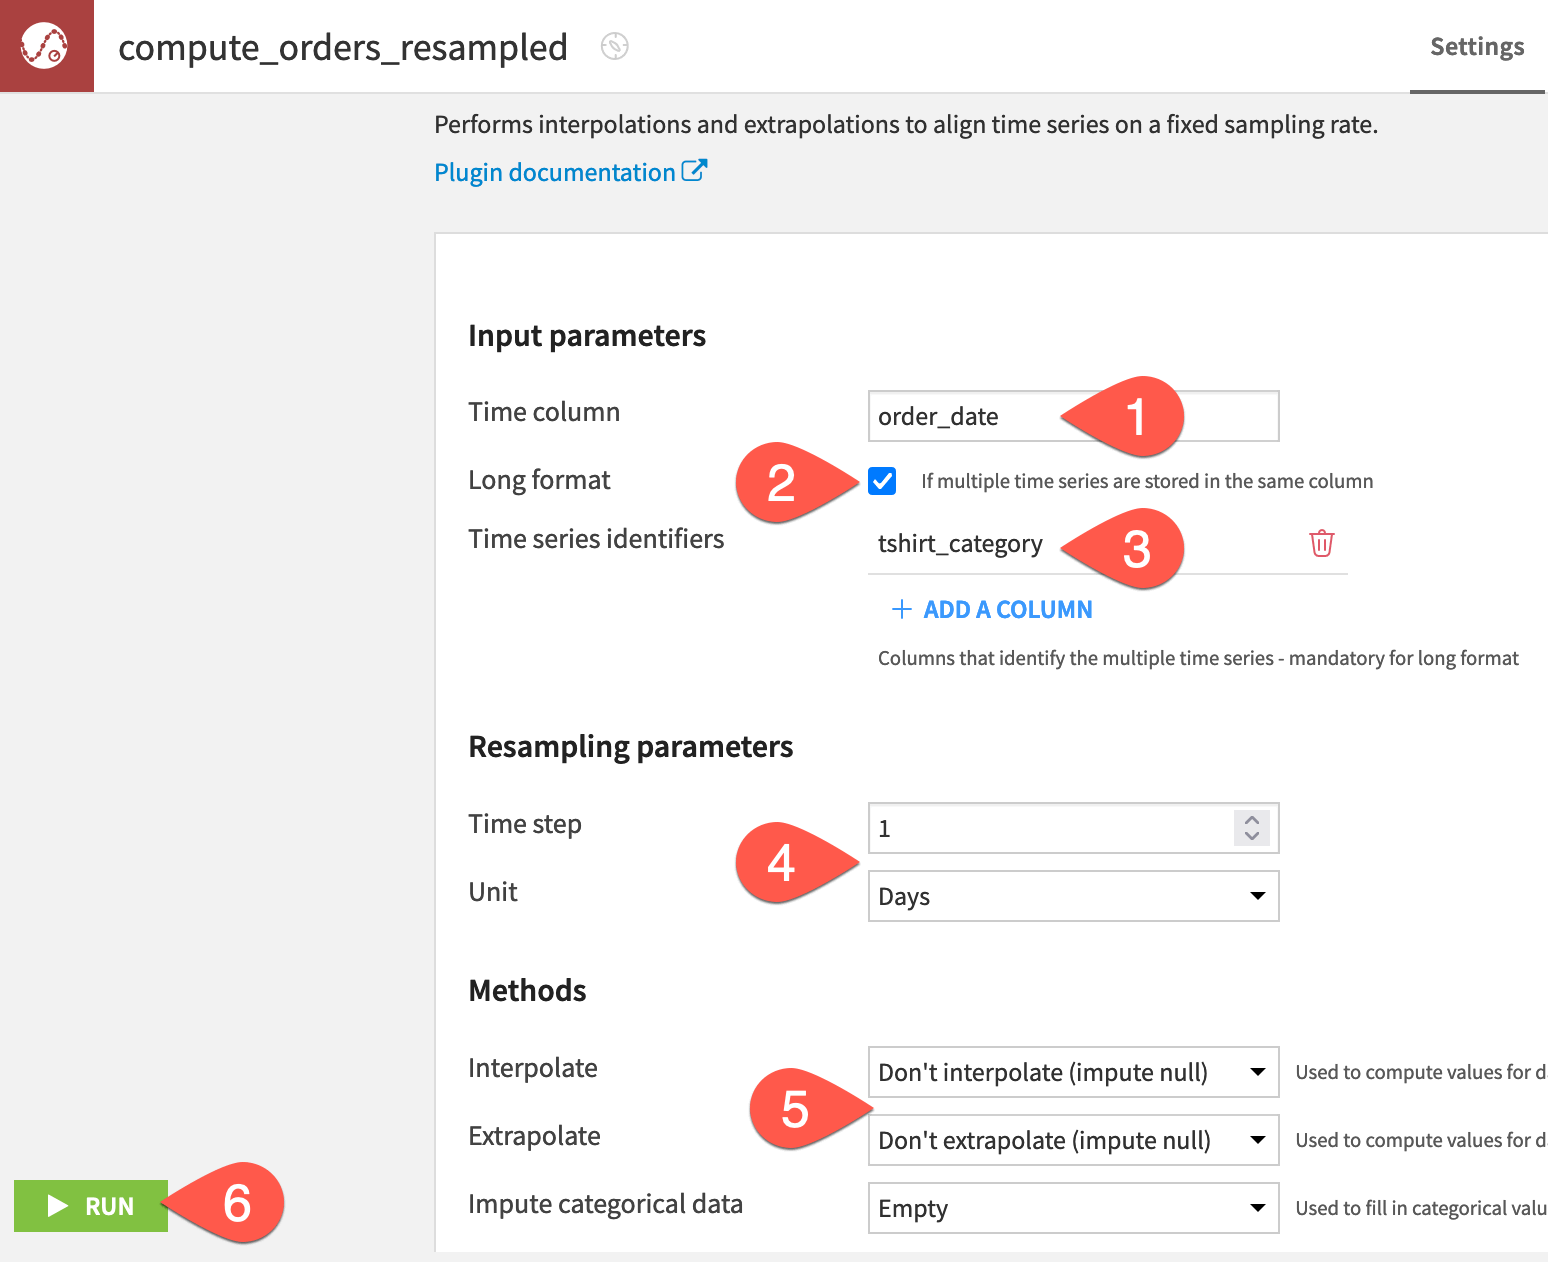
Set the value of the time column to order_date since that column holds the timestamps (a parsed date column is required).
Because our data has multiple time series, check the Long format box.
Click + Add a Column, and select tshirt_category as the column identifying the multiple time series.
For the Resampling parameters, specify a time step of
1and a unit of Days.For this first attempt, in the Methods section, set interpolate to Don’t interpolate (impute null) and extrapolate to Don’t extrapolate (impute null).
At the bottom left, click Run, and open the output dataset when finished.
Inspect the equispaced output#
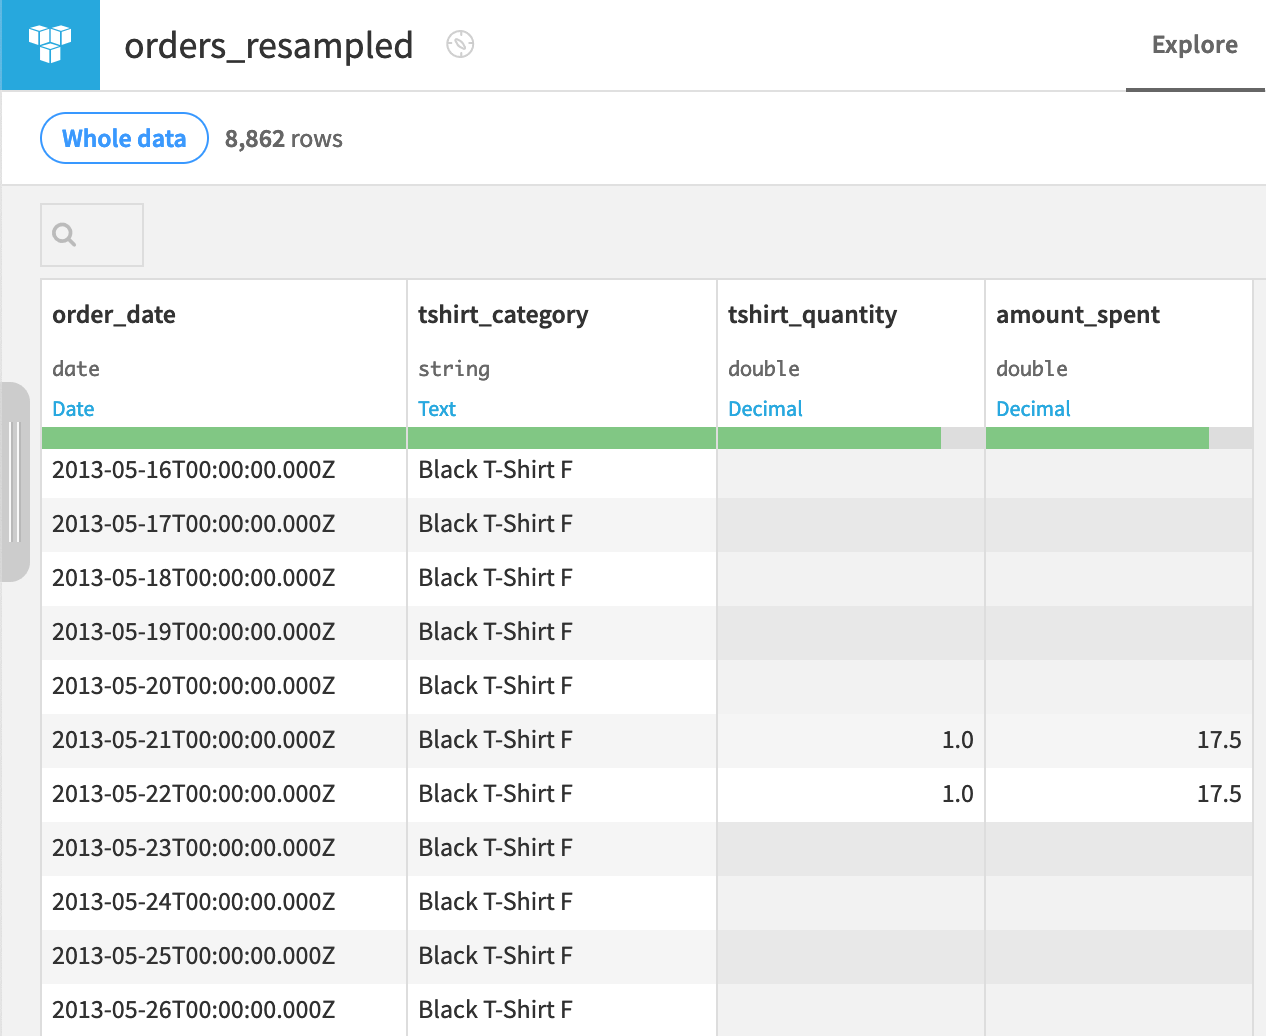
Confirm for yourself the following facts about the resampled output dataset.
The data is sorted first alphabetically by tshirt_category, and then chronologically by the order_date column.
The order_date column now consists of equispaced daily samples. No dates are missing from any independent time series.
All t-shirt category series begin from the earliest true data point and end at the latest true data point.
Because we chose not to interpolate or extrapolate values for the missing timestamps, when the recipe adds these rows, it returns them with empty values for all dimensions (tshirt_quantity and amount_spent).
Interpolate and extrapolate values#
We now have equispaced timestamps, but what values can or should we infer for the new empty timestamps? The answer depends on the type of data at hand and the assumptions we’re willing to make about it.
For example, we may choose a different method for a continuous quantity, such as temperature, than a non-continuous quantity, such as daily sales figures.
Configure an interpolation and extrapolation method#
An empty value of daily sales figures likely means no sales of that category were made that day. In that case, filling in a constant value of 0 is a reasonable assumption.
Moreover, not all time series for each t-shirt categories begin on the same day. In this case, extrapolating a constant value of 0 would also make sense.
From the orders_resampled dataset, click Parent Recipe near the top right.
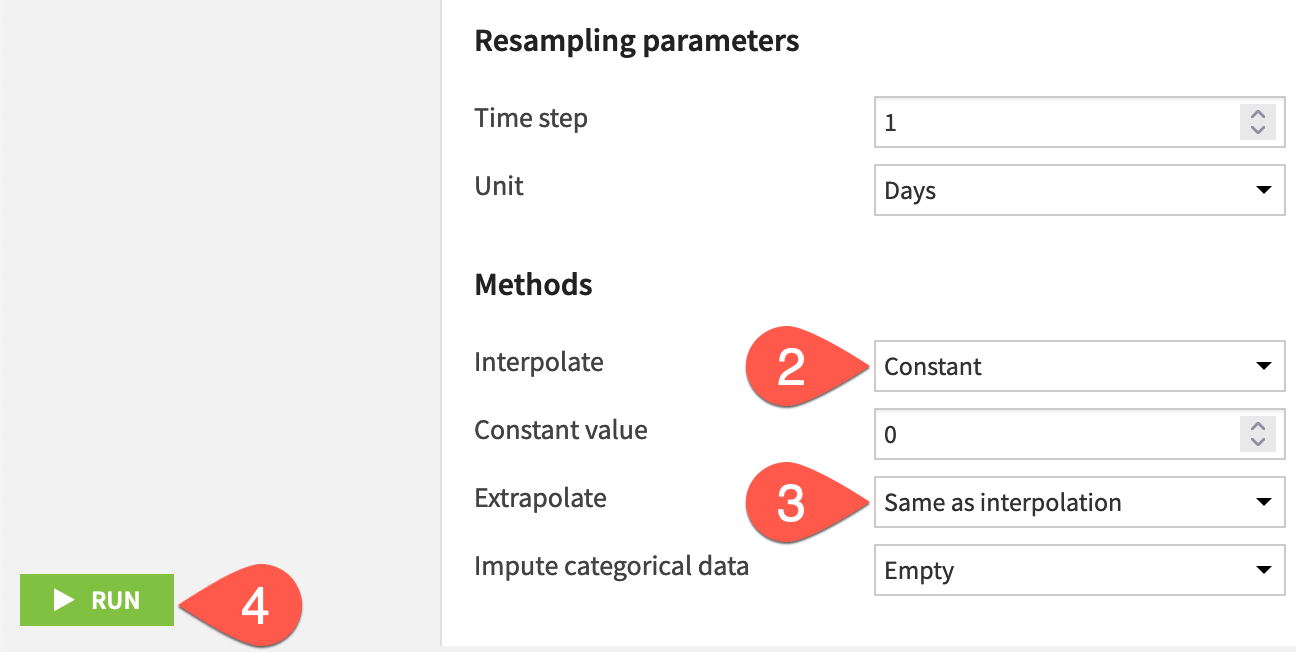
In the Methods section, set the interpolate field to Constant, and keep the default of 0.
Set the extrapolate field to Same as interpolation.
Click Run, and open the output dataset when finished.
Inspect the interpolated and extrapolated output#
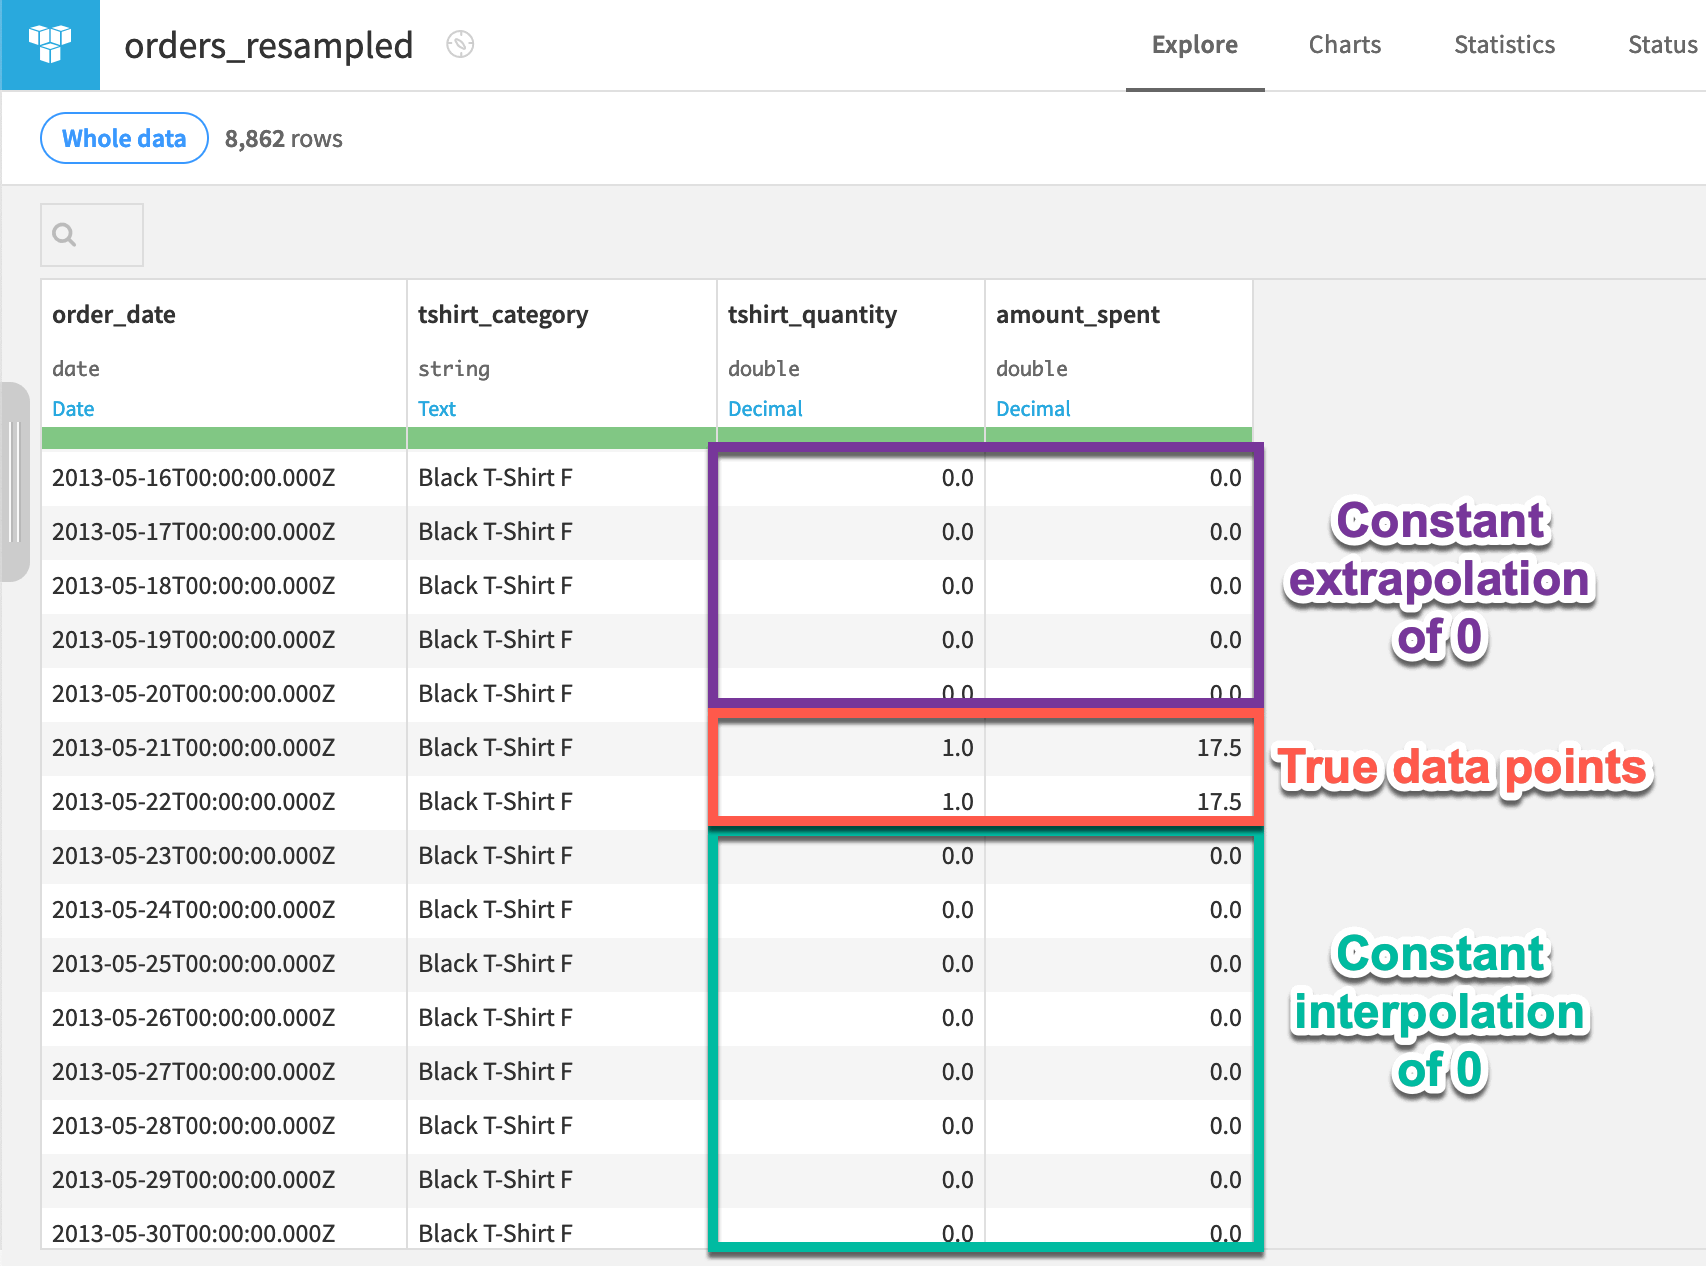
Confirm for yourself the following facts about the resampled output — now interpolated and extrapolated with a constant value of 0.
Because of the chosen extrapolation method, all timestamps in a series before the first true data point (and after the last) have a value of 0.
Because of the chosen interpolation method, all timestamps in a series between true data points have a value of 0.
Important
Values were interpolated and extrapolated for both tshirt_quantity and amount_spent. We never needed to specify those columns in the recipe dialog. Interpolation and extrapolation is applied to all dimensions in the dataset.
Clip and shift time series#
In some cases, we may want to edit the time series themselves. For example in a manufacturing setting, perhaps our instruments take a few seconds before they record proper readings. The Resampling recipe allows us to clip and/or shift values at the beginning or end of a series.
In this case, we have few sales in the first month. Perhaps we want to clip the series so that all series begin from 2013-05-01.
From the orders_resampled dataset, click Parent Recipe near the top right.
In the Advanced parameters section, increase the Clip start to
33.Click Run, and open the output dataset when finished.

Extract intervals from time series data#
Now that the time series are equally spaced, and a constant value of 0 has been used for interpolating and extrapolating missing values, we can safely apply the other recipes in the plugin.
Let’s work at extracting some intervals of interest by using the Interval extraction recipe.
Note
See Concept | Time series interval extraction for a detailed walkthrough if unfamiliar with the recipe.
Basic interval extraction#
The two segment parameters (acceptable deviation and minimal segment duration) are key to understanding the Interval Extraction recipe. For our first attempt though, let’s keep both of these parameters set to 0 days.
Create an Interval Extraction recipe#
Let’s start by defining the recipe’s input and output datasets.
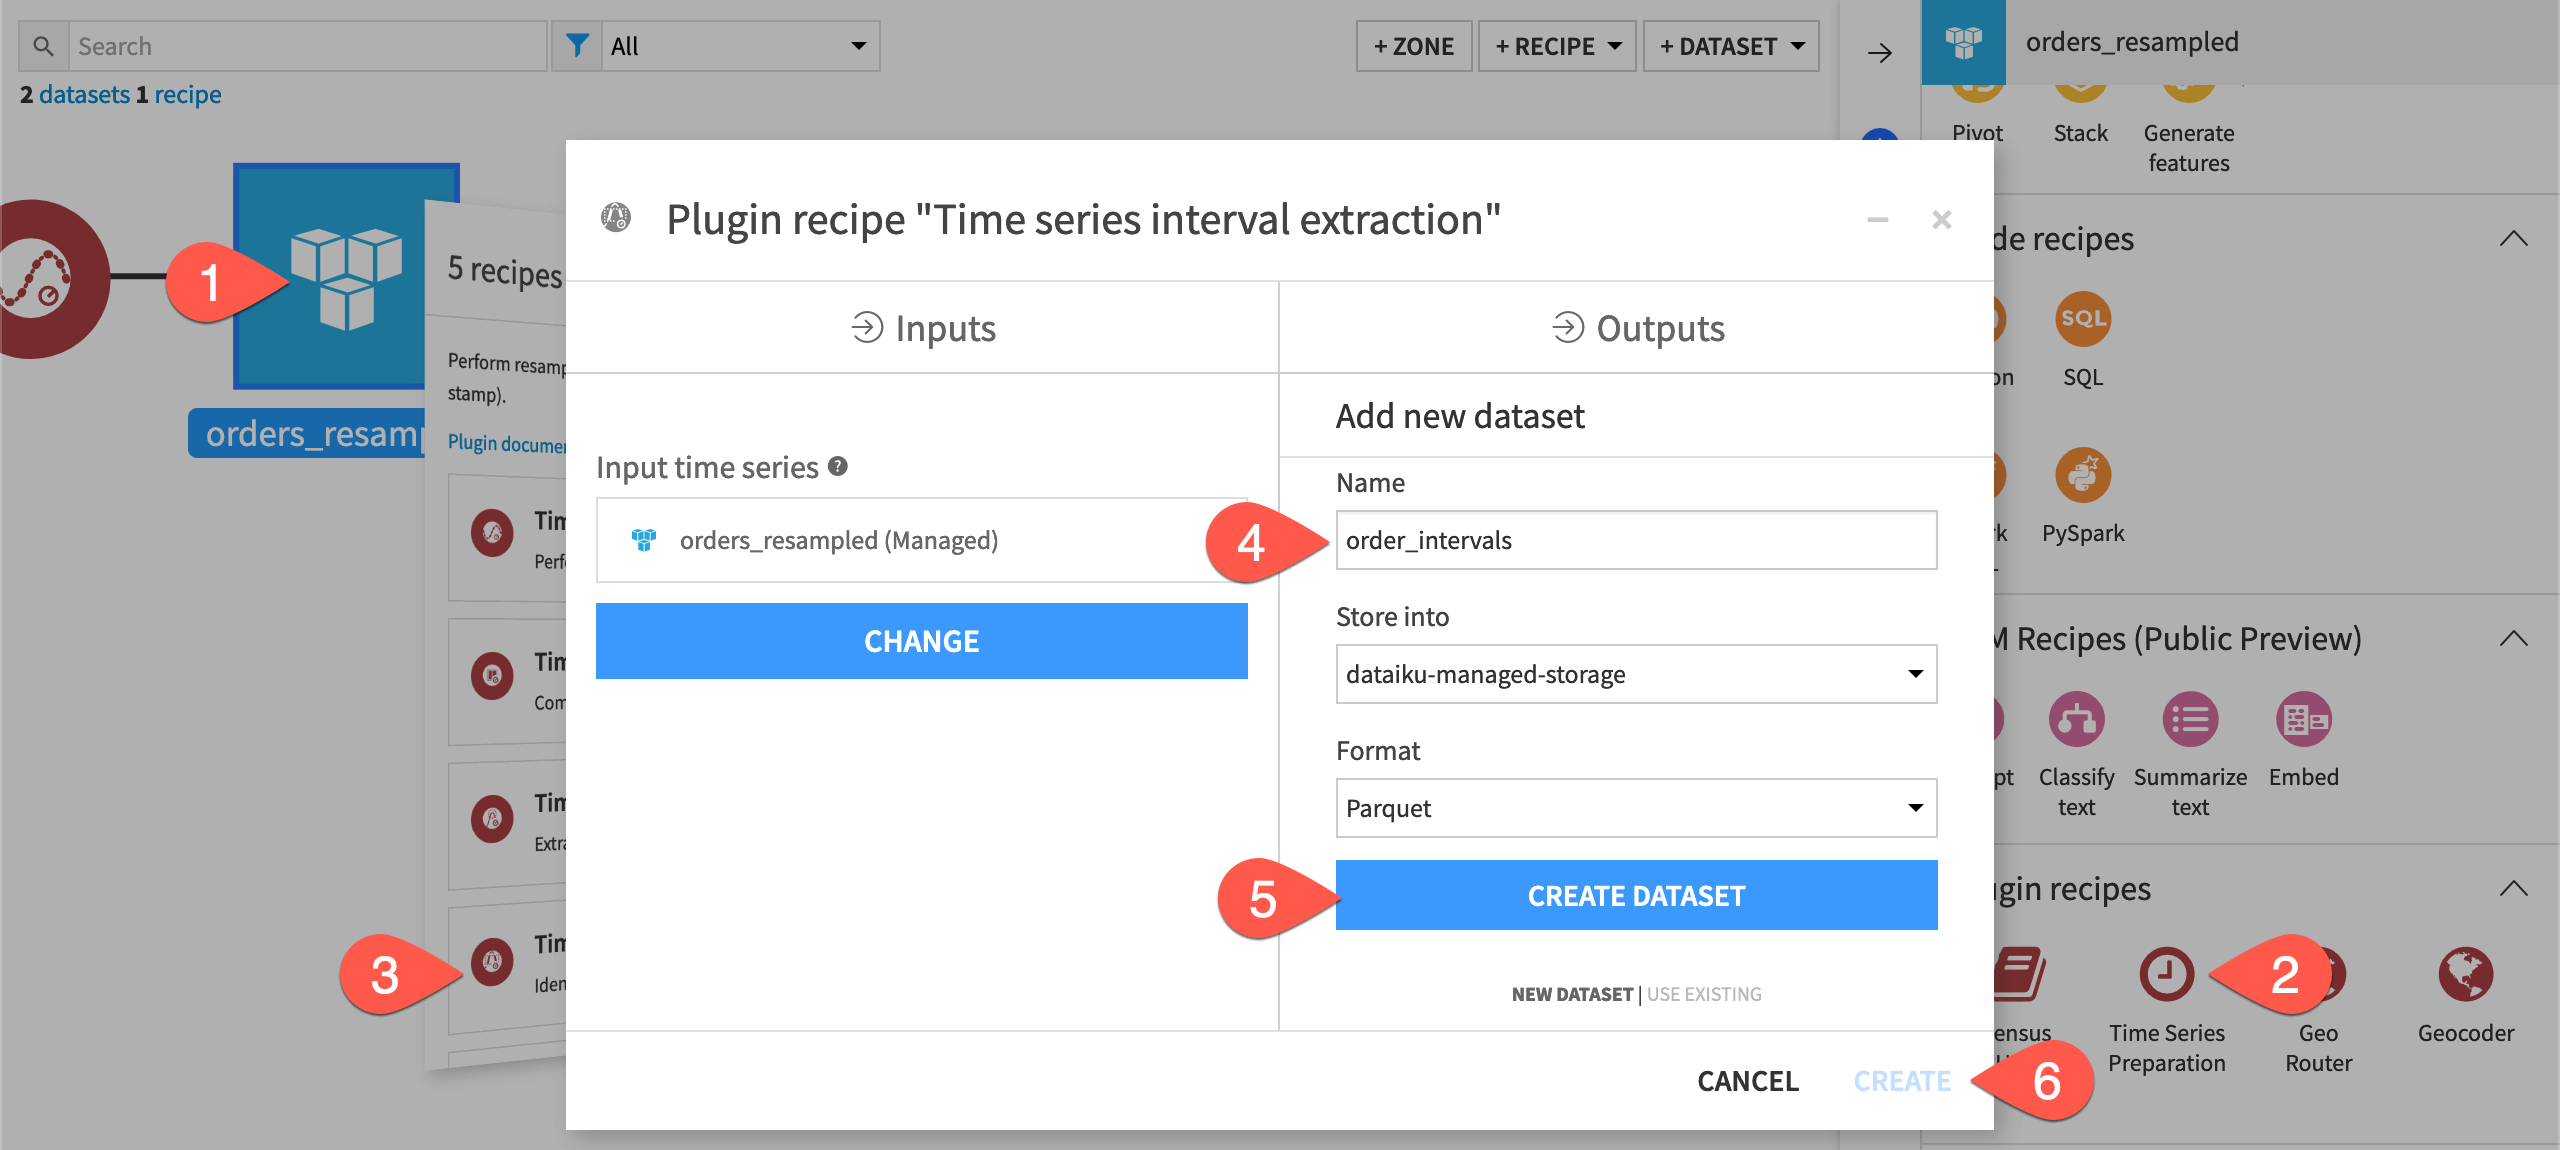
From the Flow, select the orders_resampled dataset.
In the Actions tab of the right panel, select Time Series Preparation from the menu of plugin recipes.
Select the Time series interval extraction recipe from the dialog.
In the new dialog, click Set, and name the output dataset
orders_intervals.Click Create Dataset to create the output.
Click Create to generate the recipe.
Configure the Interval Extraction recipe#
Now we can configure the recipe’s parameters. Let’s identify intervals of above-average sales figures for this example.
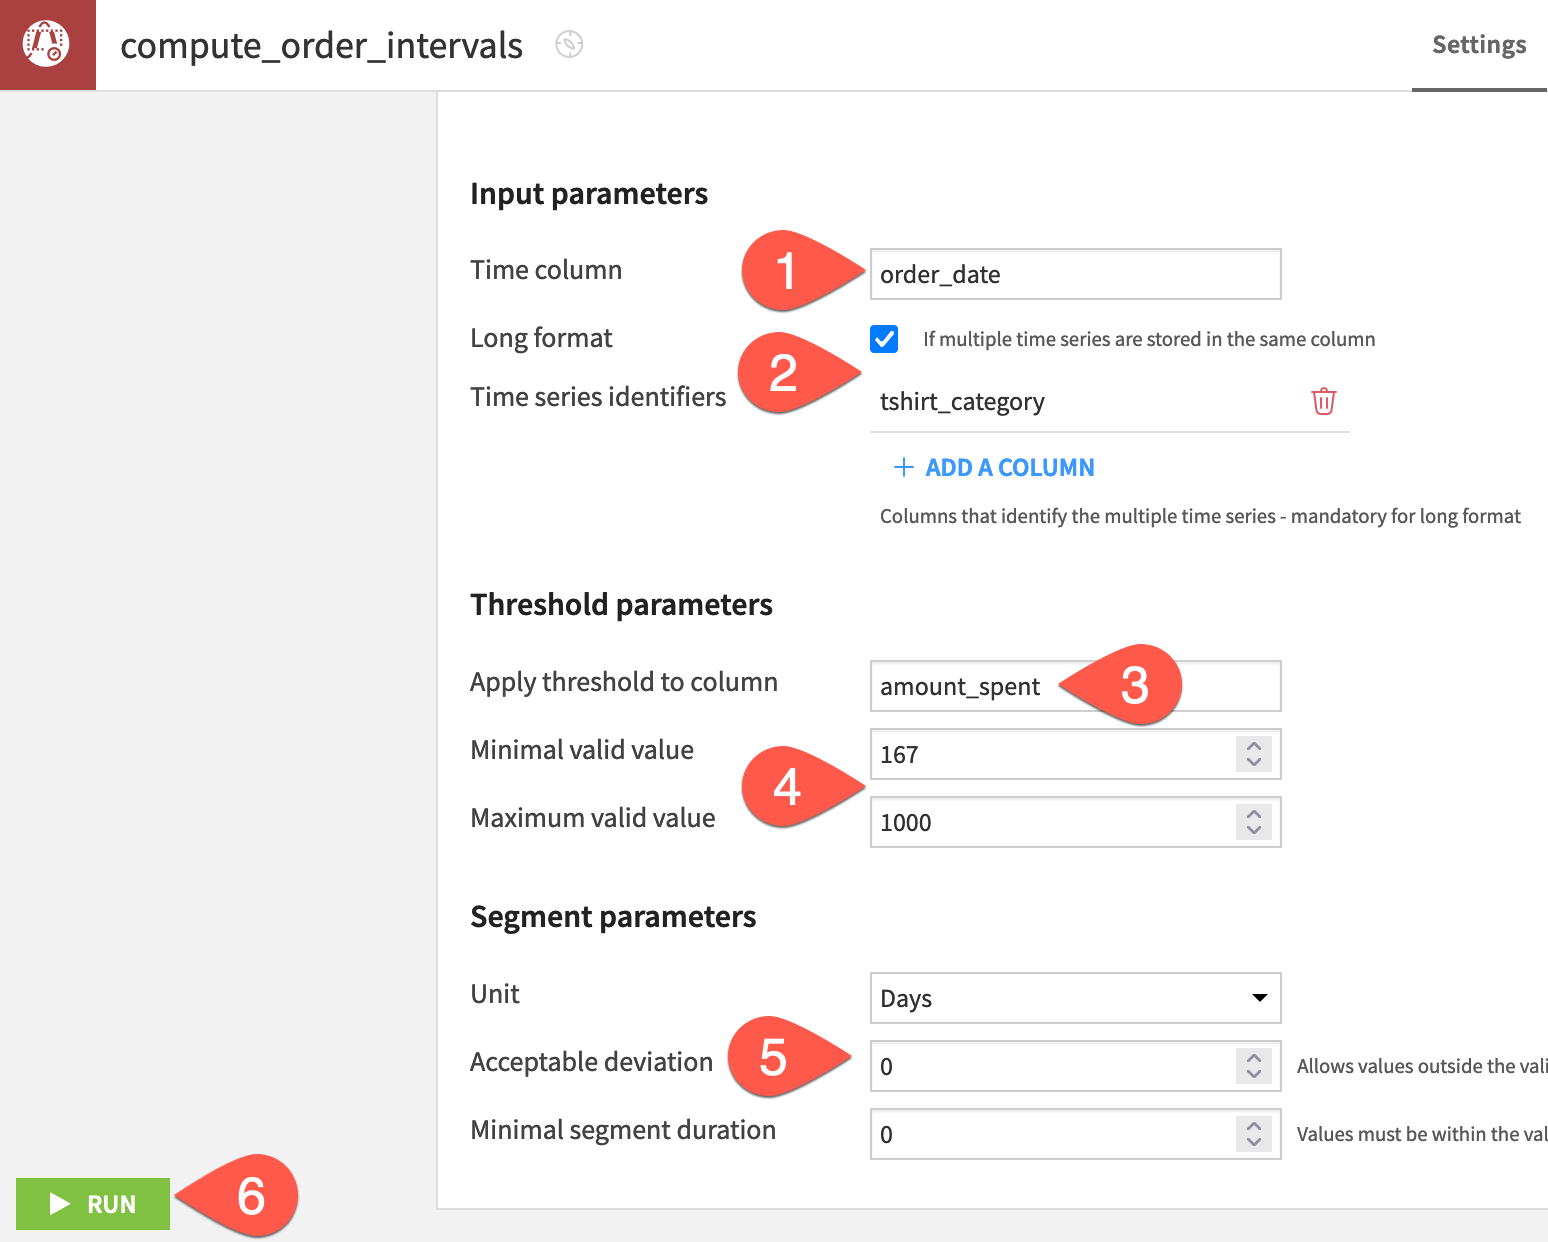
For the time column, select order_date (A parsed date is required).
Check the box to indicate the data is in Long format, and provide tshirt_category as the identifier column.
Apply the threshold to the amount_spent column (A numeric column is required).
Set the minimal valid value to the mean value
167, and the maximum valid value to an arbitrary1000.Change the segment unit to Days, the acceptable deviation to
0, and the minimal segment duration to0.Click Run, and open the output dataset when finished.
Inspect the extracted intervals#
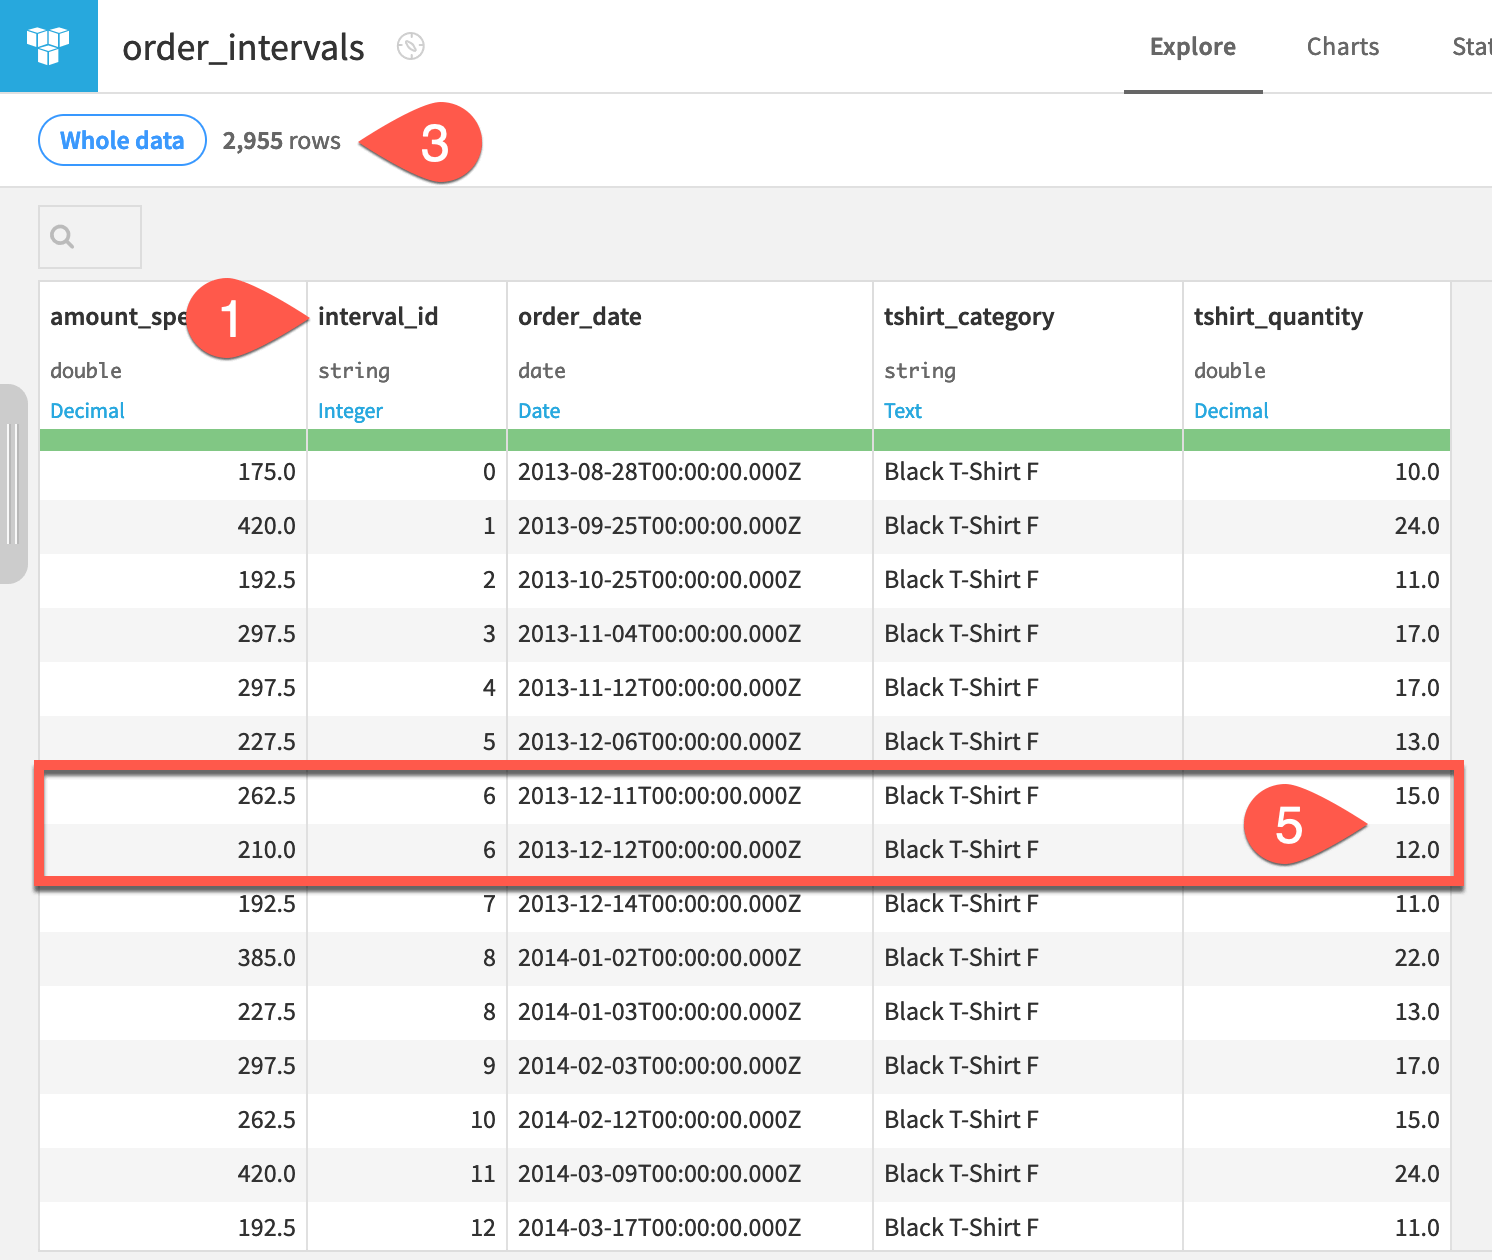
Confirm for yourself the following facts about the extracted intervals output.
The output includes the original four input columns, plus one new column, interval_id.
Each independent time series in the dataset has its own set of interval IDs, with each set starting from 0.
Rows not qualifying for an interval ID are excluded from the output, and so the output has fewer rows than the input.
Because there is no minimal segment duration, intervals in the threshold range as short as 1 day are assigned an ID.
Because there is no acceptable deviation, timestamps sharing the same interval ID (such as 6, 8, or 12 for Black T-Shirt F) must be consecutive days during which the amount_spent is within the threshold range.
Restrict intervals with a minimal segment duration#
Many of the interval IDs in the output above only consist of one or two timestamps. We can specify a minimal segment duration to enforce a minimum requirement for the length of an interval, thereby filtering out intervals shorter than a specified value.
Let’s return to the parent recipe that produces the order_intervals dataset.
From the order_intervals dataset, click Parent Recipe near the top right.
Set the minimal segment duration to
2days.Click Run, and open the output dataset when finished.
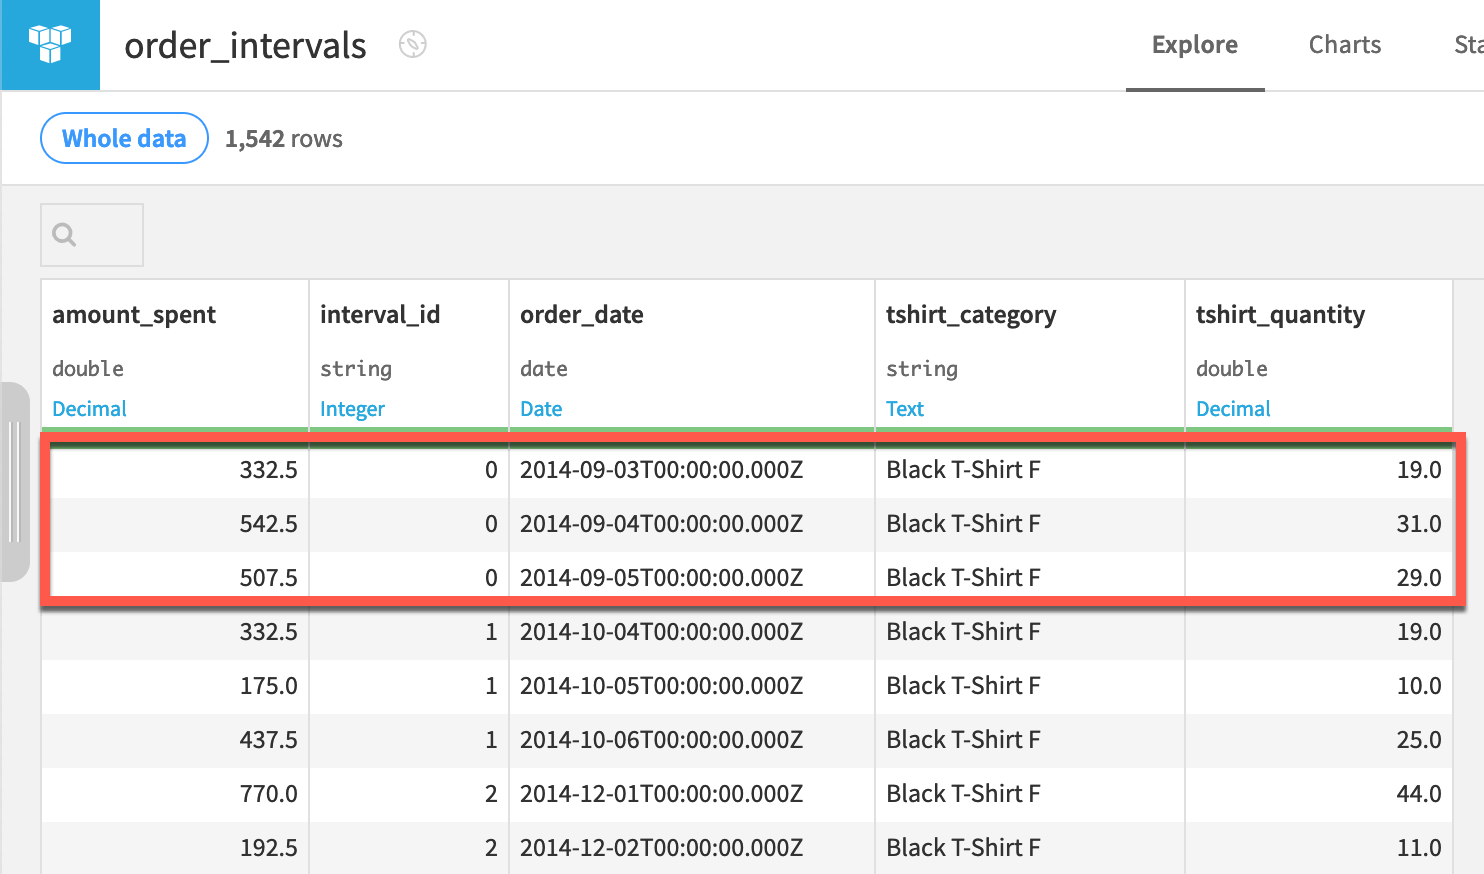
Let’s analyze the first interval ID for the Black T-Shirt F category.
Three consecutive timestamps are assigned to the interval ID 0.
All three of these values are within the threshold range. There are no deviations.
The difference between the final valid timestamp (2014-09-05) and the first valid timestamp (2014-09-03) is two days, which satisfies the minimal segment duration requirement.
Expand intervals with an acceptable deviation#
Increasing the value of the minimal segment duration parameter imposes a higher standard for assigning interval IDs, thereby reducing the number of rows in the output dataset.
Now, let’s increase the value of the acceptable deviation parameter. Doing this should produce the opposite effect, as we will be relaxing the requirement that all values of a valid interval lie within the threshold range.
From the order_intervals dataset, click Parent Recipe near the top right.
Set the acceptable deviation to
1day.Click Run, and open the output dataset.
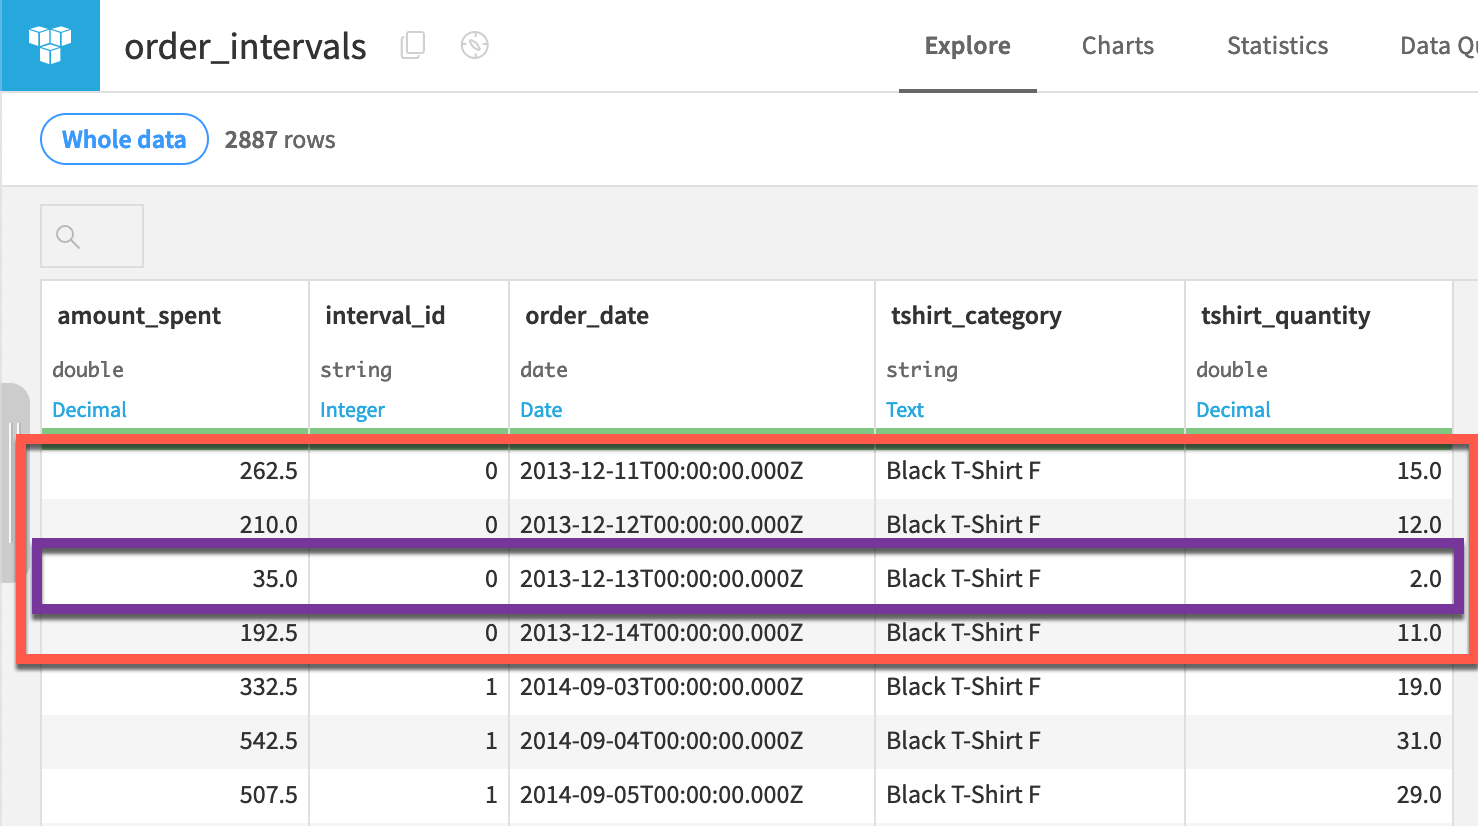
Let’s analyze the new rows occupying the first interval ID for the Black T-Shirt F category.
The values of amount_spent are within range for three of four days.
The value of amount_spent slips out of the threshold range for only one day (2012-12-13) — an acceptable deviation!
The difference between the first and final valid timestamps is three, which exceeds the required minimal segment duration.
Important
With a more flexible standard to qualify for an interval ID, the output dataset has more rows than its predecessor.
Retrieve rows outside an interval ID#
The Interval Extraction recipe returns only rows of the input dataset that are assigned an interval ID. In some cases though, we may want a dataset that retains all rows of the input dataset — only with the new interval_id column appended.
We can achieve this with a Join recipe.
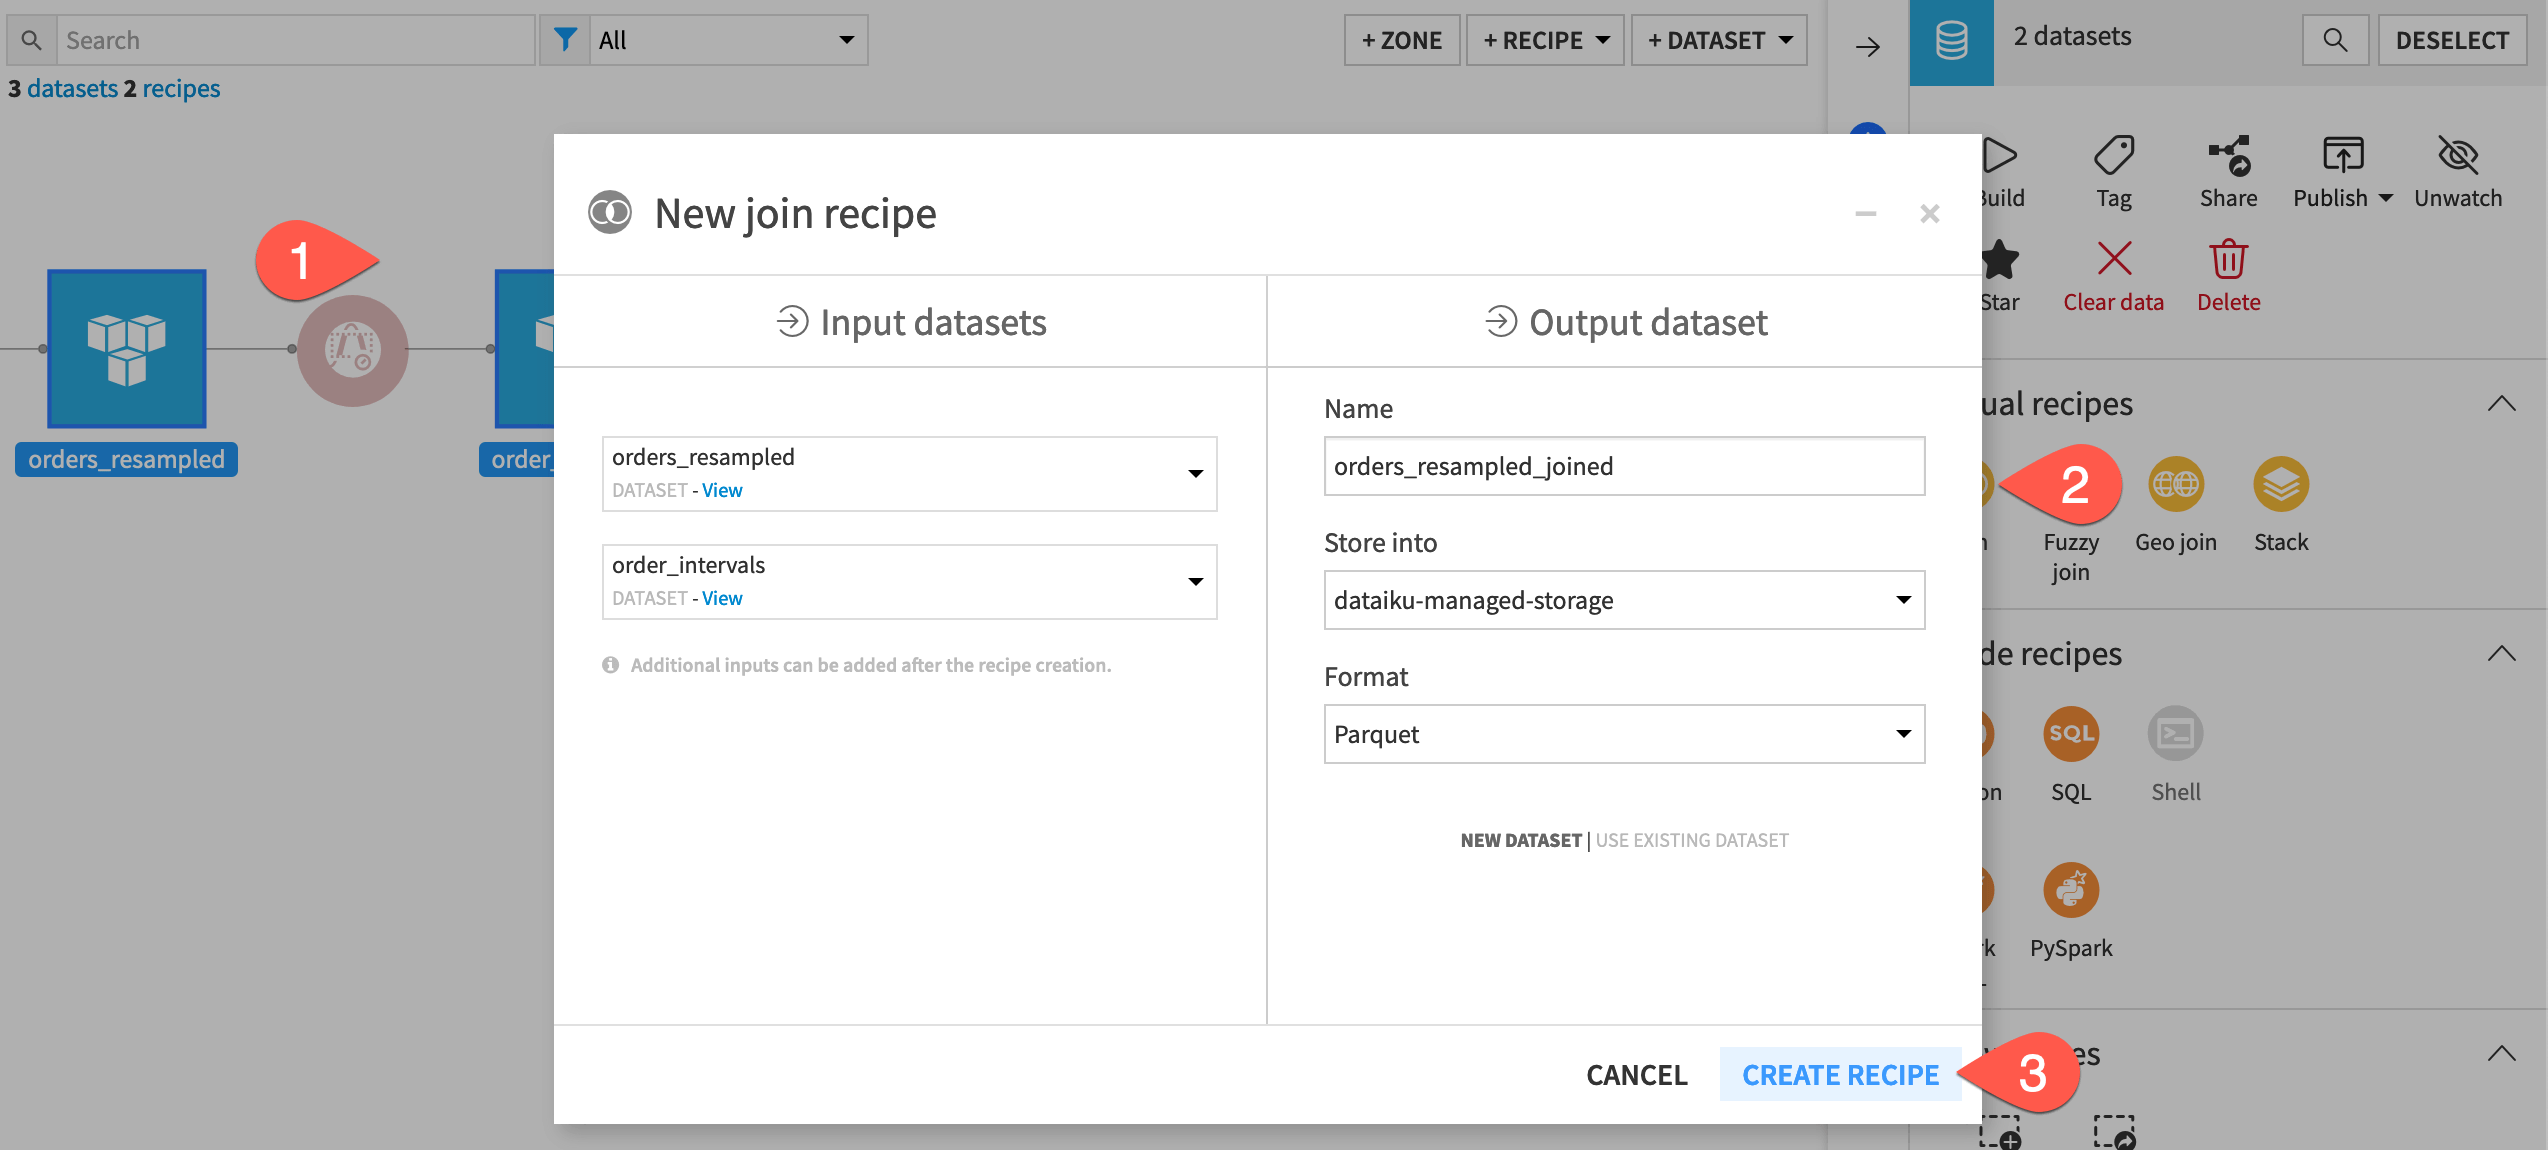
From the Flow, select the orders_resampled and then order_intervals datasets.
In the Actions tab, select Join from the menu of visual recipes.
Click Create Recipe.
Accepting the default left join, click Run at the bottom left of the recipe, and open the output dataset when finished.
Important
In the output, recognize that all rows of the original resampled dataset are retained. The data quality bar in the interval_id column header shows us that many values are empty. These are rows that didn’t qualify for an interval ID.
Create features with interval IDs#
We may often want to use the interval_id column to create new features for a predictive model.
For example, one of the simplest features we could build is one determining if a row belongs to an interval or not.
From the Actions (
) tab of the orders_resampled_joined dataset, select Prepare from the menu of visual recipes.
Click Create Recipe in the dialog.
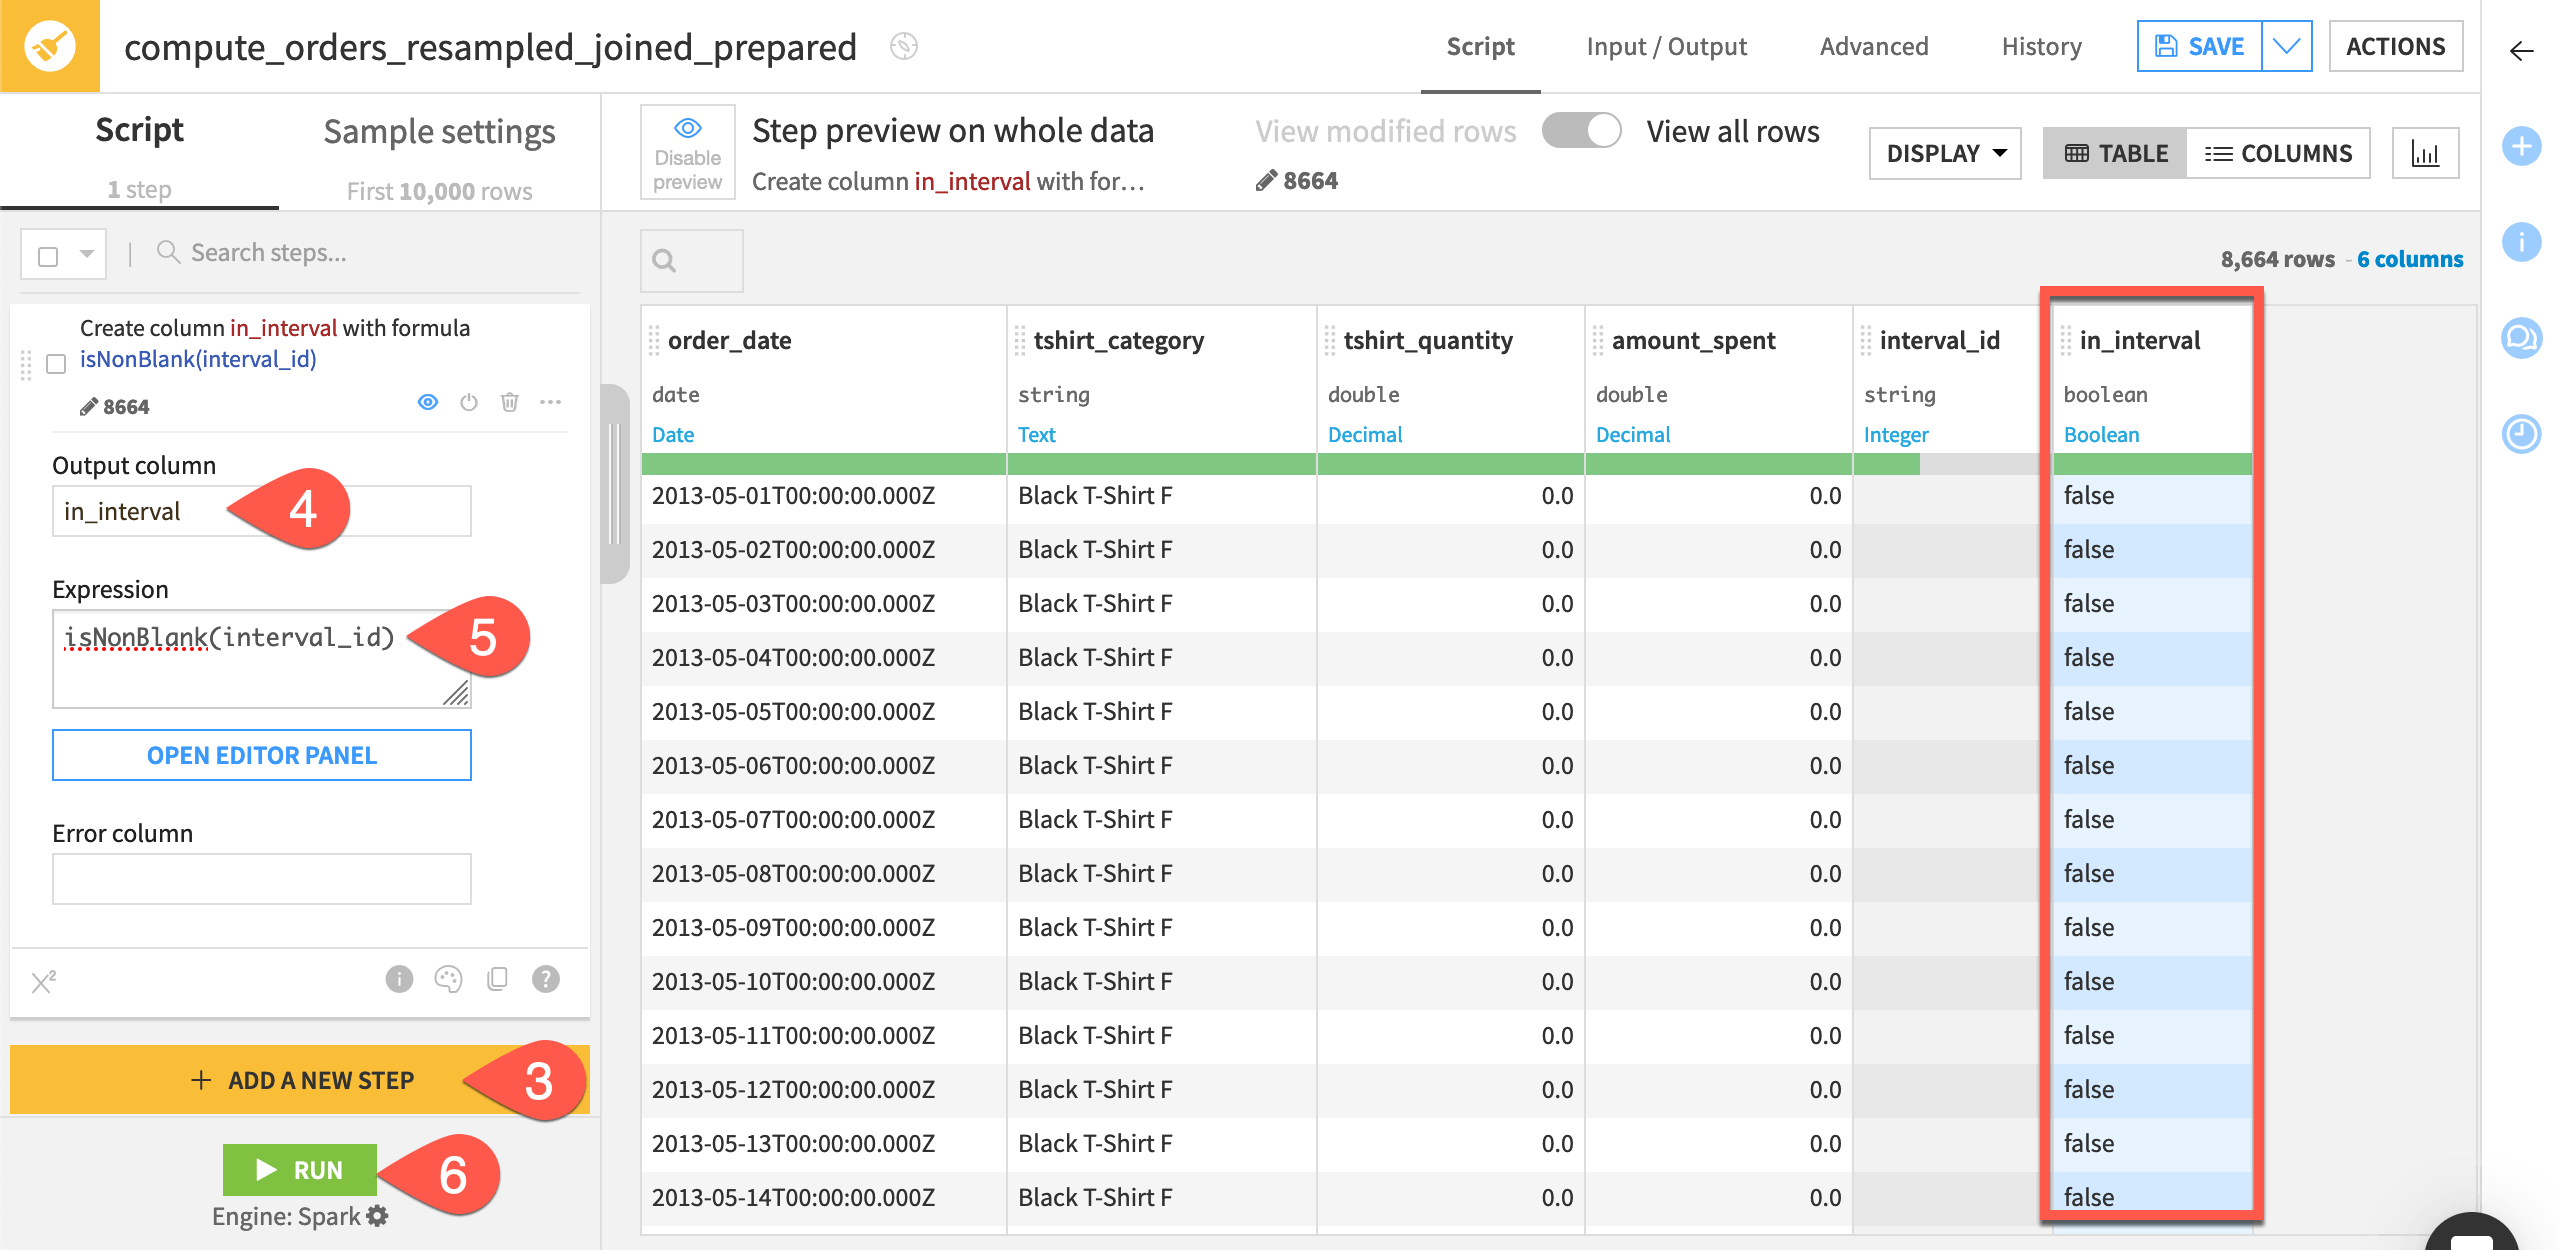
Near the bottom left, click + Add a New Step, and select Formula.
Enter
in_intervalas Formula for.Copy-paste
isNonBlank(interval_id)into the editor.Click Apply.
Click Run, and open the output dataset when finished.
Note
For details on Formula functions like isNonBlank(), see the reference documentation.
Compute window aggregations over time series data#
In a noisy time series, observing the variation between successive timestamps may not always provide insightful information. In such cases, it can be useful to compute aggregations over a rolling window of timestamps.
Let’s build a wide variety of possible window aggregations using the time series Windowing recipe.
Note
See Concept | Time series windowing for a detailed walkthrough if unfamiliar with the recipe.
Aggregate over a causal window#
Let’s start with a causal, rectangular window frame — the kind that can be built using the native visual Window recipe.
Create a Windowing recipe#
First, define the recipe’s input and outputs.
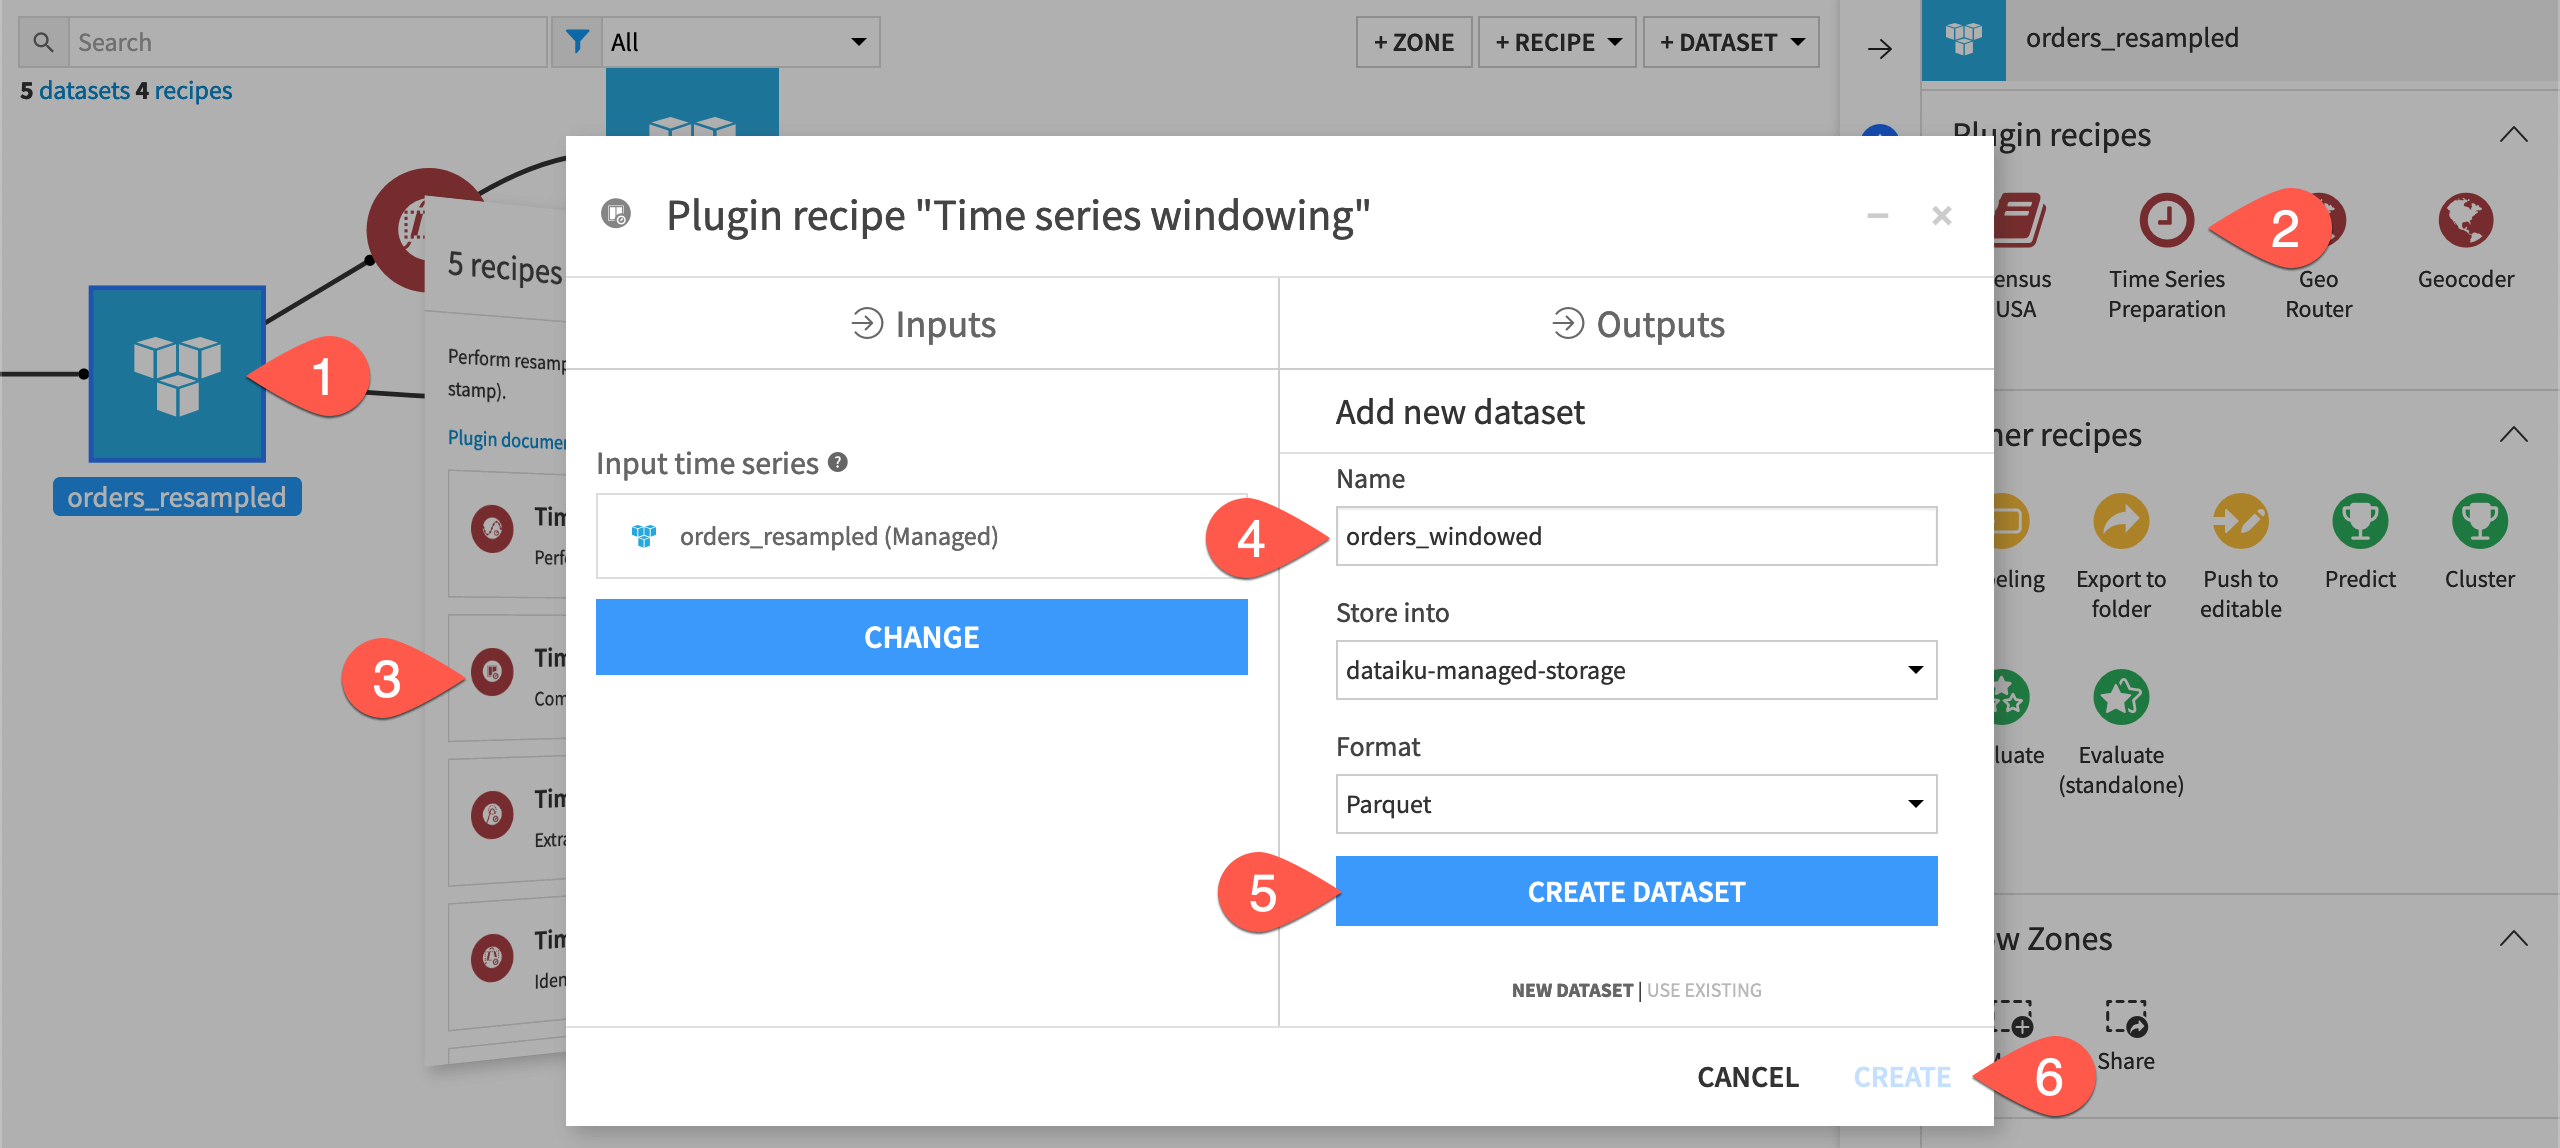
From the Flow, select the orders_resampled dataset.
In the Actions tab of the right panel, select Time Series Preparation from the menu of plugin recipes.
Select the Time series windowing recipe from the dialog.
In the new dialog, click Set, and name the output dataset
orders_windowed.Click Create Dataset to create the output.
Click Create to generate the recipe.
Configure a Windowing recipe#
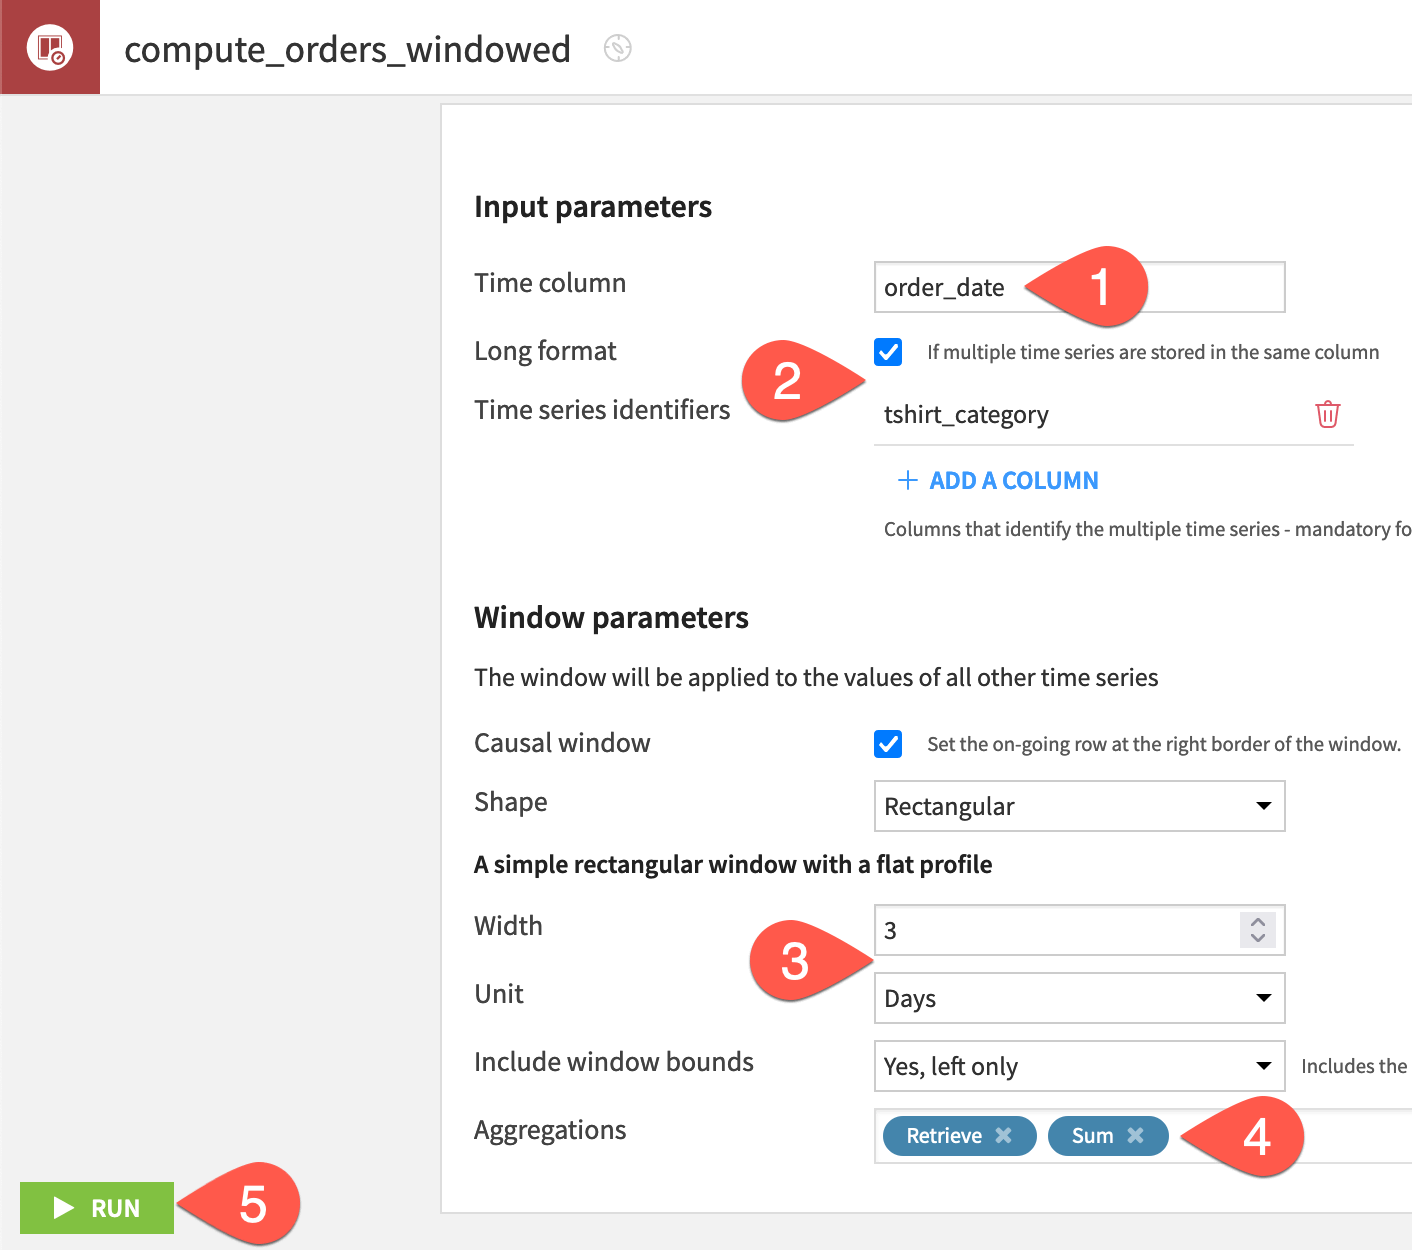
Let’s start with an example with easy-to-verify results: a cumulative sum over the previous three days (excluding the present day from the window).
In the recipe’s settings, for the time column, select order_date.
Check the box to indicate the data is in Long format, and provide tshirt_category as the identifier column.
Set the size of a default causal, rectangular window frame to a width of
3and a unit of Days.For aggregations, choose Retrieve to return the time series values for each day and Sum to compute the rolling sum.
At the bottom left, click Run, and then open the output dataset when finished.
Inspect the causal window output#
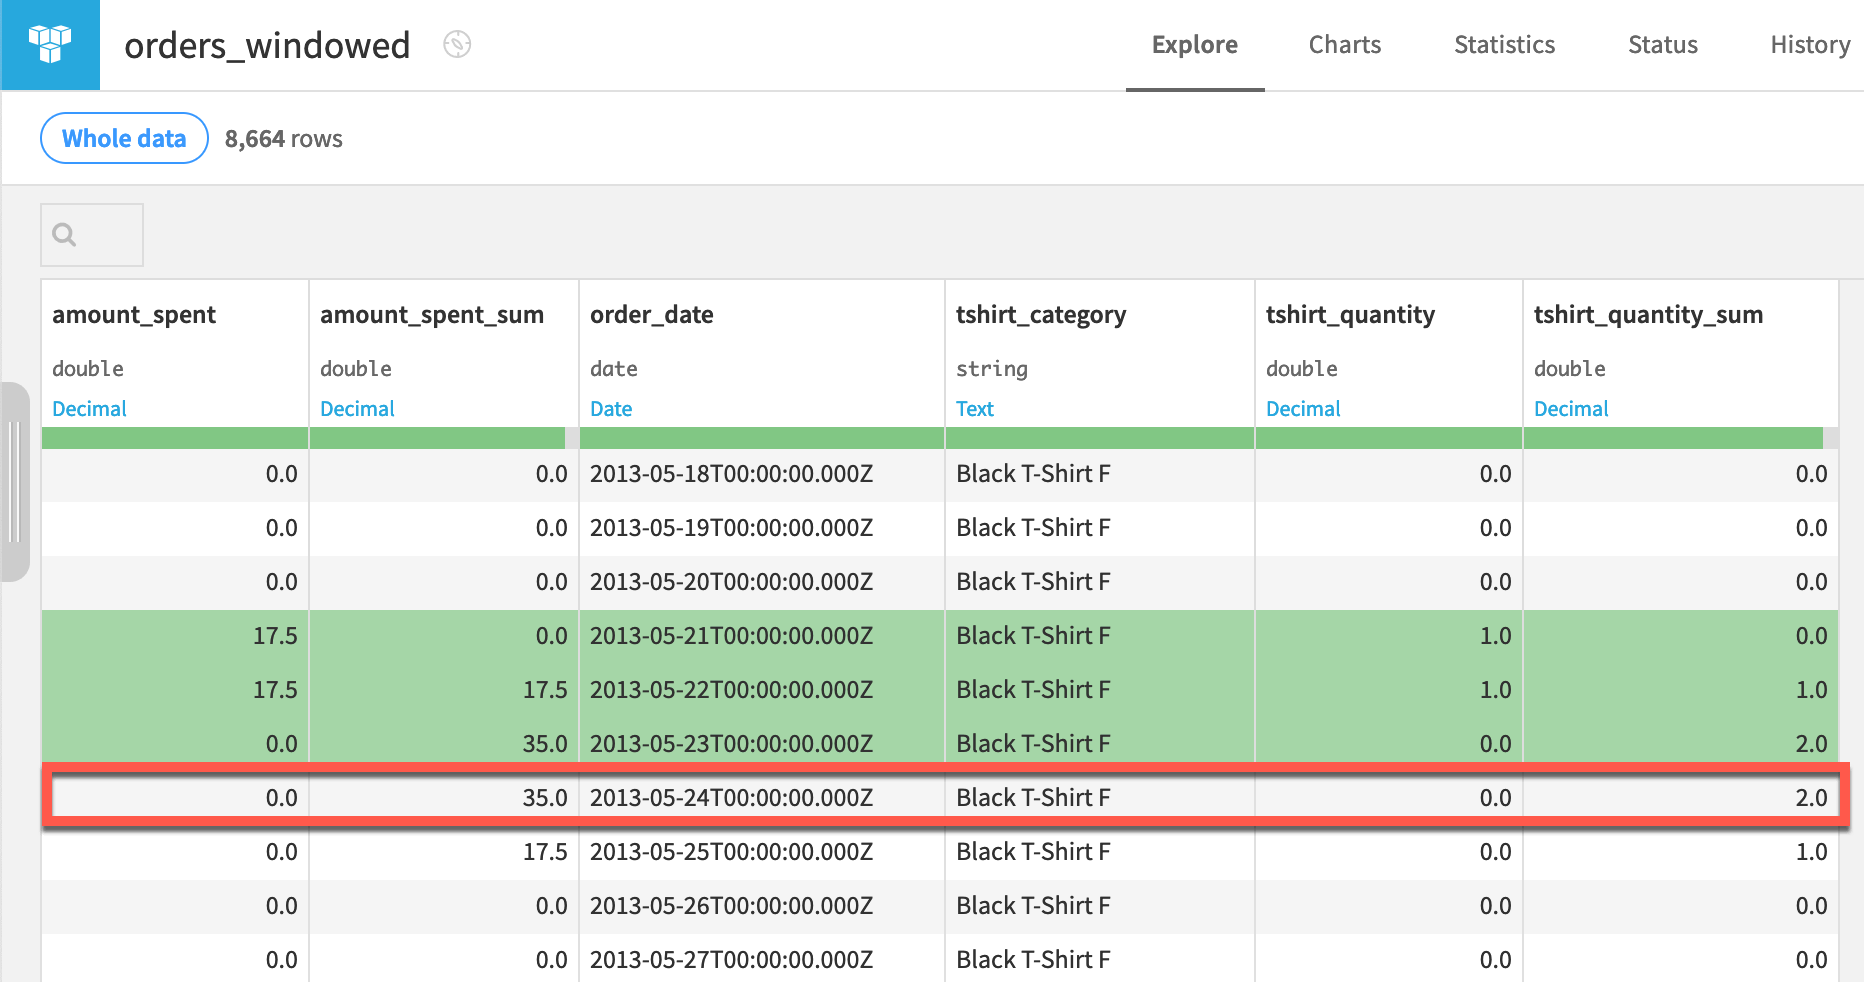
As one example, look at the row for the Black T-Shirt F category on 2013-05-24.
The window frame for this row (highlighted in green) includes the three previous days (21, 22, and 23).
Those three days had a cumulative sum of 2 orders, and so the value of tshirt_quantity_sum is 2.
The window frame aggregations are applied to all numeric columns, and so amount_spent_sum has a value of 35.
Tip
On your own, adjust the window parameters one at a time and verify the result is what you expect. For example, increase the width of the window frame. Include or exclude the bounds. You might also verify that you can achieve the same results for this type of window with the visual Window recipe!
Aggregate over a non-causal window#
Now let’s switch to a non-causal or bilateral window, where the current row will be the midpoint of the window frame instead of the right border.
Configure a non-causal window#
There is only one parameter in the recipe settings we need to change.
From the orders_windowed dataset, click Parent Recipe near the top right.
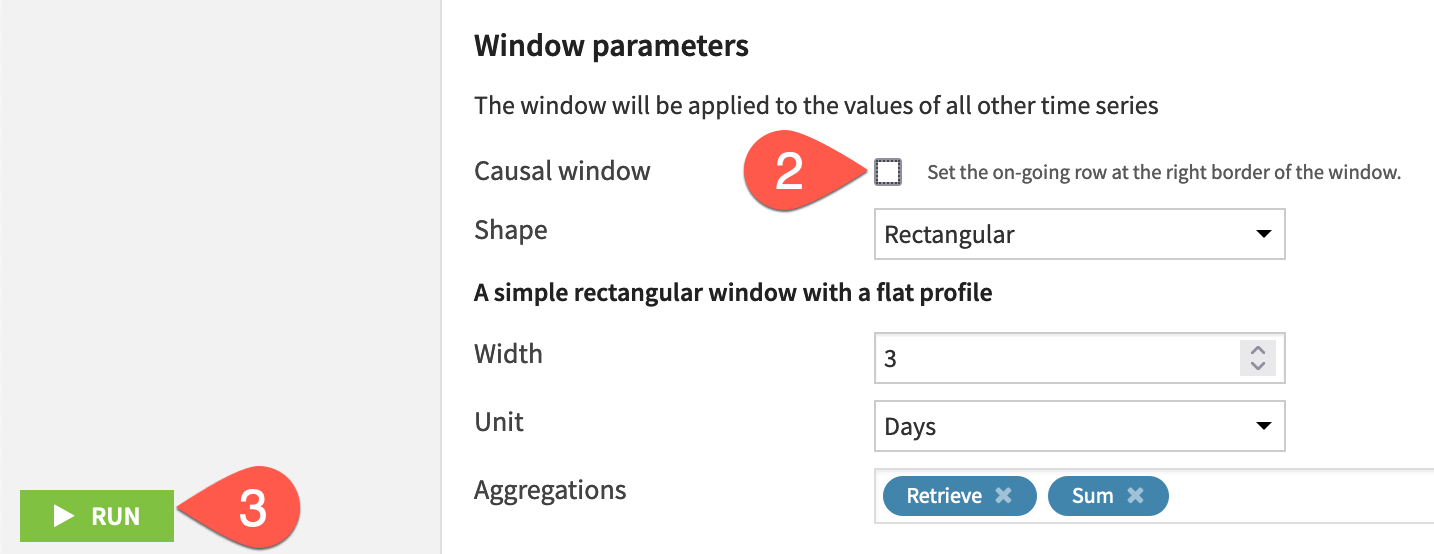
Uncheck the causal window box to define a non-causal window.
Click Run, and open the output dataset when finished.
Inspect the non-causal window output#
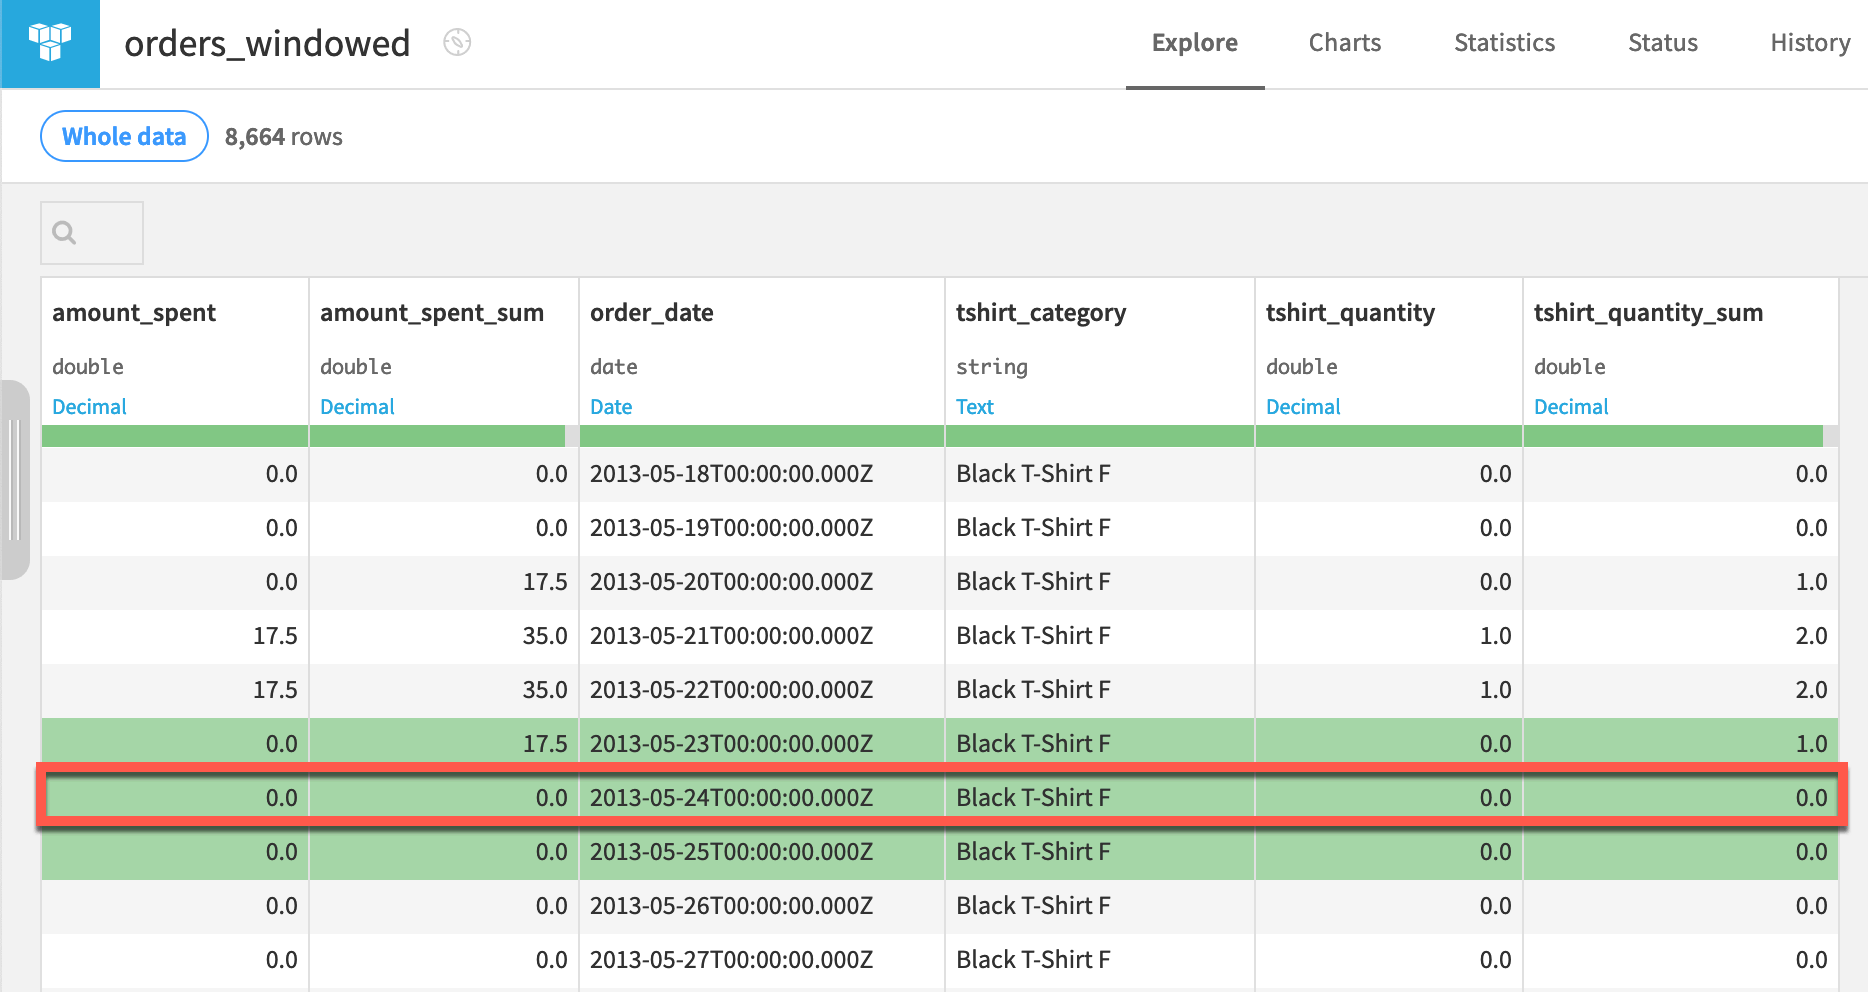
As a means of comparison, let’s return to the Black T-Shirt F category on 2013-05-24.
The window frame still includes three days, but the midpoint is the current row. Accordingly, 0 t-shirts were bought during this period.
Tip
Verify for yourself what values are included in a non-causal window frame of even width.
Aggregate time units in a window frame#
Even though our data is recorded at a daily interval, the recipe allows us to specify other units.
Change the units of a window frame#
Instead of days, let’s switch to weeks.
From the orders_windowed dataset, click Parent Recipe near the top right.
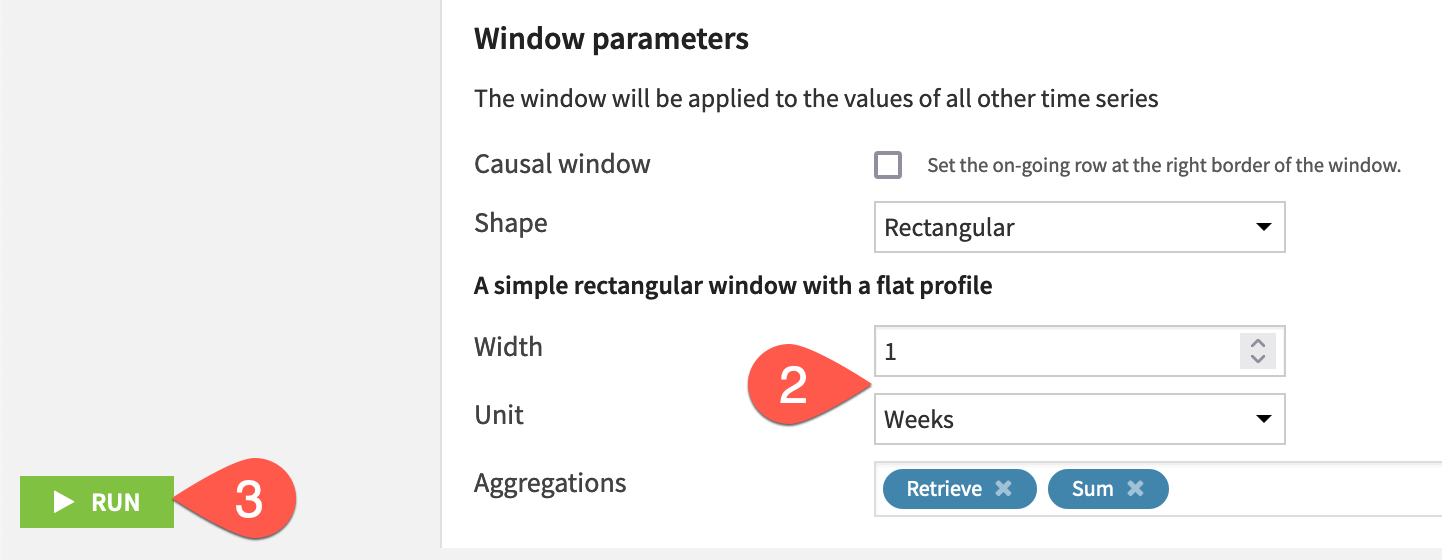
Change the window size to a width of
1and a unit of Weeks.Click Run, and open the output dataset when finished.
Inspect the weekly aggregated output#
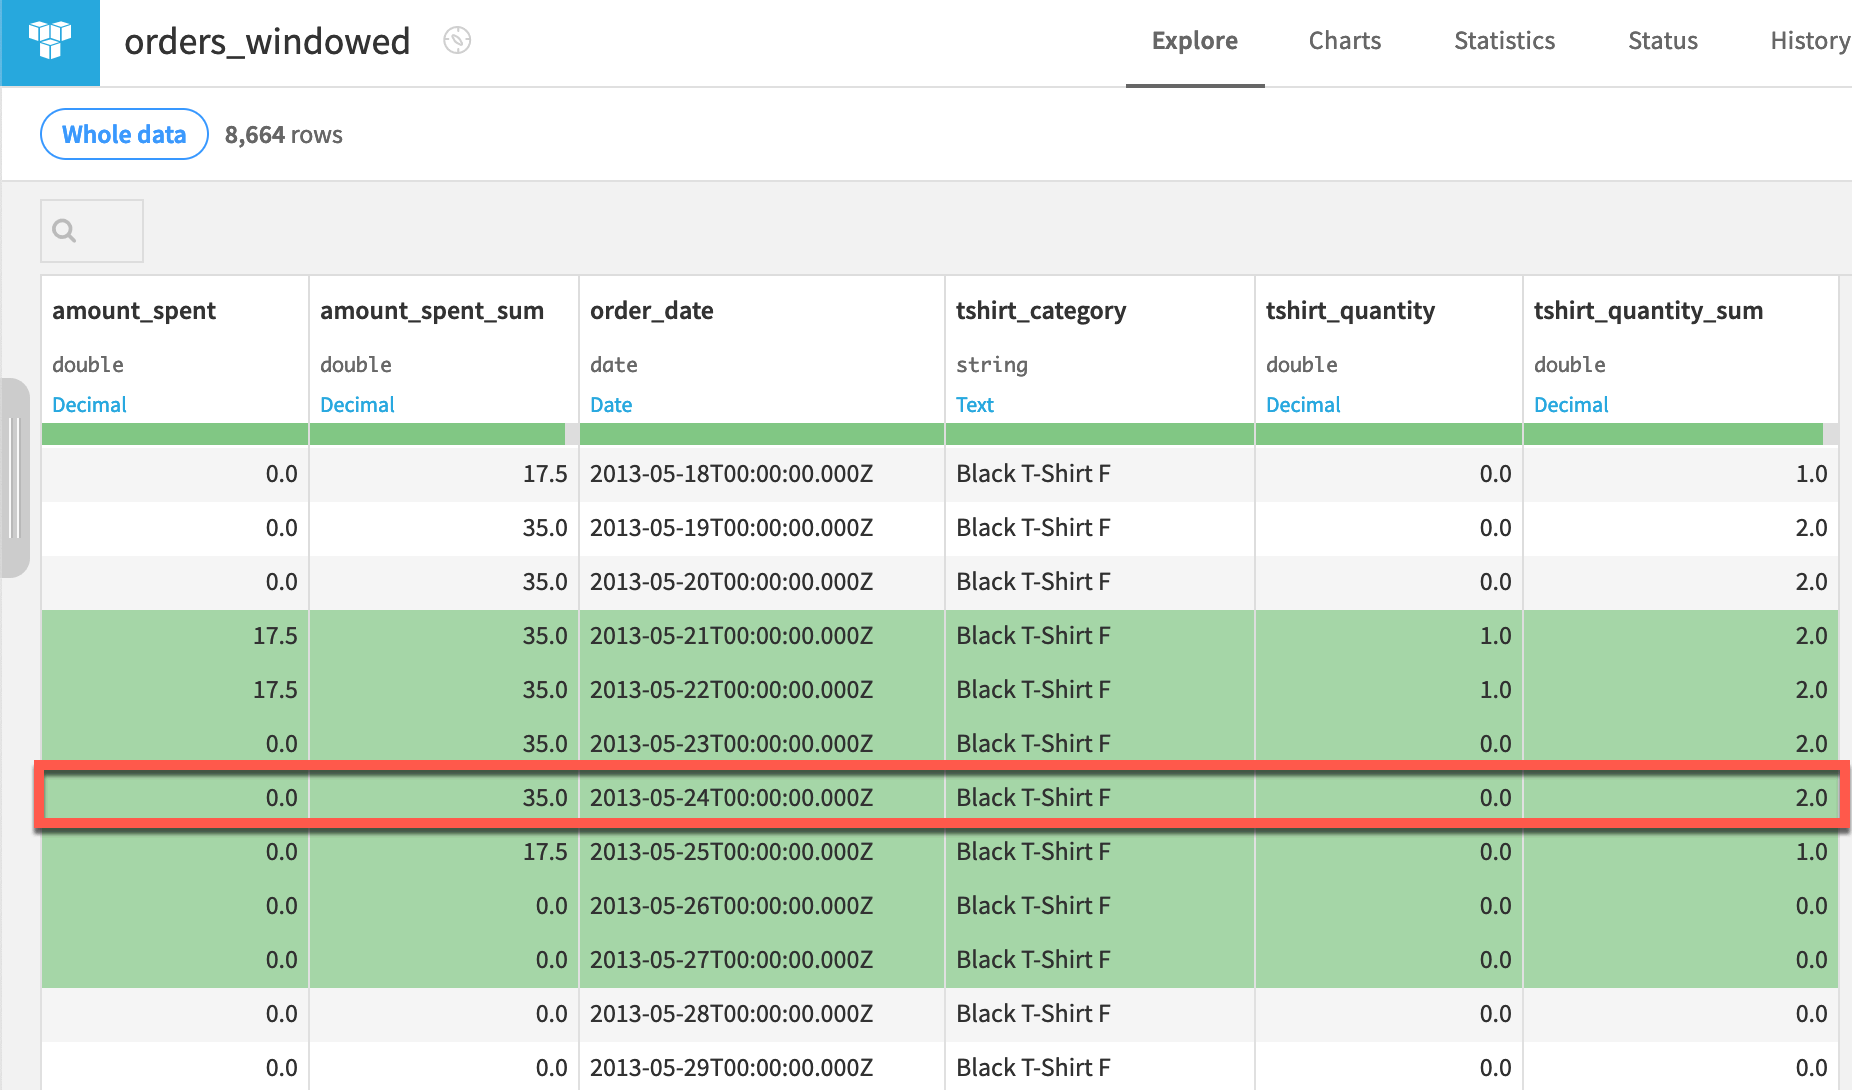
Once again, return to the Black T-Shirt F category on 2013-05-24.
A one week bilateral window frame includes three days before the current row, the current row, and three days after the current row.
Tip
Create a plot on the aggregation columns to verify the smoothing effect on the data.
Aggregate over a triangle window frame#
All window frames we’ve built thus far have been rectangular in shape. Now let’s try a triangle.
Change the window shape#
In the recipe’s settings, we need to change the shape and size.
From the orders_windowed dataset, click Parent Recipe near the top right.
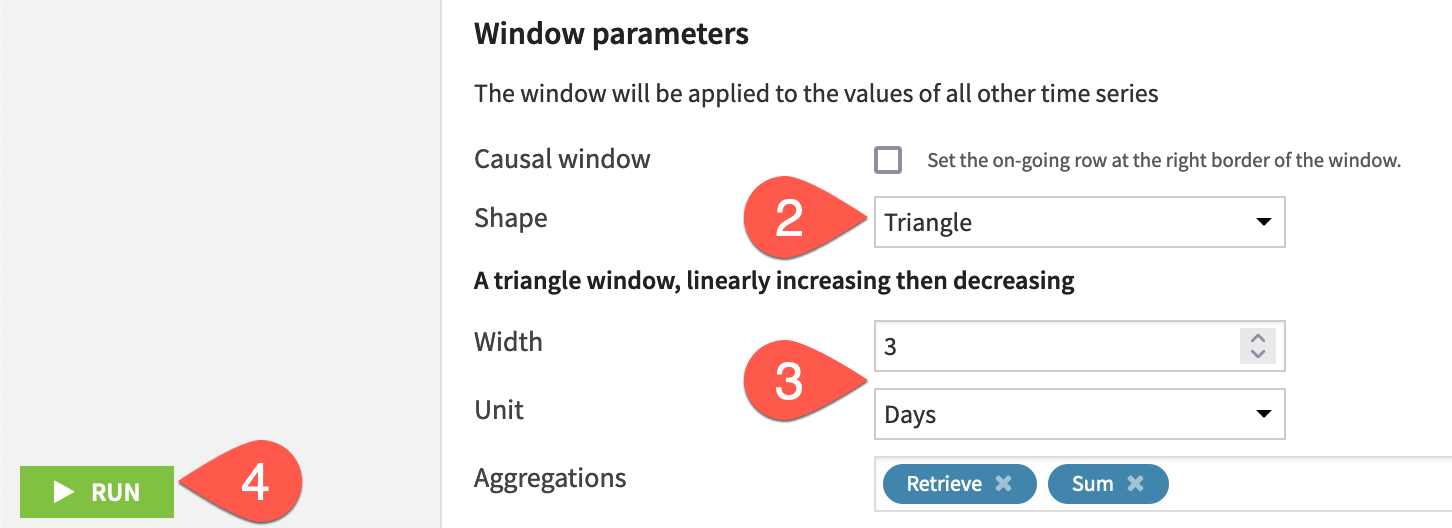
Change the window shape parameter to a Triangle.
Change the window size to a width of
3and a unit of Days.Click Run, and open the output dataset when finished.
Important
The only difference between this example and the first non-causal (bilateral) window example is the shape parameter.
Inspect the triangle window output#
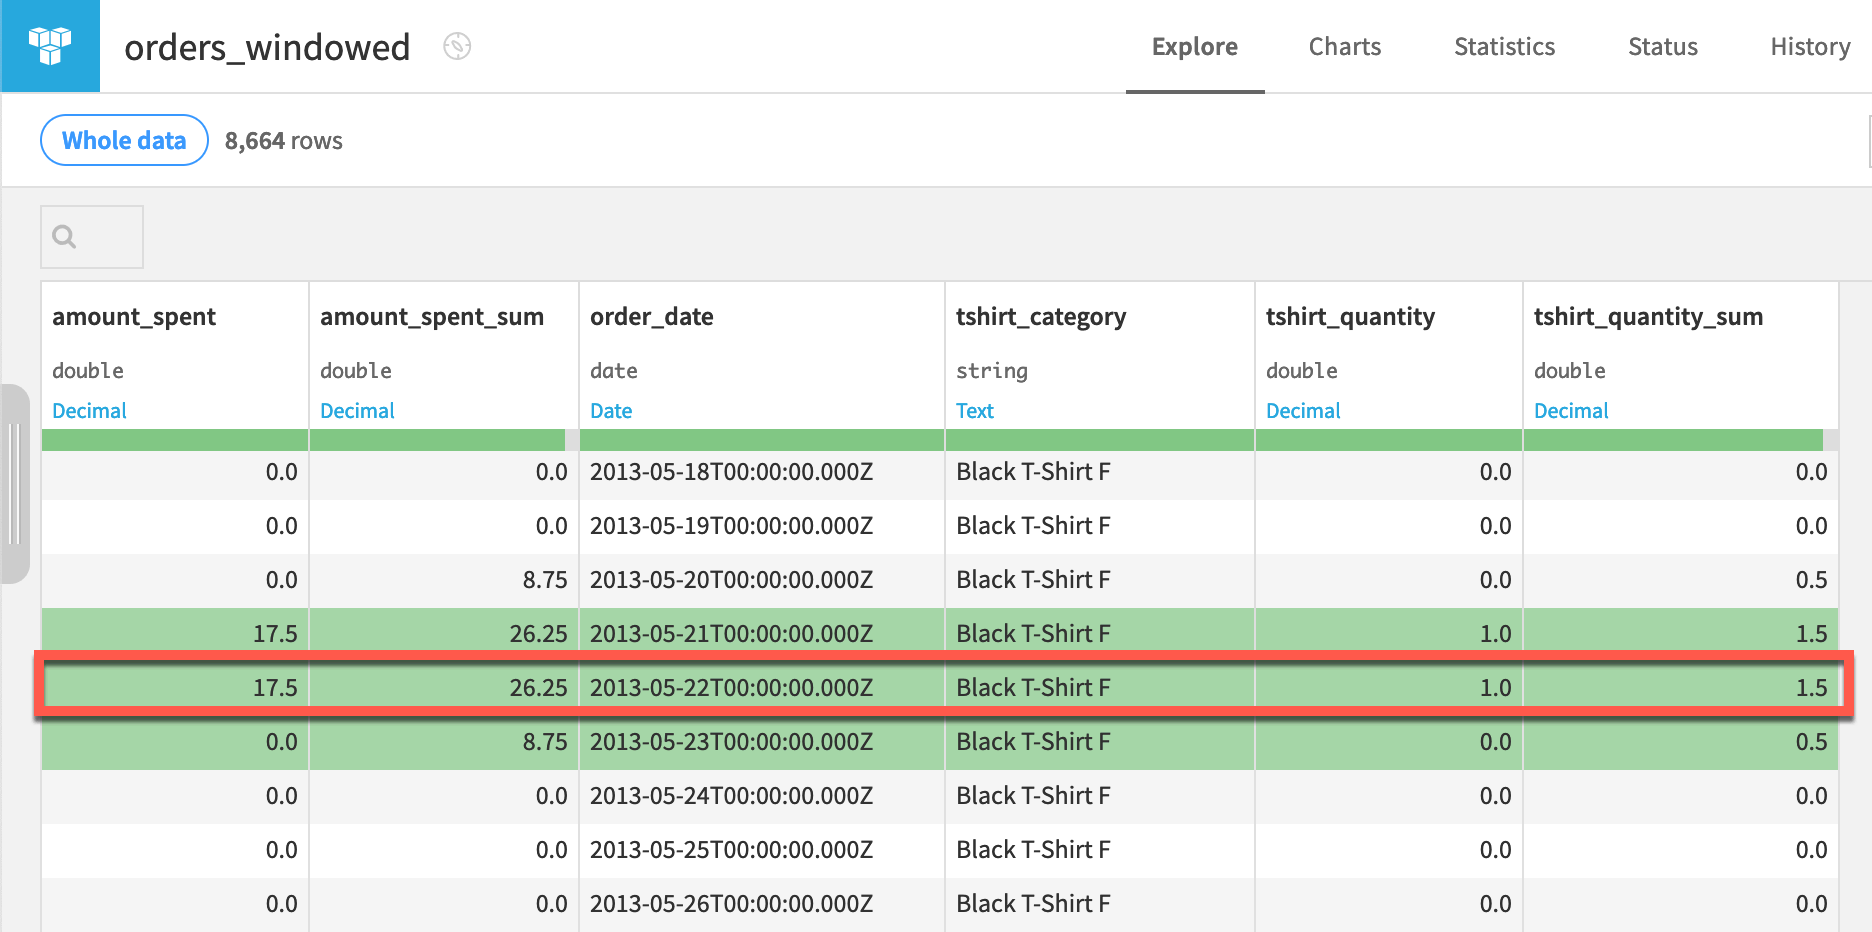
This time, let’s draw our attention to the Black T-Shirt F category on 2013-05-22.
A non-causal window of three days spans from one day before to one day after any given row.
The triangular window assigns a weight of 0.5 to the day before and after the current row, resulting in a tshirt_quantity_sum of \((1 * 0.5) + (1 * 1) + (0 * 0.5) = 1.5\).
Tip
On your own, observe changes in the output when using non-linear window shapes.
Extract extrema from time series data#
The Extrema extraction recipe can create the same variety of causal and non-causal window frames, but then, in addition, compute aggregations around global extrema for all dimensions in a time series.
Note
See Concept | Time series extrema extraction for a detailed walkthrough if unfamiliar with the recipe.
Compute aggregates around the global maximum#
Let’s find the global maximum amount spent for each time series, and then compute the average spent in a 7-day non-causal (bilateral) window around each global maximum value.
Create an Extrema Extraction recipe#
First, define the recipe’s input and output dataset.
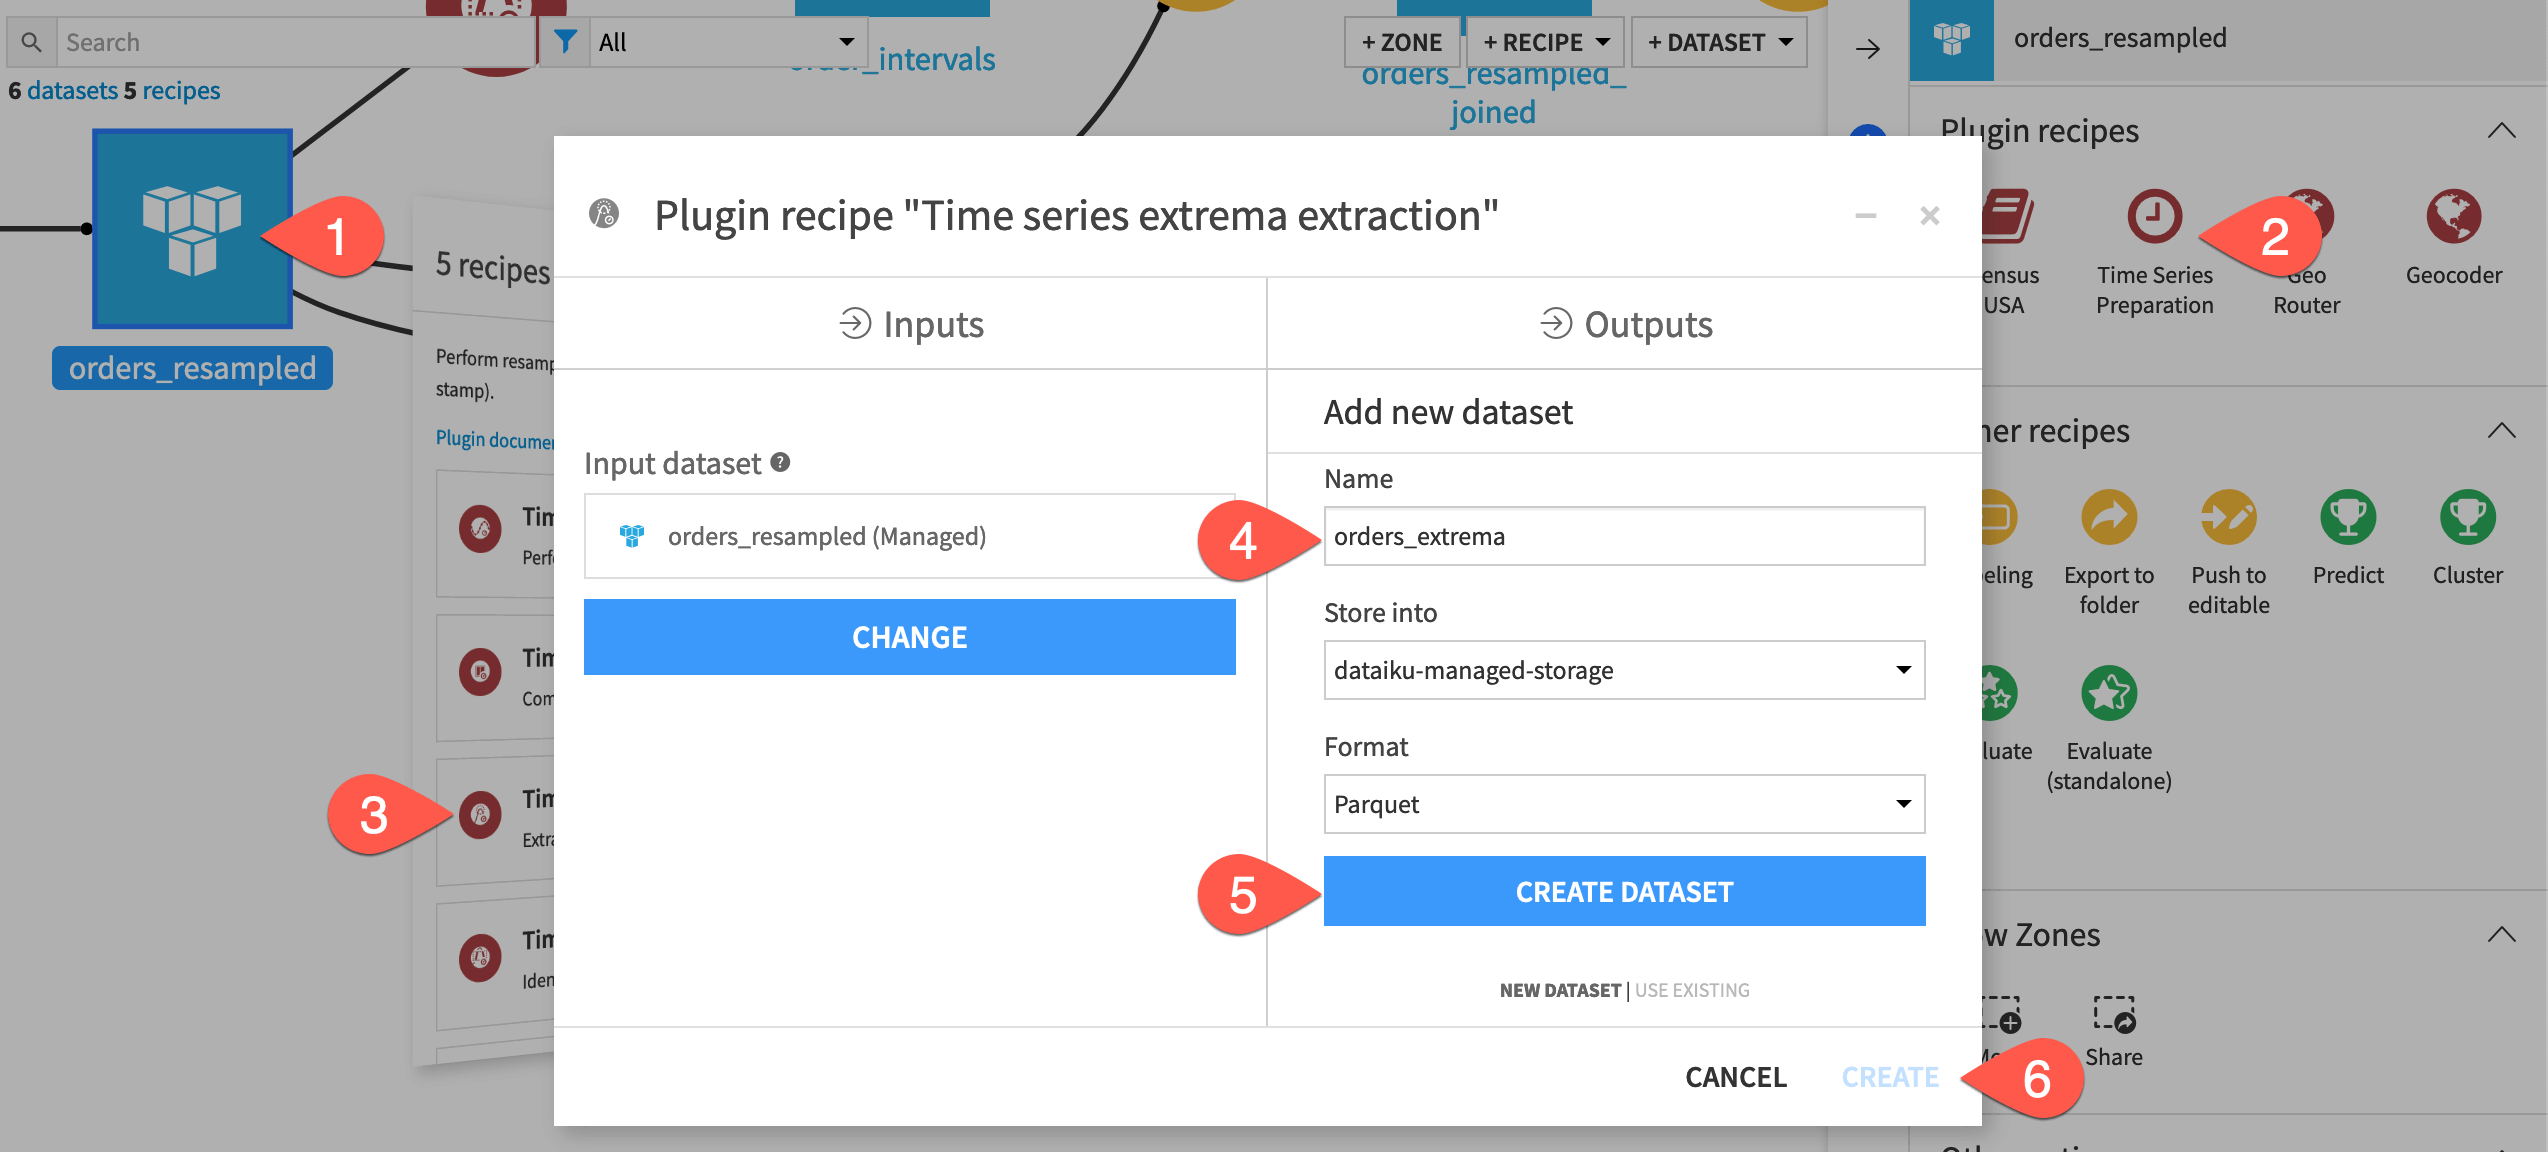
From the Flow, select the orders_resampled dataset.
In the Actions tab of the right panel, select Time Series Preparation from the menu of plugin recipes.
Select the Time series extrema extraction recipe from the dialog.
In the new dialog, click Set, and name the output dataset
orders_extrema.Click Create Dataset to create the output.
Click Create to generate the recipe.
Configure an Extrema Extraction recipe#
Then set the recipe’s parameters as follows:
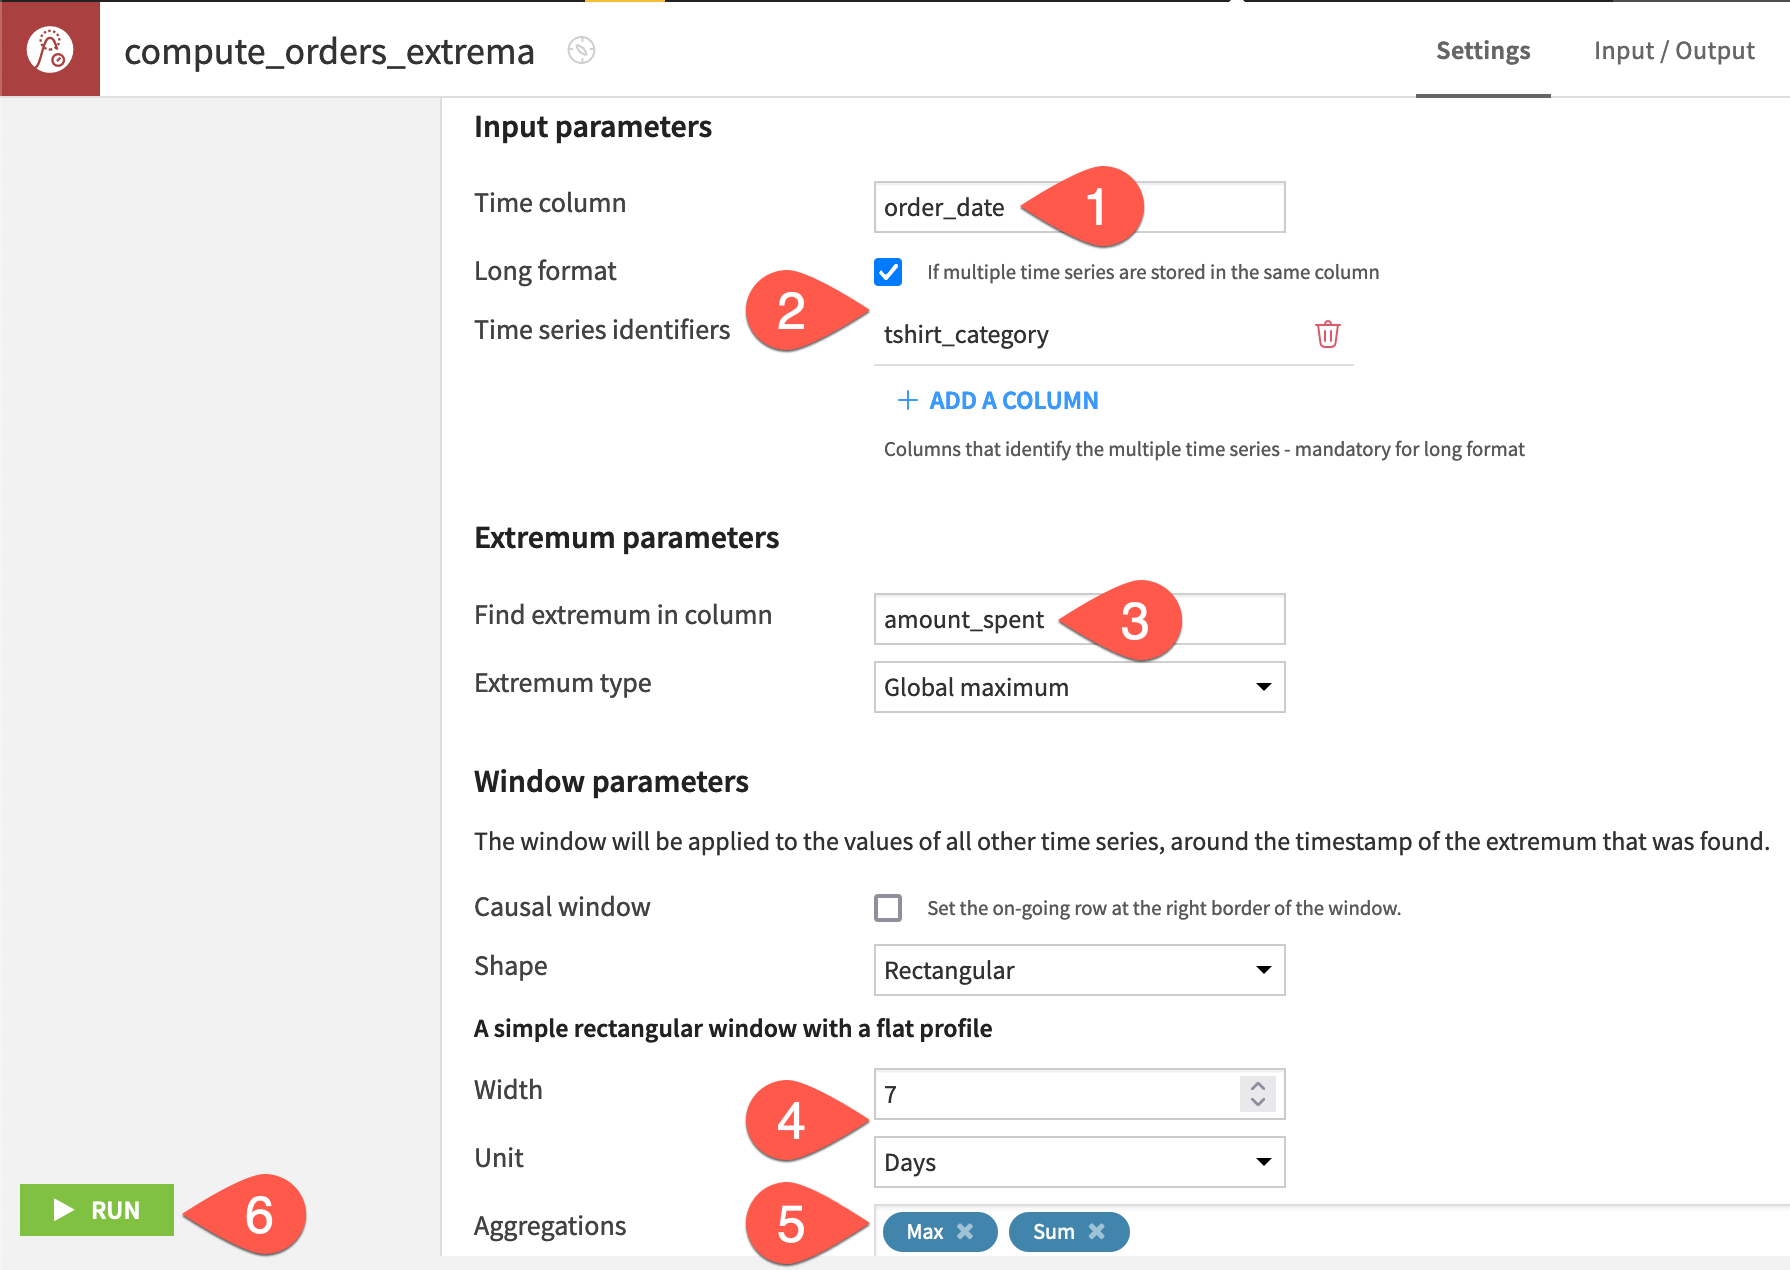
As before, in the recipe’s settings, for the time column, select order_date.
Check the box to indicate the data is in Long format, and provide tshirt_category as the identifier column.
Find the extremum in the column amount_spent, keeping the default of global maximum as the extremum type.
For a default non-causal rectangular window, set the width to
7and units to Days.For the easiest verification of results, set the aggregations to Max and Sum.
At the bottom left, click Run, and then open the output dataset when finished.
Inspect the extracted extrema output#
Confirm for yourself the following facts about the output:
The output has four new columns because it started with two dimensions (amount_spent and tshirt_quantity), and we requested two aggregations.
The amount_spent_max column is the same as the amount_spent column because we built the window frame around the global maximum of the amount_spent column for each independent time series.
The output consists of only one row for each time series in the orders_resampled dataset. The only exception is for ties among the selected global extremum (as there is for the White T-Shirt M series).

Verify aggregates with a Join#
Since the Extrema Extraction recipe extracts the extrema, the output dataset no longer includes the values that were included in the window frame. We could reveal these values by joining the orders_extrema dataset back into the resampled data.
Join extracted extrema with the time series#
Just like with the verification of the Interval Extraction recipe, a simple left join meets our need.
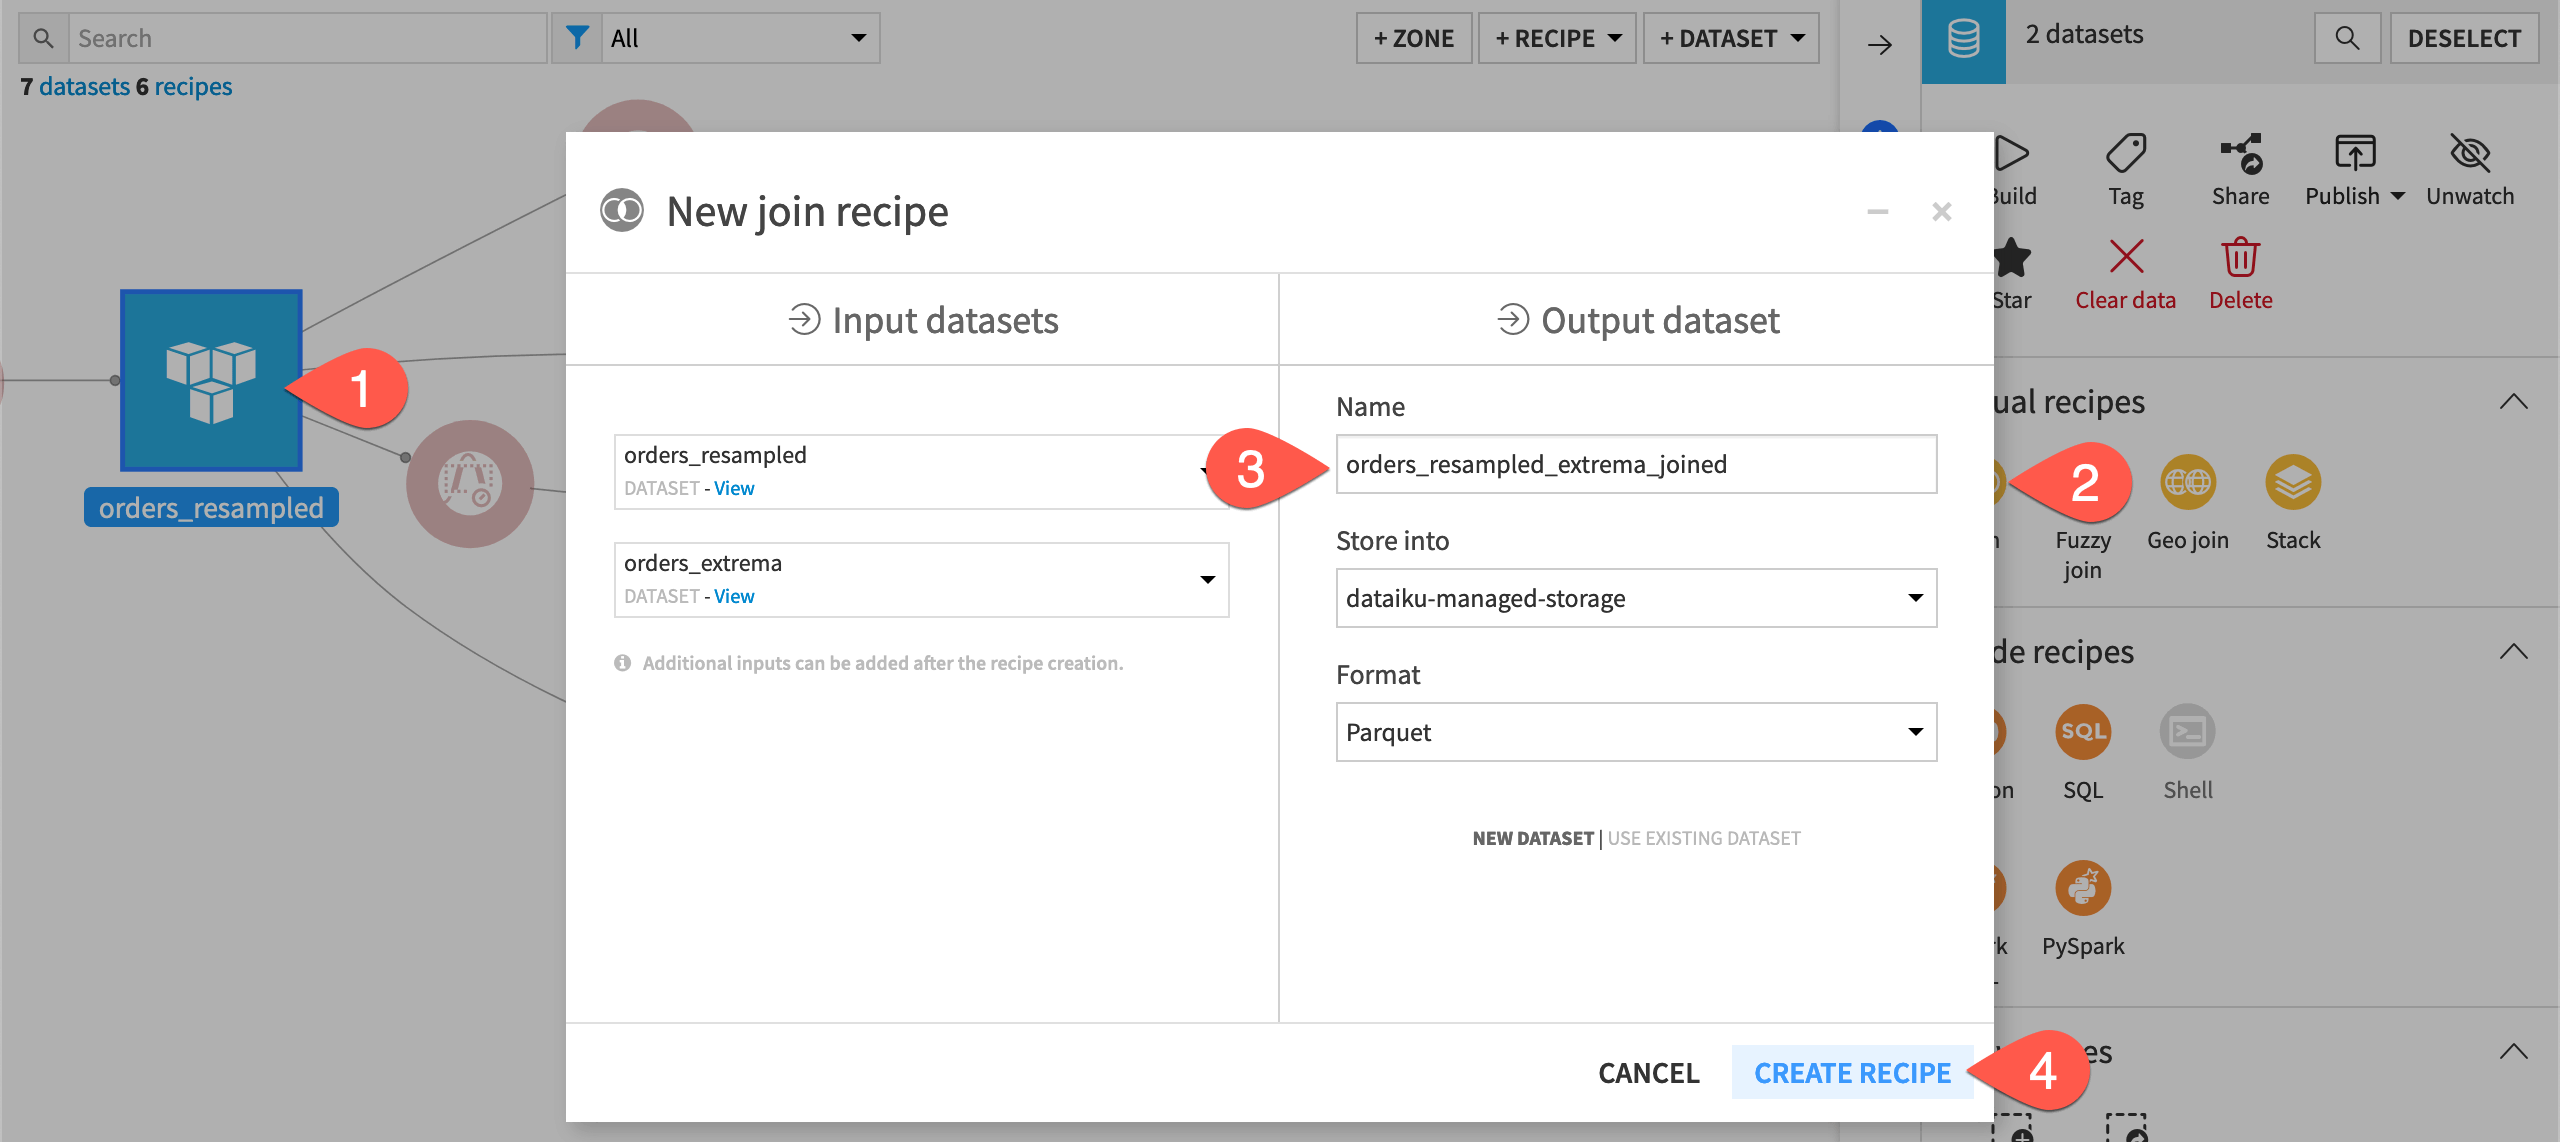
From the Flow, select the orders_resampled and then orders_extrema datasets.
In the Actions tab, select Join from the menu of visual recipes.
Name the output
orders_resampled_extrema_joined.Click Create Recipe.
Accepting the default left join, click Run at the bottom left of the recipe, and open the output dataset when finished.
Inspect the extrema-joined output#
We just need to find the correct part of the time series to validate our results.
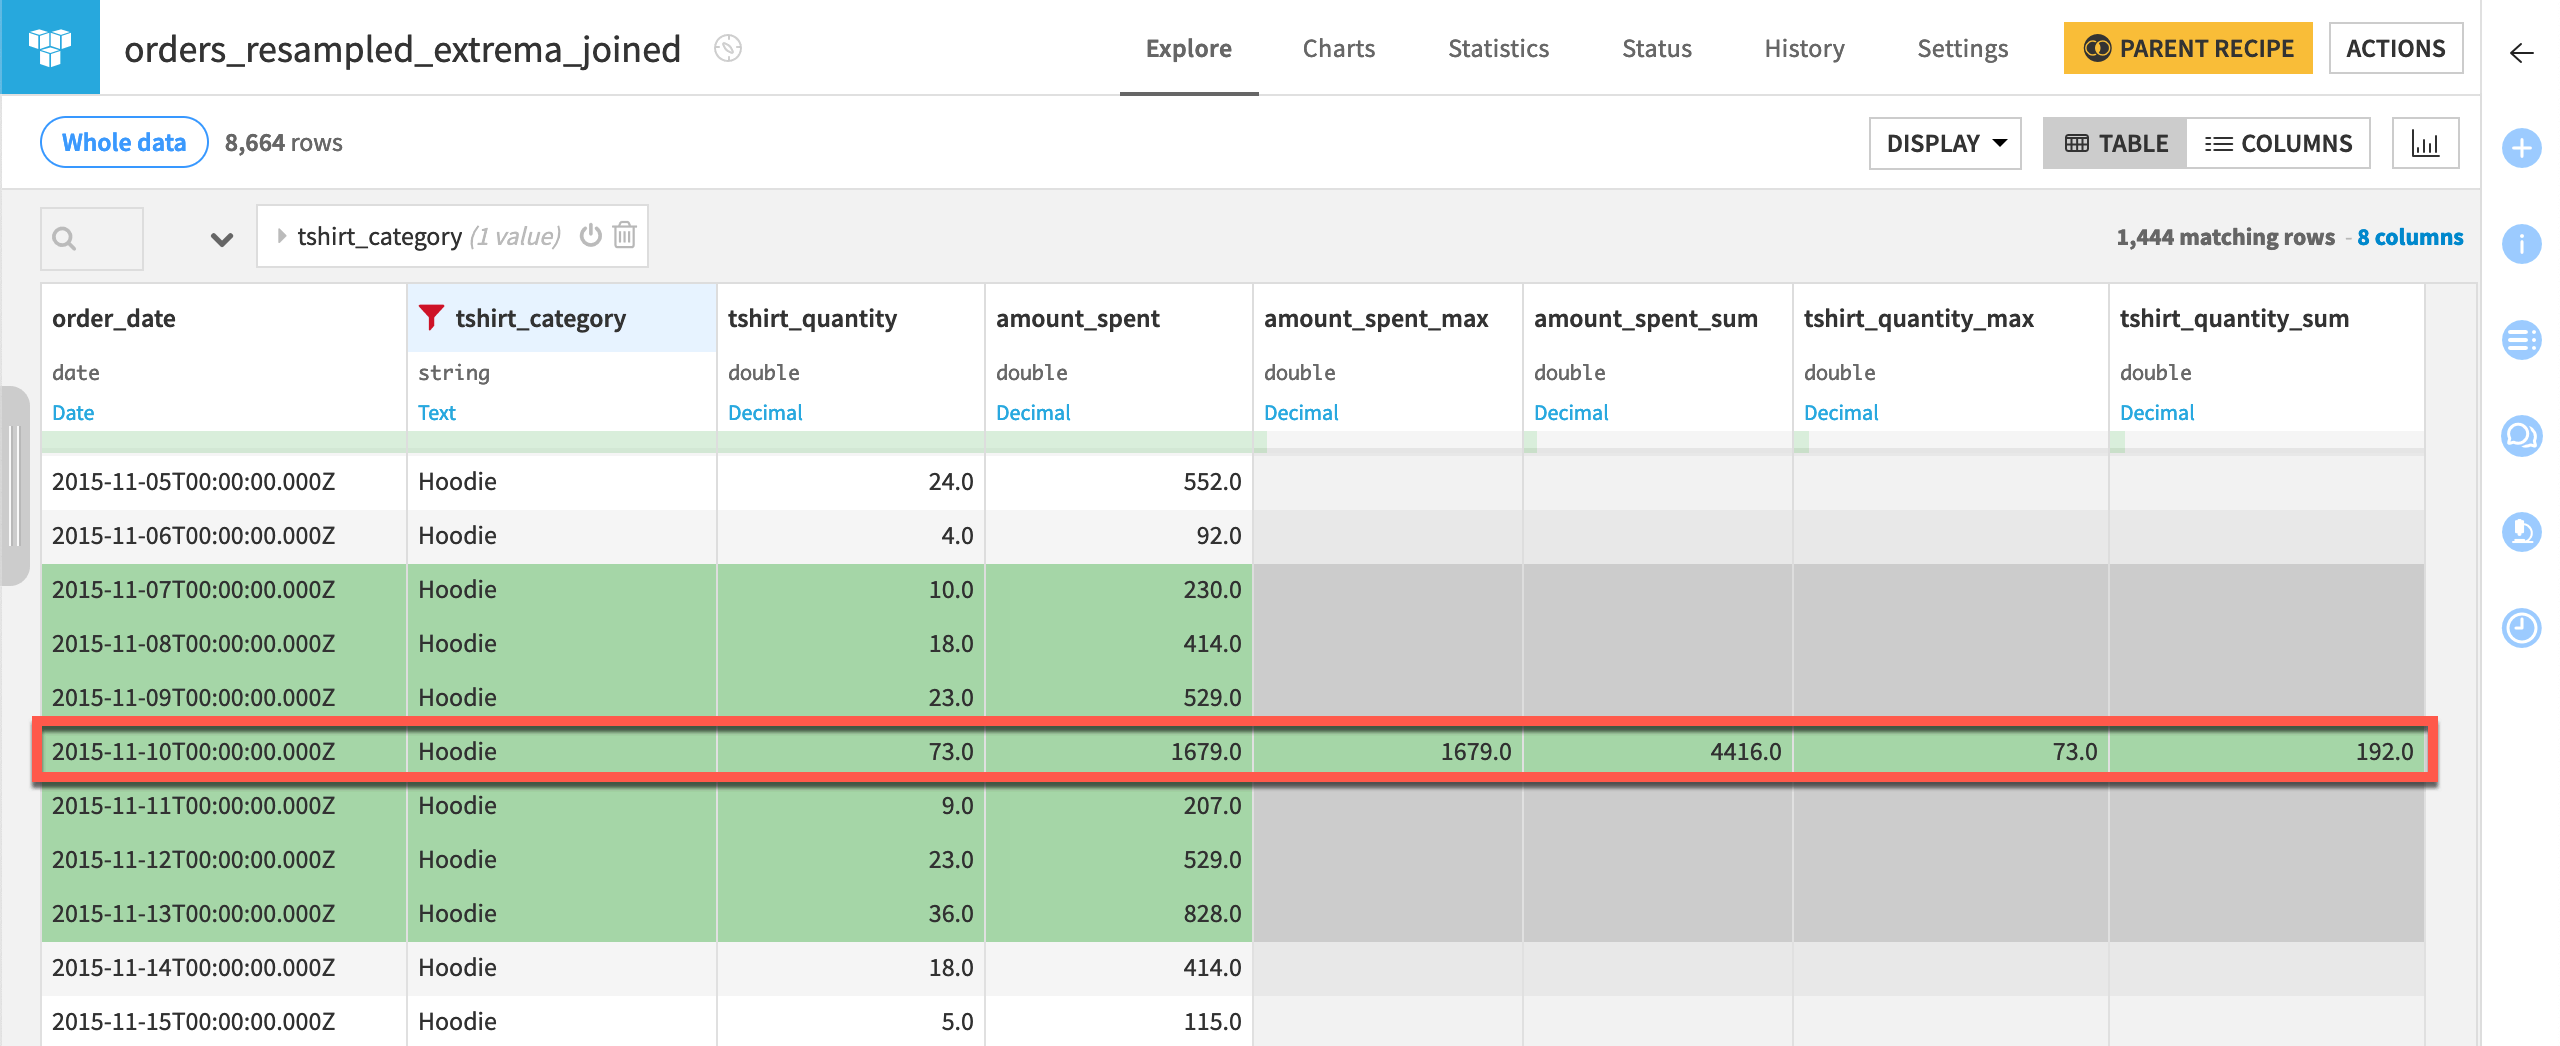
Filter any one of the aggregation columns, such as amount_spent_max, for OK values.
Filter for a tshirt_category, such as Hoodie.
Make note of the order_date (in this case, 2015-11-10).
Remove the filter for OK values, and scroll to the order_date found above.
Verify that the sum spanning three days before and after the present day equals the respective *_sum column. To take tshirt_quantity for example, \(10 + 18 + 23 + 73 + 9 + 23 + 36\) equals 192.
Tip
Can you anticipate what would happen if you were to extract the global minimum instead of the global maximum? Since many rows share the global minimum of 0 orders, the output would include many tie rows!
Decompose time series data#
The Trend/seasonal decomposition recipe can split a time series into its underlying components using either an additive or multiplicative model.
The values that result from time series decomposition represent:
The trend of the data at a timestamp. This can be useful especially if trends change over time.
The seasonality of the data at a timestamp. More specifically, the seasonal component demonstrates how the observed value deviates from the underlying trend due to recurring seasonal patterns.
The residual of the data at a timestamp. The residual component represents the random or unexplained variation in the time series after accounting for the trend and seasonal patterns. Large residual values can highlight unexpected behavior and indicate that there might be additional external factors that influence the time series or more autoregressive components should be included into the model. You should check your data for partial autocorrelation to verify.
This is useful for:
Isolating the trend and seasonality components.
Designing time series forecasting models that account for trend and seasonality.
Detecting anomalies or outliers in the data.
Removing trend and seasonal variations to help make the time series stationary, which is an important assumption of statistical time series models such as ARIMA.
Note
See Time series components for a detailed walkthrough if unfamiliar with time series decomposition.
Split a time series into its components#
Let’s assume t-shirt sales follow an annual season. With this assumption, we’ll decompose the resampled orders data into its underlying components to understand it better.
Create a Decomposition recipe#
First, define the recipe’s input and output dataset.
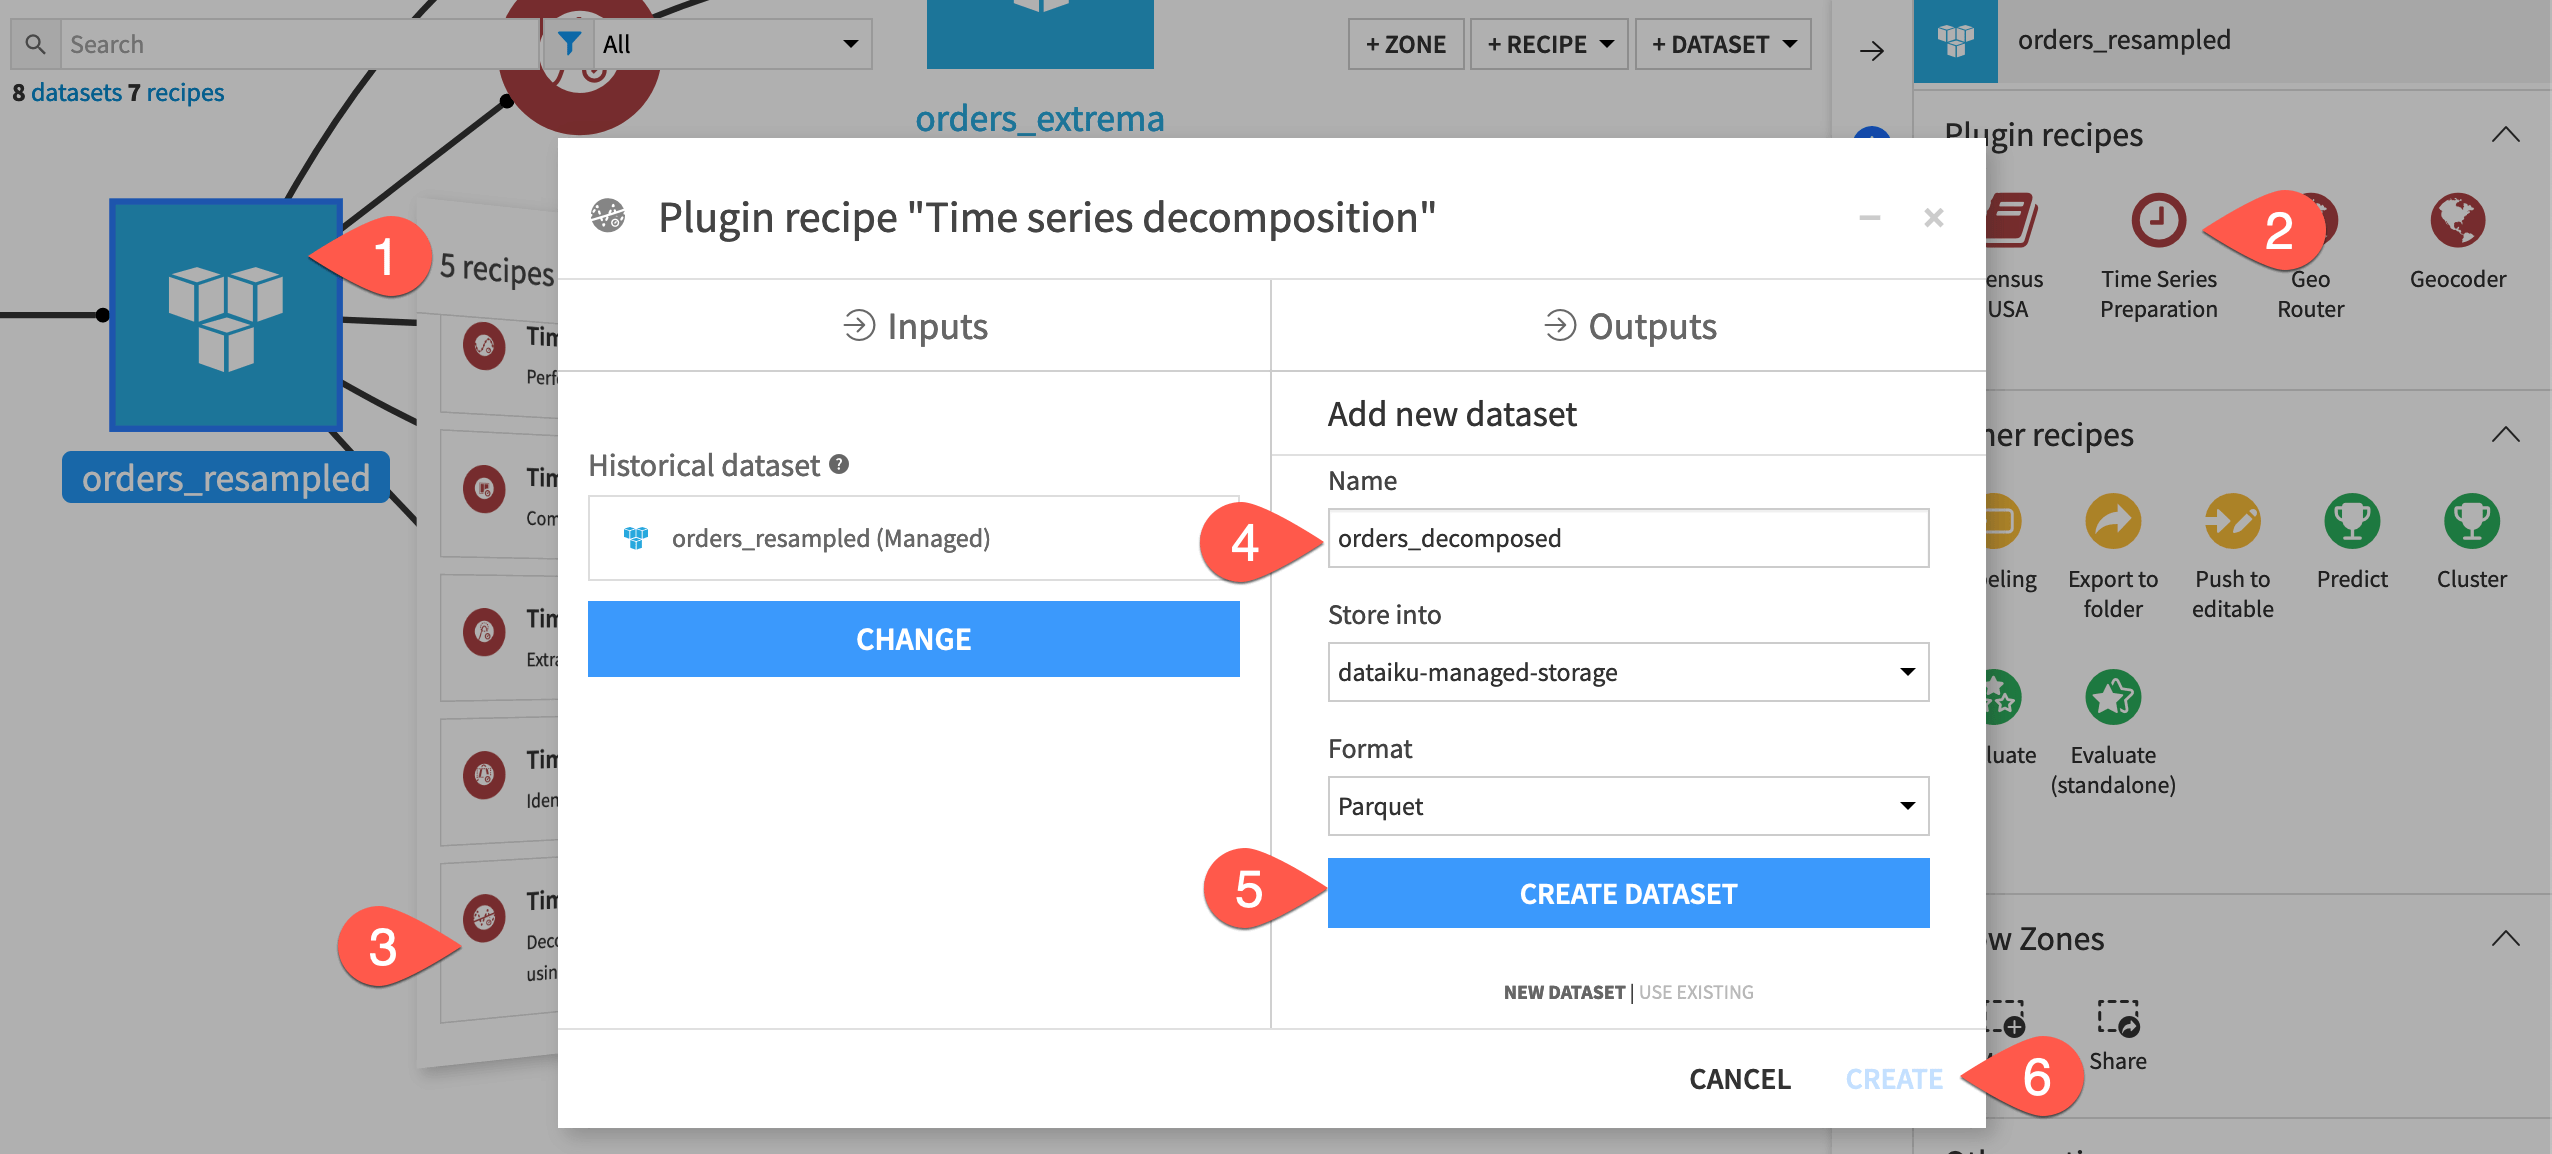
From the Flow, select the orders_resampled dataset.
In the Actions tab of the right panel, select Time Series Preparation from the menu of plugin recipes.
Select the Time series decomposition recipe from the dialog.
In the new dialog, click Set, and name the output dataset
orders_decomposed.Click Create Dataset to create the output.
Click Create to generate the recipe.
Configure a Decomposition recipe#
Then set the recipe’s parameters as follows:
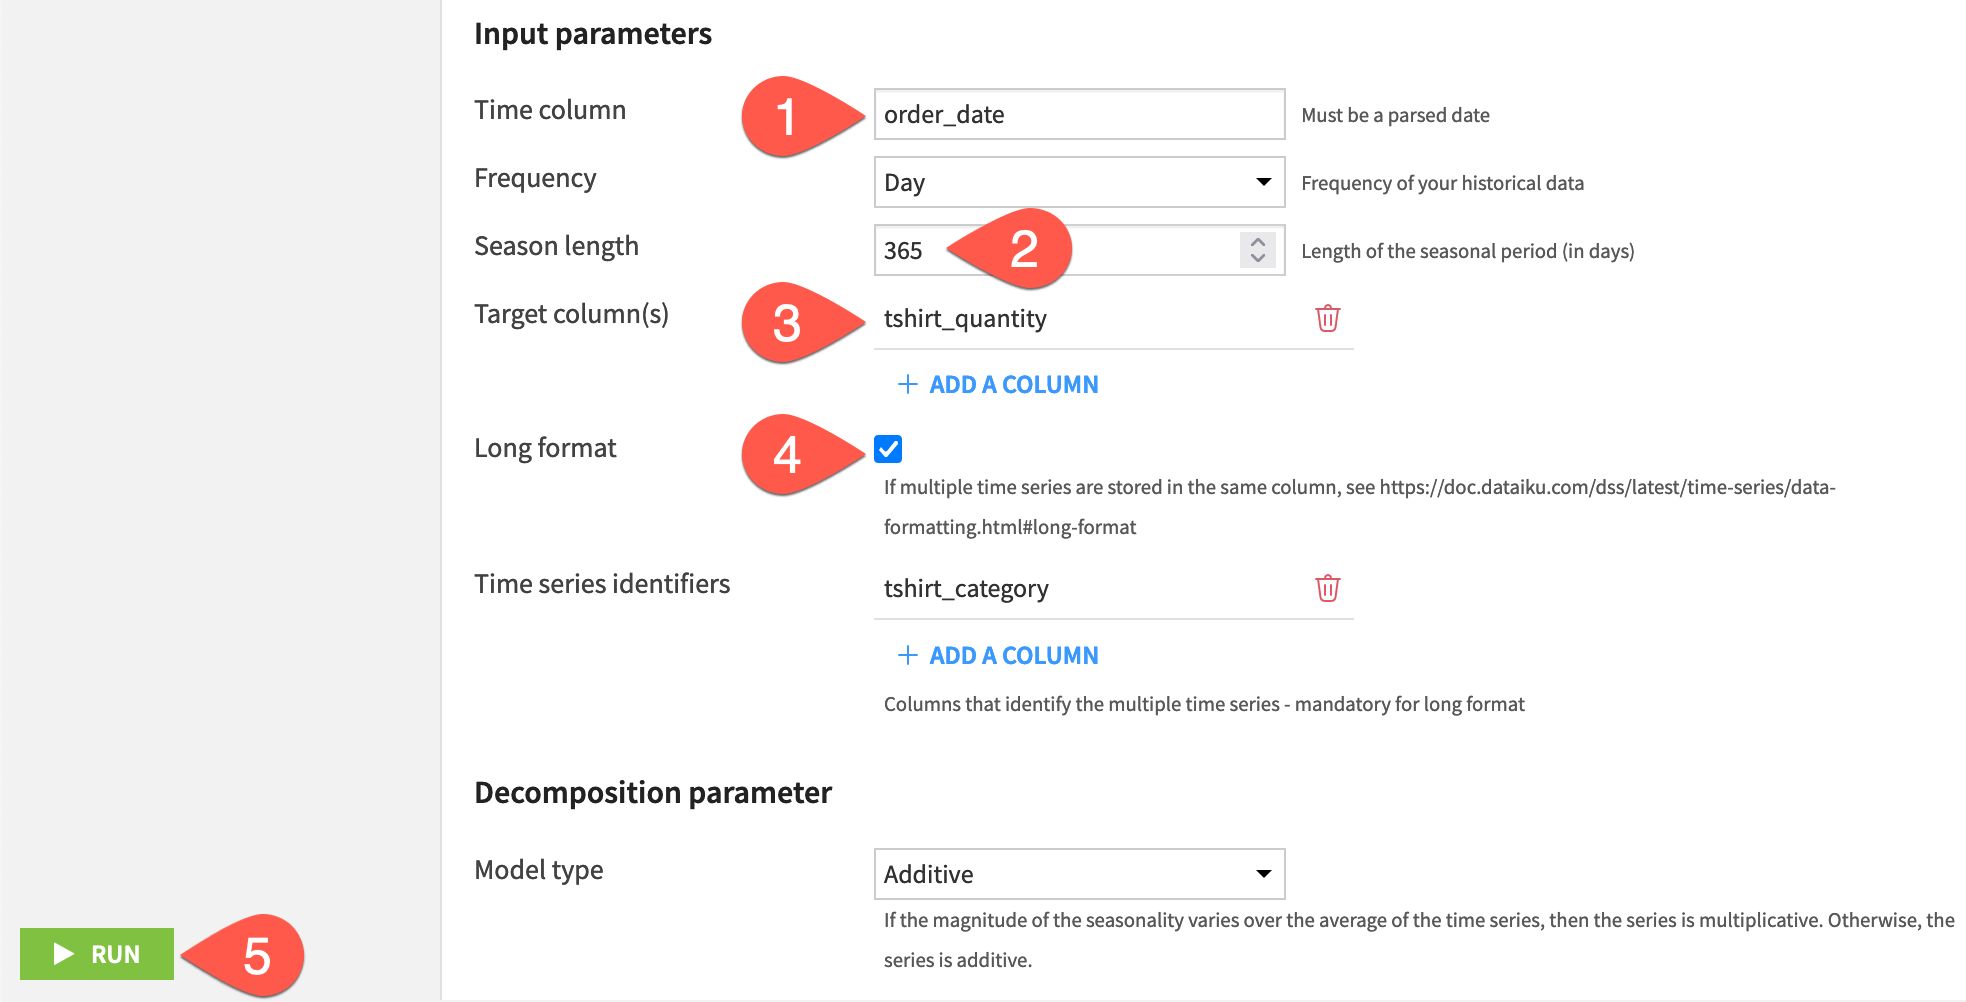
In the recipe’s settings, for the time column, select order_date.
Taking the default daily frequency, set the season length to
365.For the target column, click + Add a Column, and select tshirt_quantity.
Check the box to indicate the data is in Long format, click + Add a Column, and provide tshirt_category as the time series identifier.
Leaving the default additive model type, click Run, and then open the output dataset when finished.
Tip
In this case, we chose to use an additive model for time series decomposition. For other use cases, you can use charts and statistical tools to determine whether an additive or a multiplicative model is a better fit for this data!
Plot the decomposed output#
Let’s review the output of the recipe.
Open the output dataset orders_decomposed.
Observe that in addition to the original four columns, there are three new columns (ending in
_trend,_seasonal, and_residuals) for every target column, which in this case is just tshirt_quantity.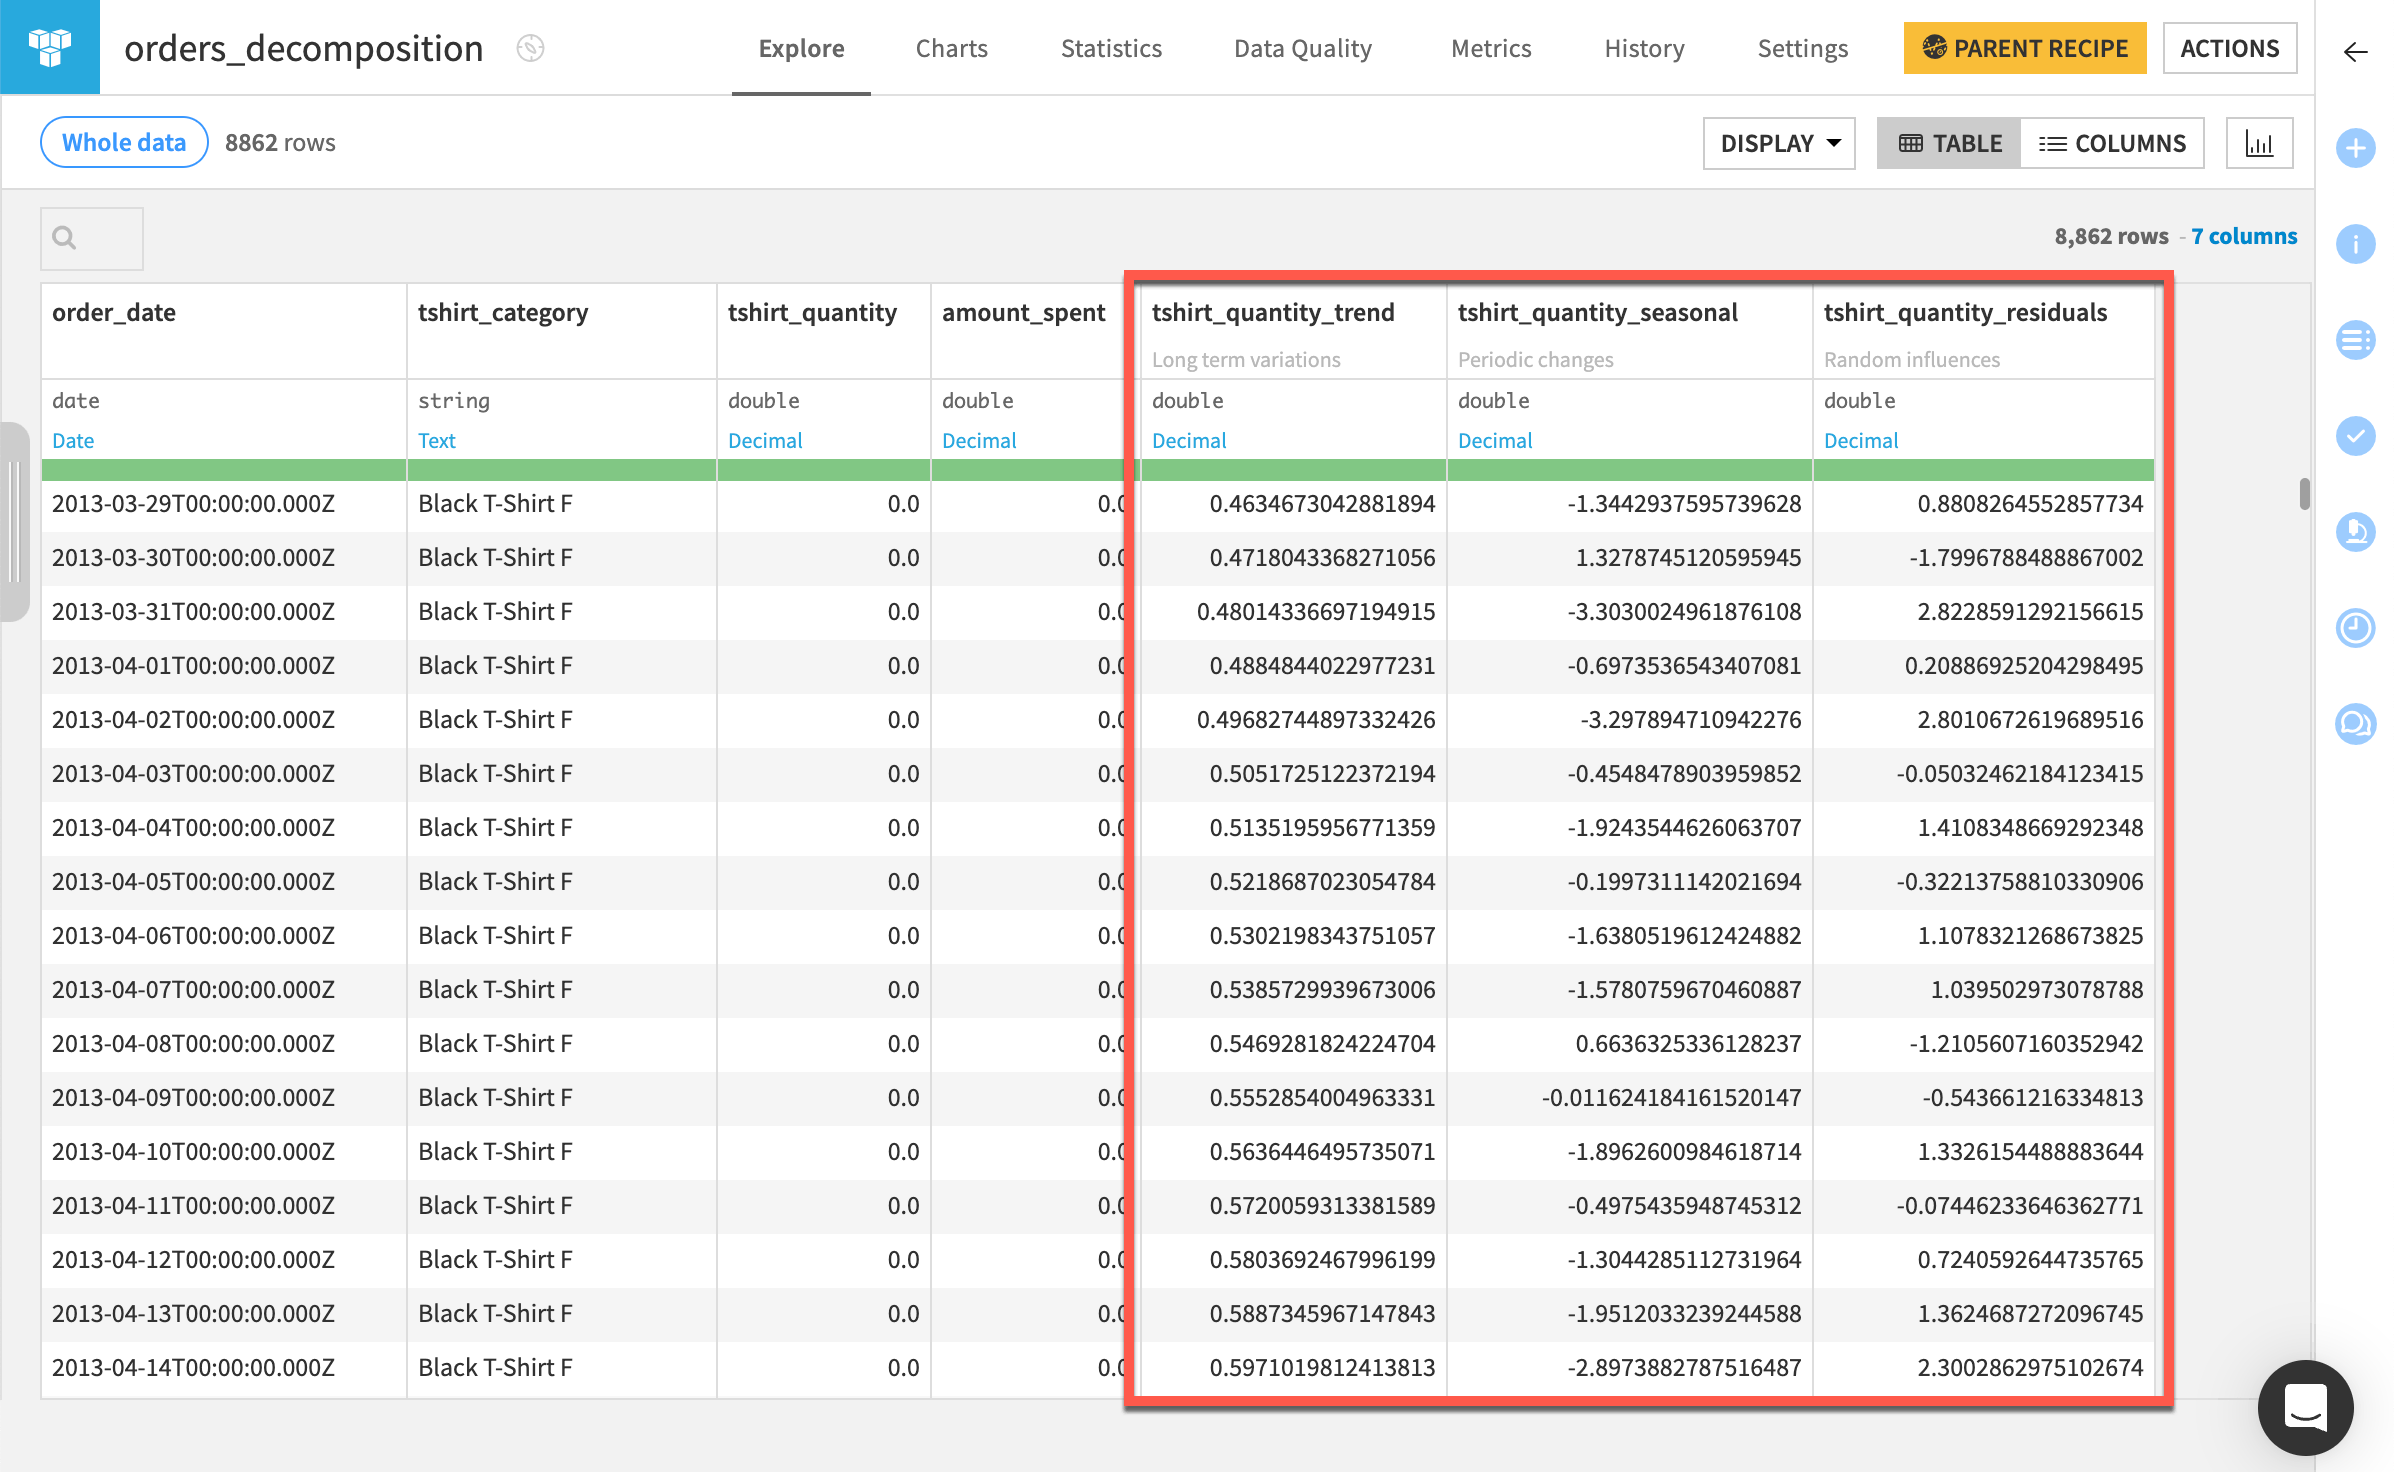
Navigate to the Charts tab of the dataset.
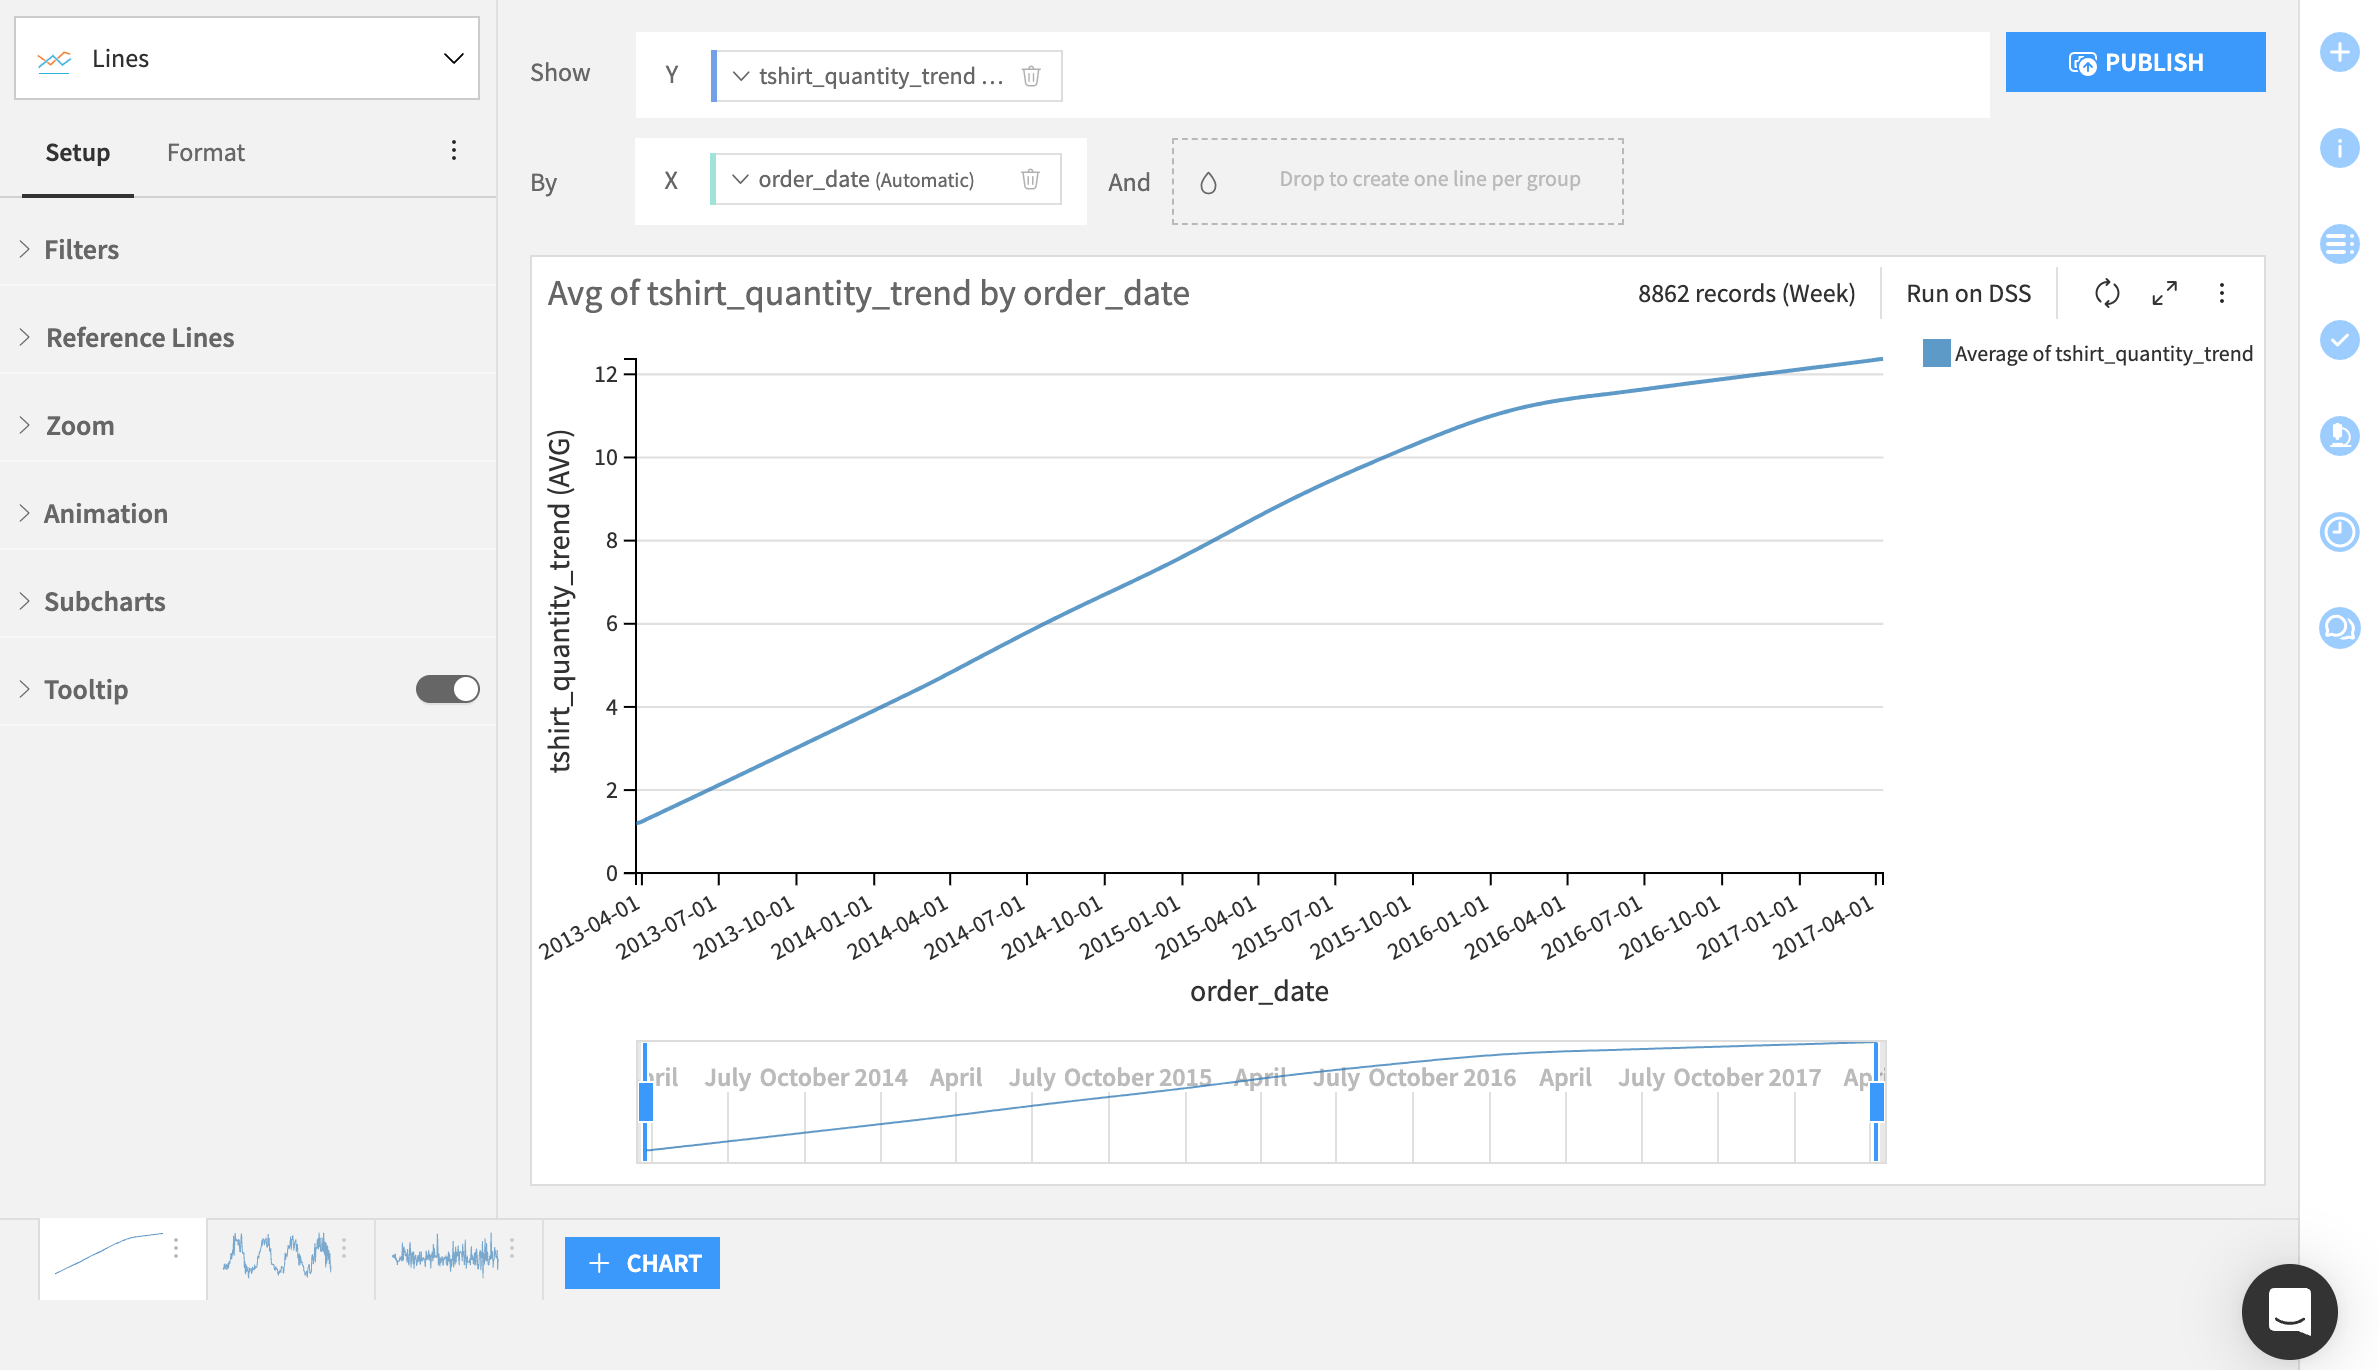
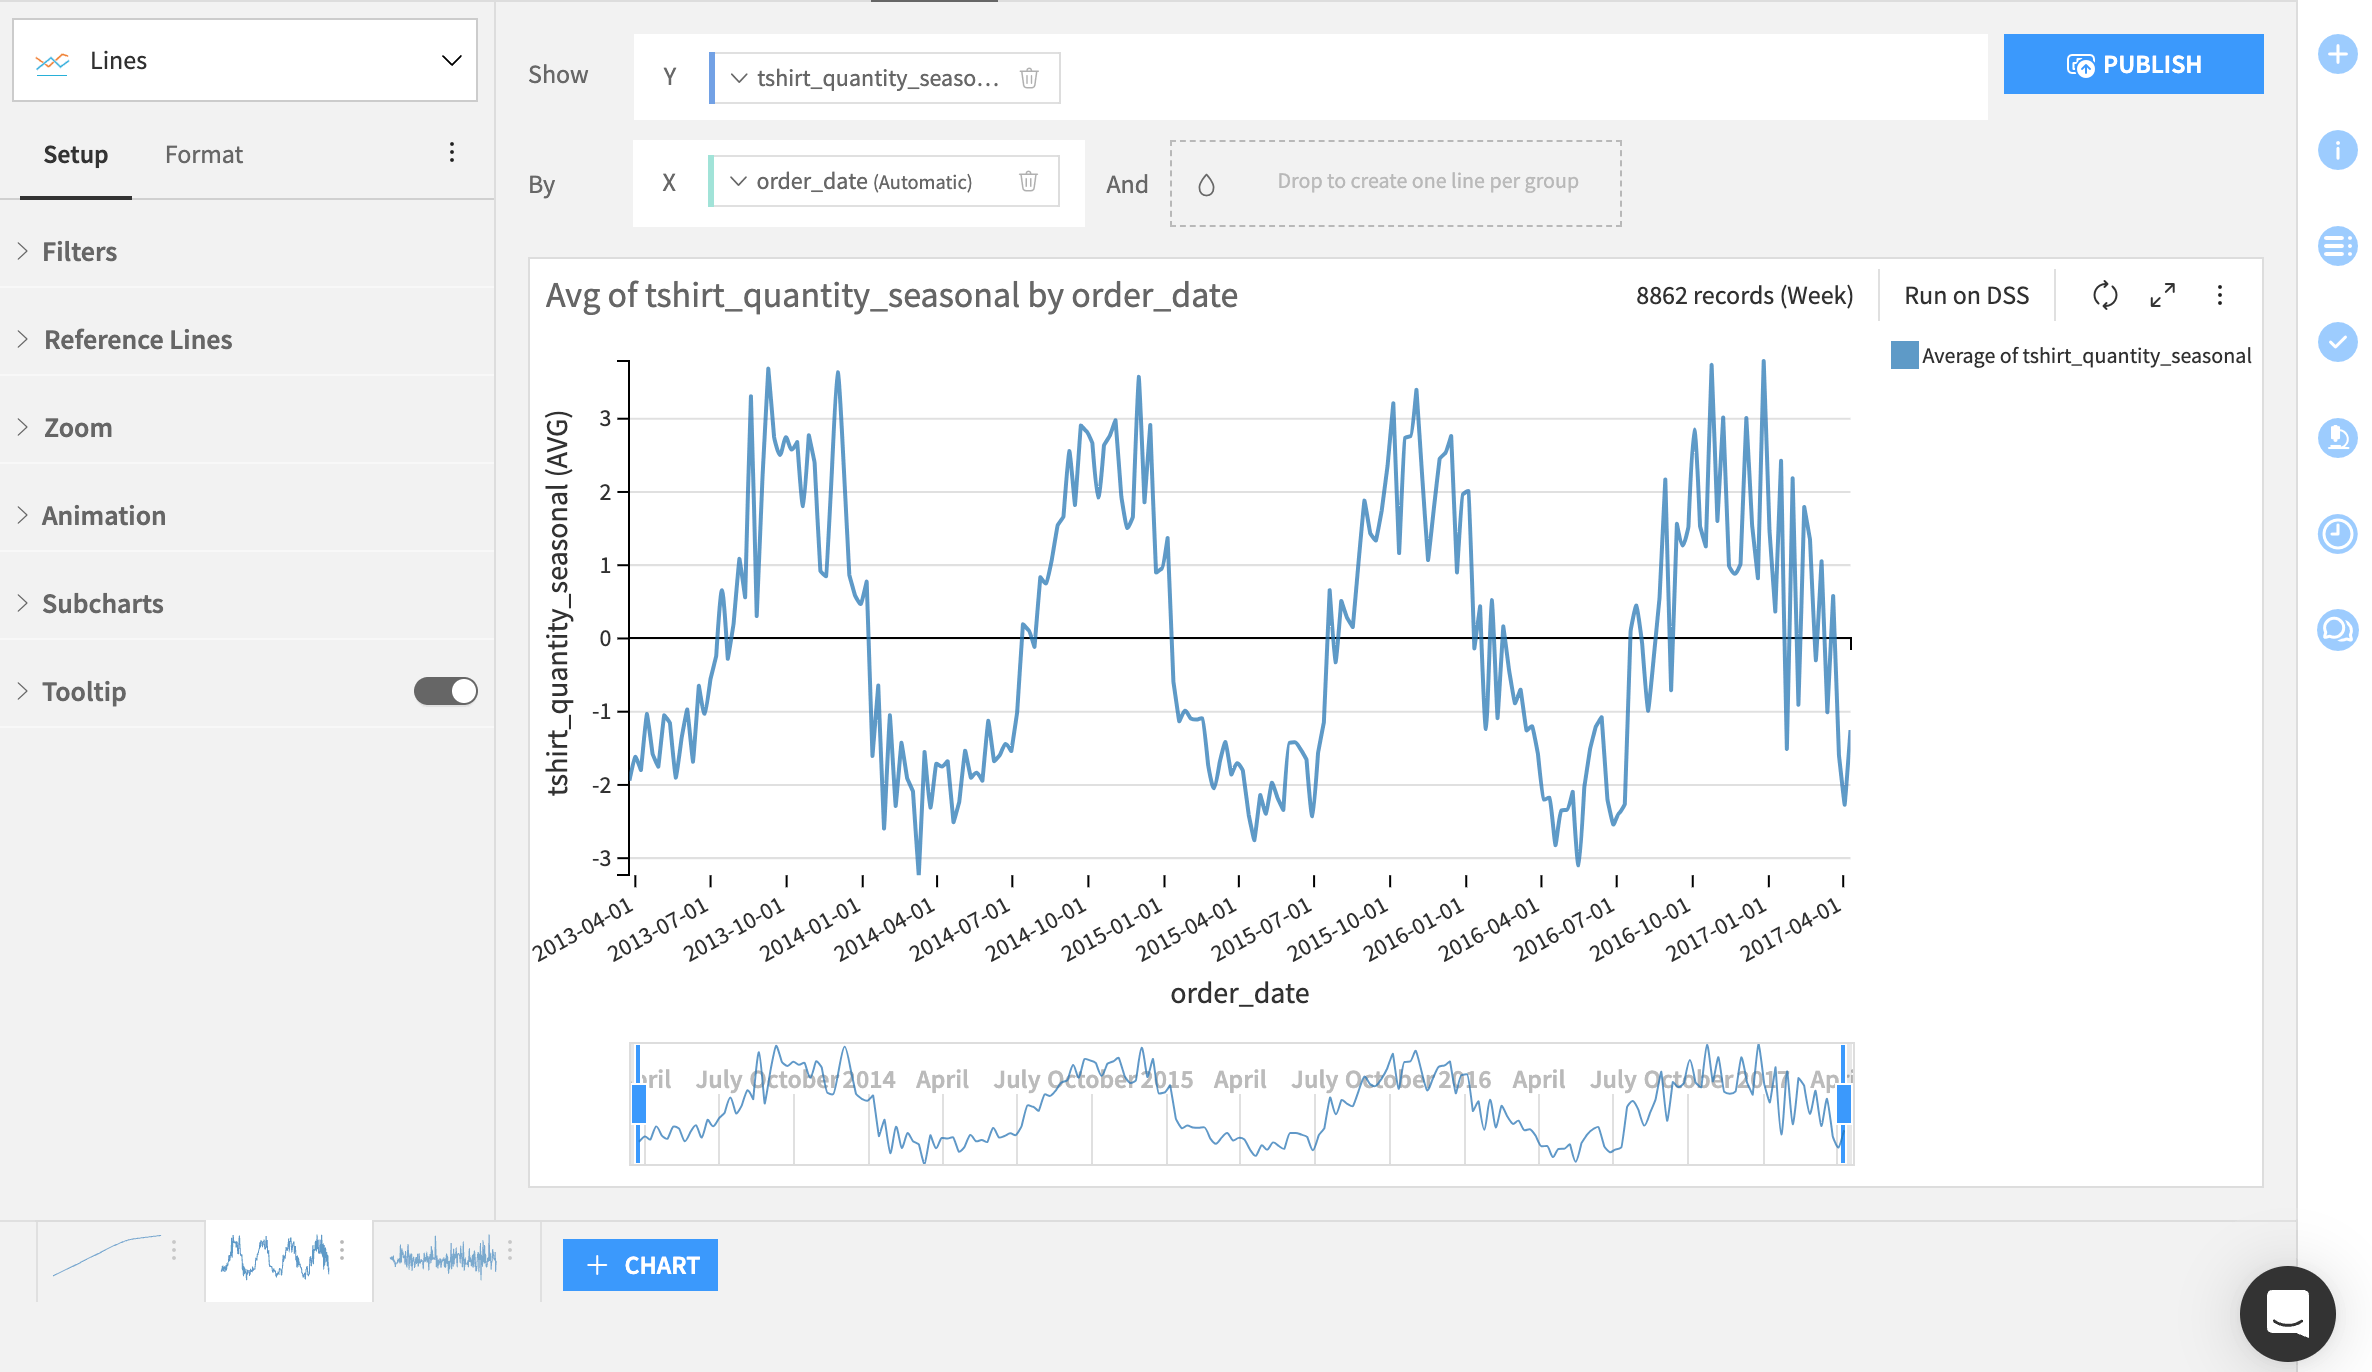
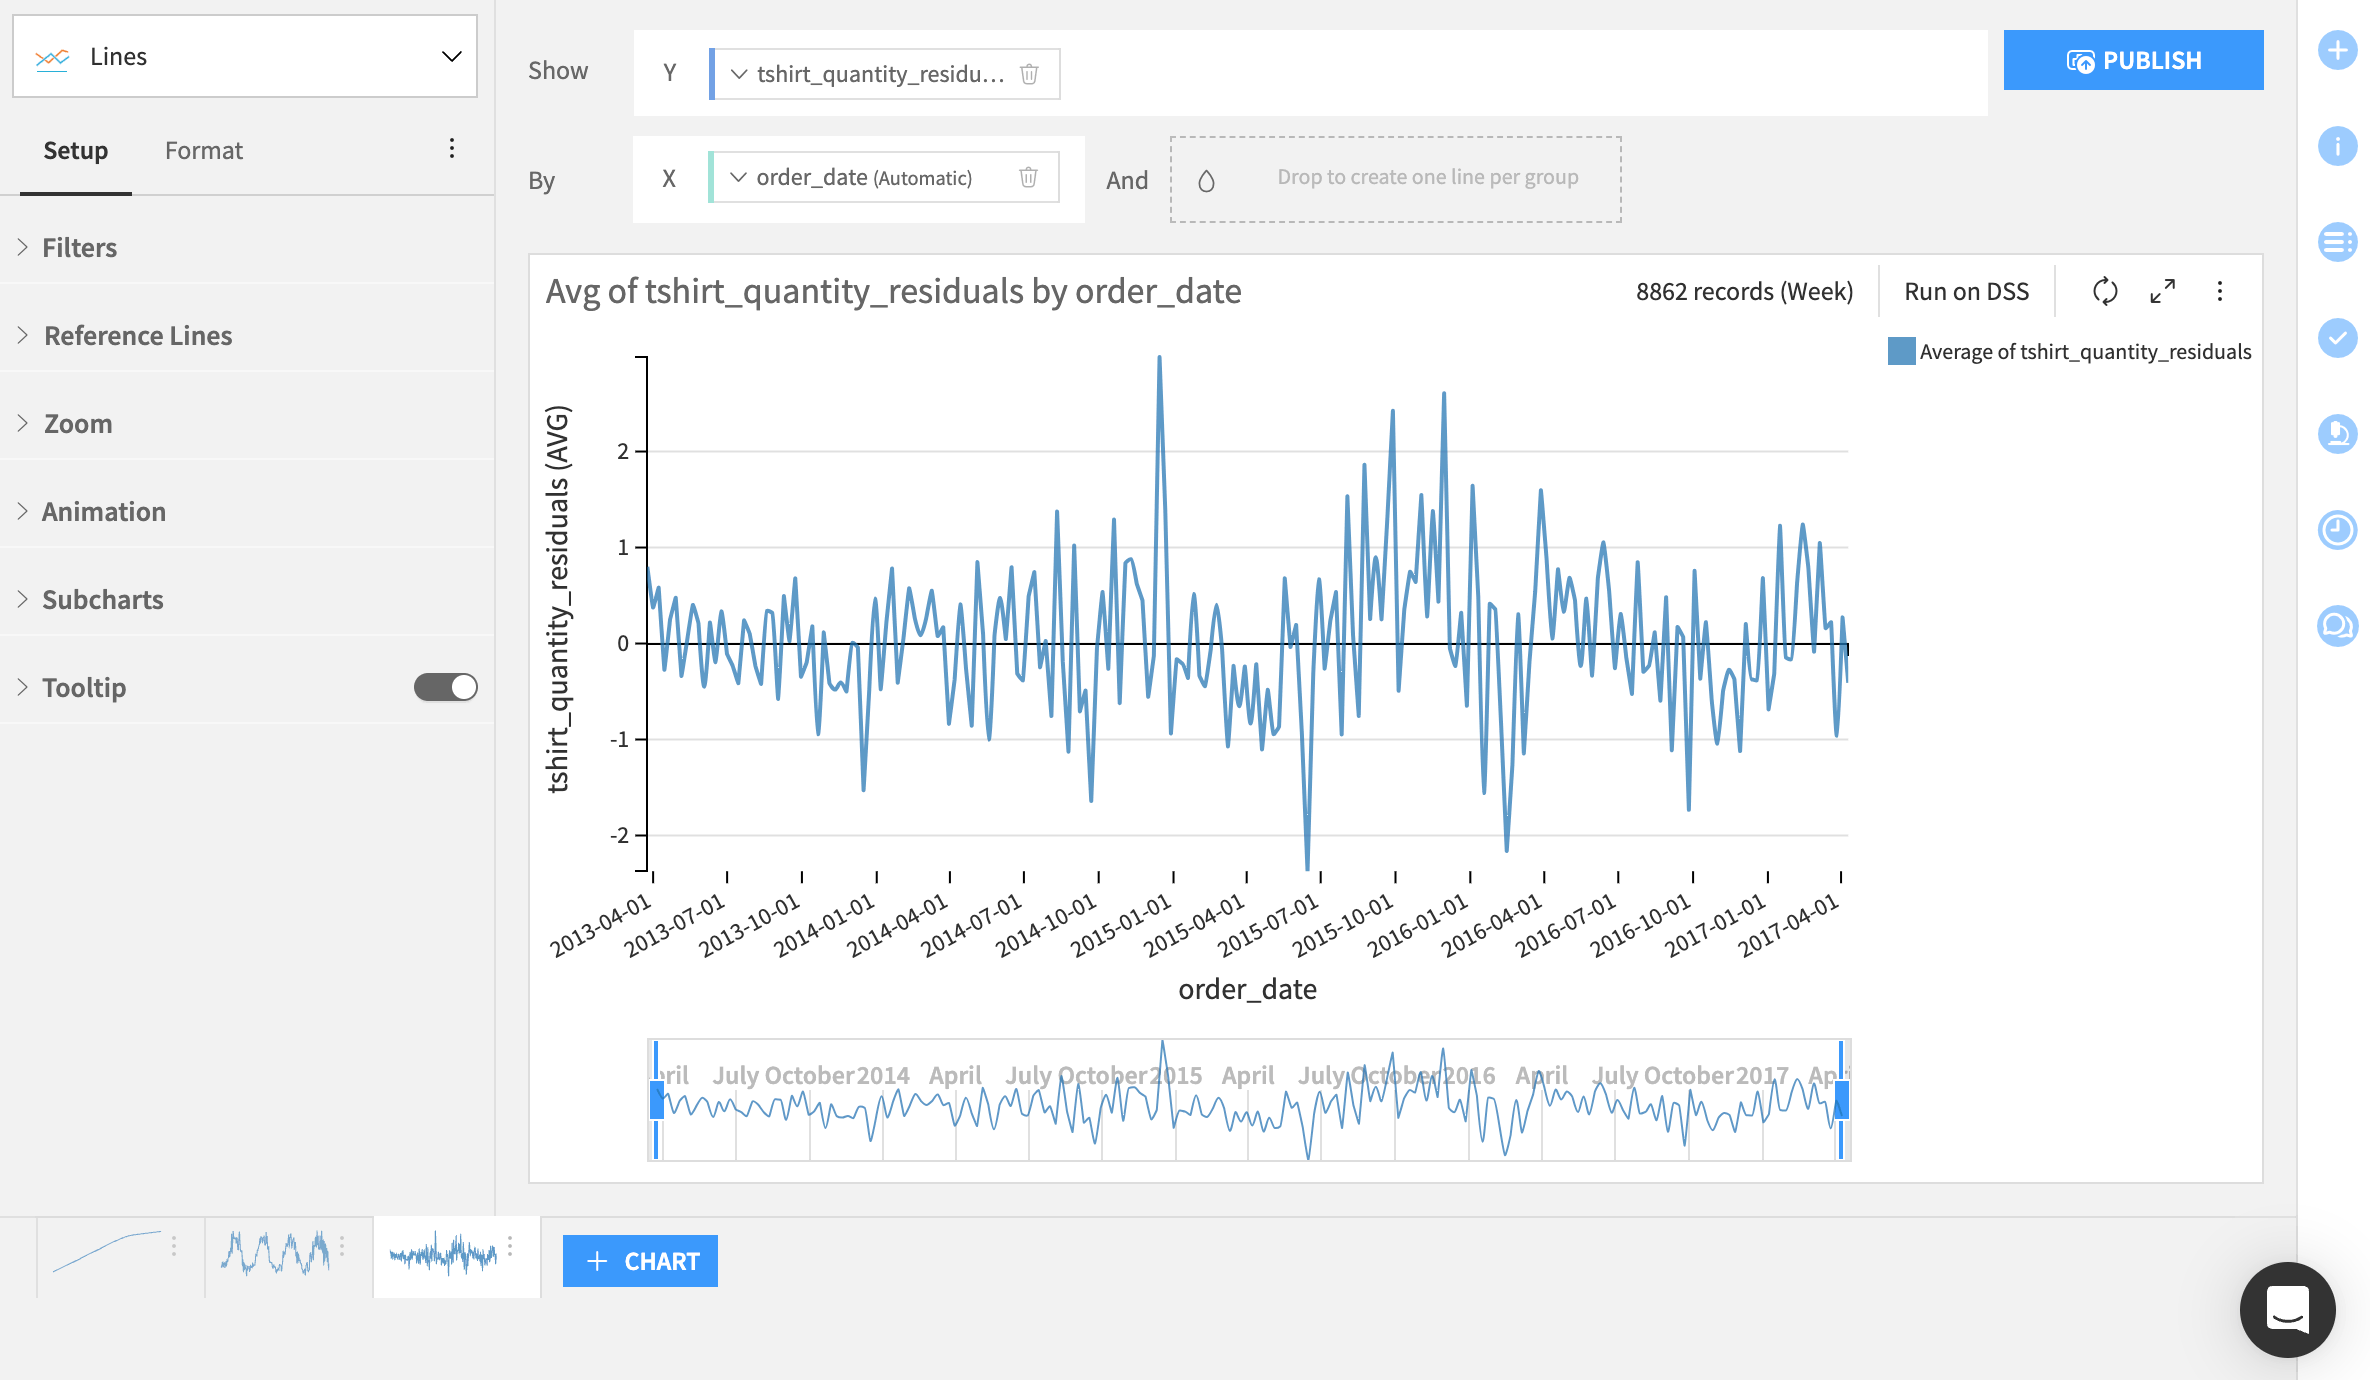
Plot the trend, seasonality, and residual over time using three separate line plots. For help, view the chart setups in the table below.
Interpretation |
Plot |
|---|---|
This trend plot shows a single positive trend over the four years. In this case, we can interpret that t-shirt sales increased over time. |
|
This seasonality plot reveals a yearly trend in t-shirt sales, as indicated by the four peaks in the data. This pattern suggests that t-shirt sales increase at specific times each year, particularly around Christmas. |
|
As expected, the residuals in the plot appear to reflect the noise in the data, or the random and patternless fluctuations. |
|
Hint
View the plots for each individual time series by adding tshirt_category to the Subcharts field.
Next steps#
Congratulations! You have gained experience using the recipes in the Time Series Preparation plugin.
With prepared time series data, you’ll be ready to forecast your time series data.

