
Concept | Dataiku datasets#
Watch the video or read the summary below.
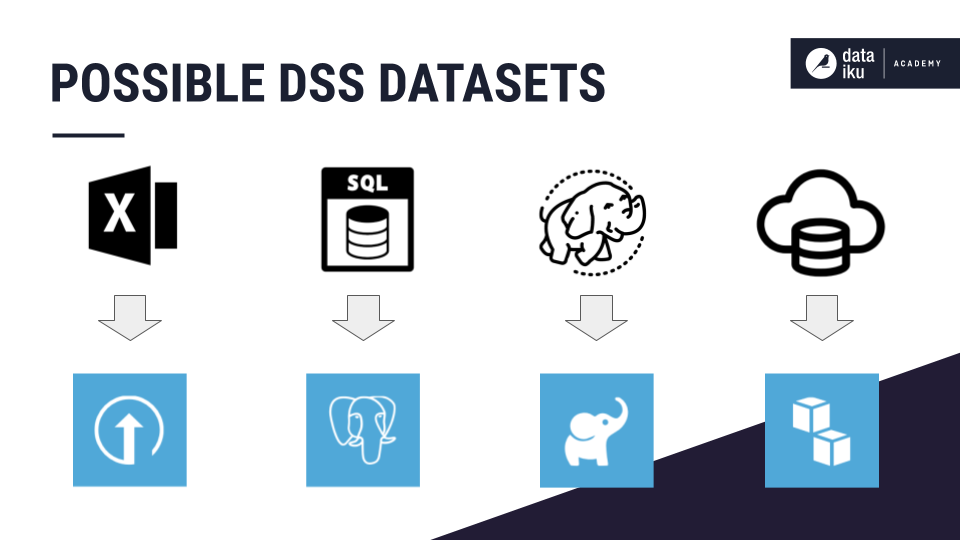
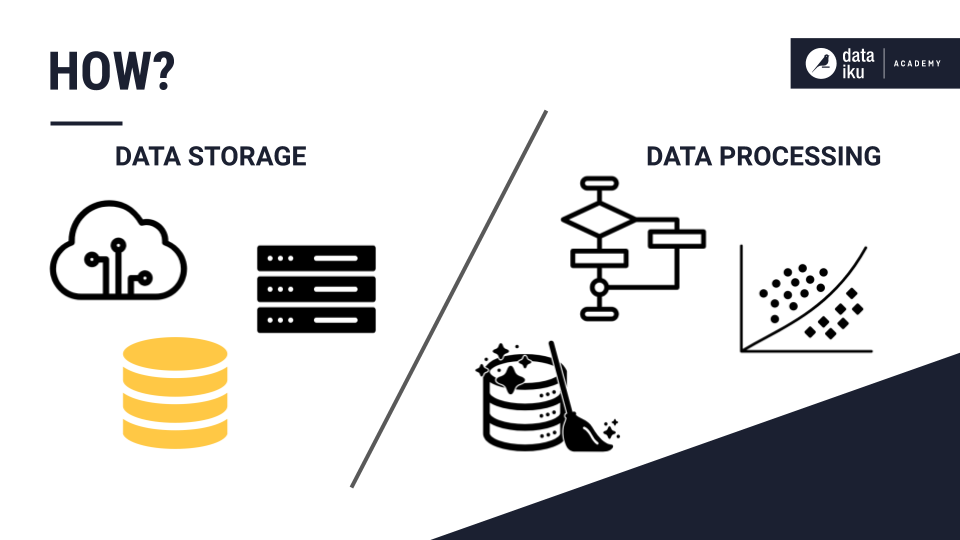
A dataset in Dataiku can be any piece of data in a tabular format. Examples of possible Dataiku datasets include:
An uploaded Excel spreadsheet
An SQL table
A folder of data files on a Hadoop cluster
A CSV file in the cloud, such as an Amazon S3 bucket
See also
As a developer, for more information on datasets, see the following articles in the Developer Guide:
Dataset representation in the Flow#
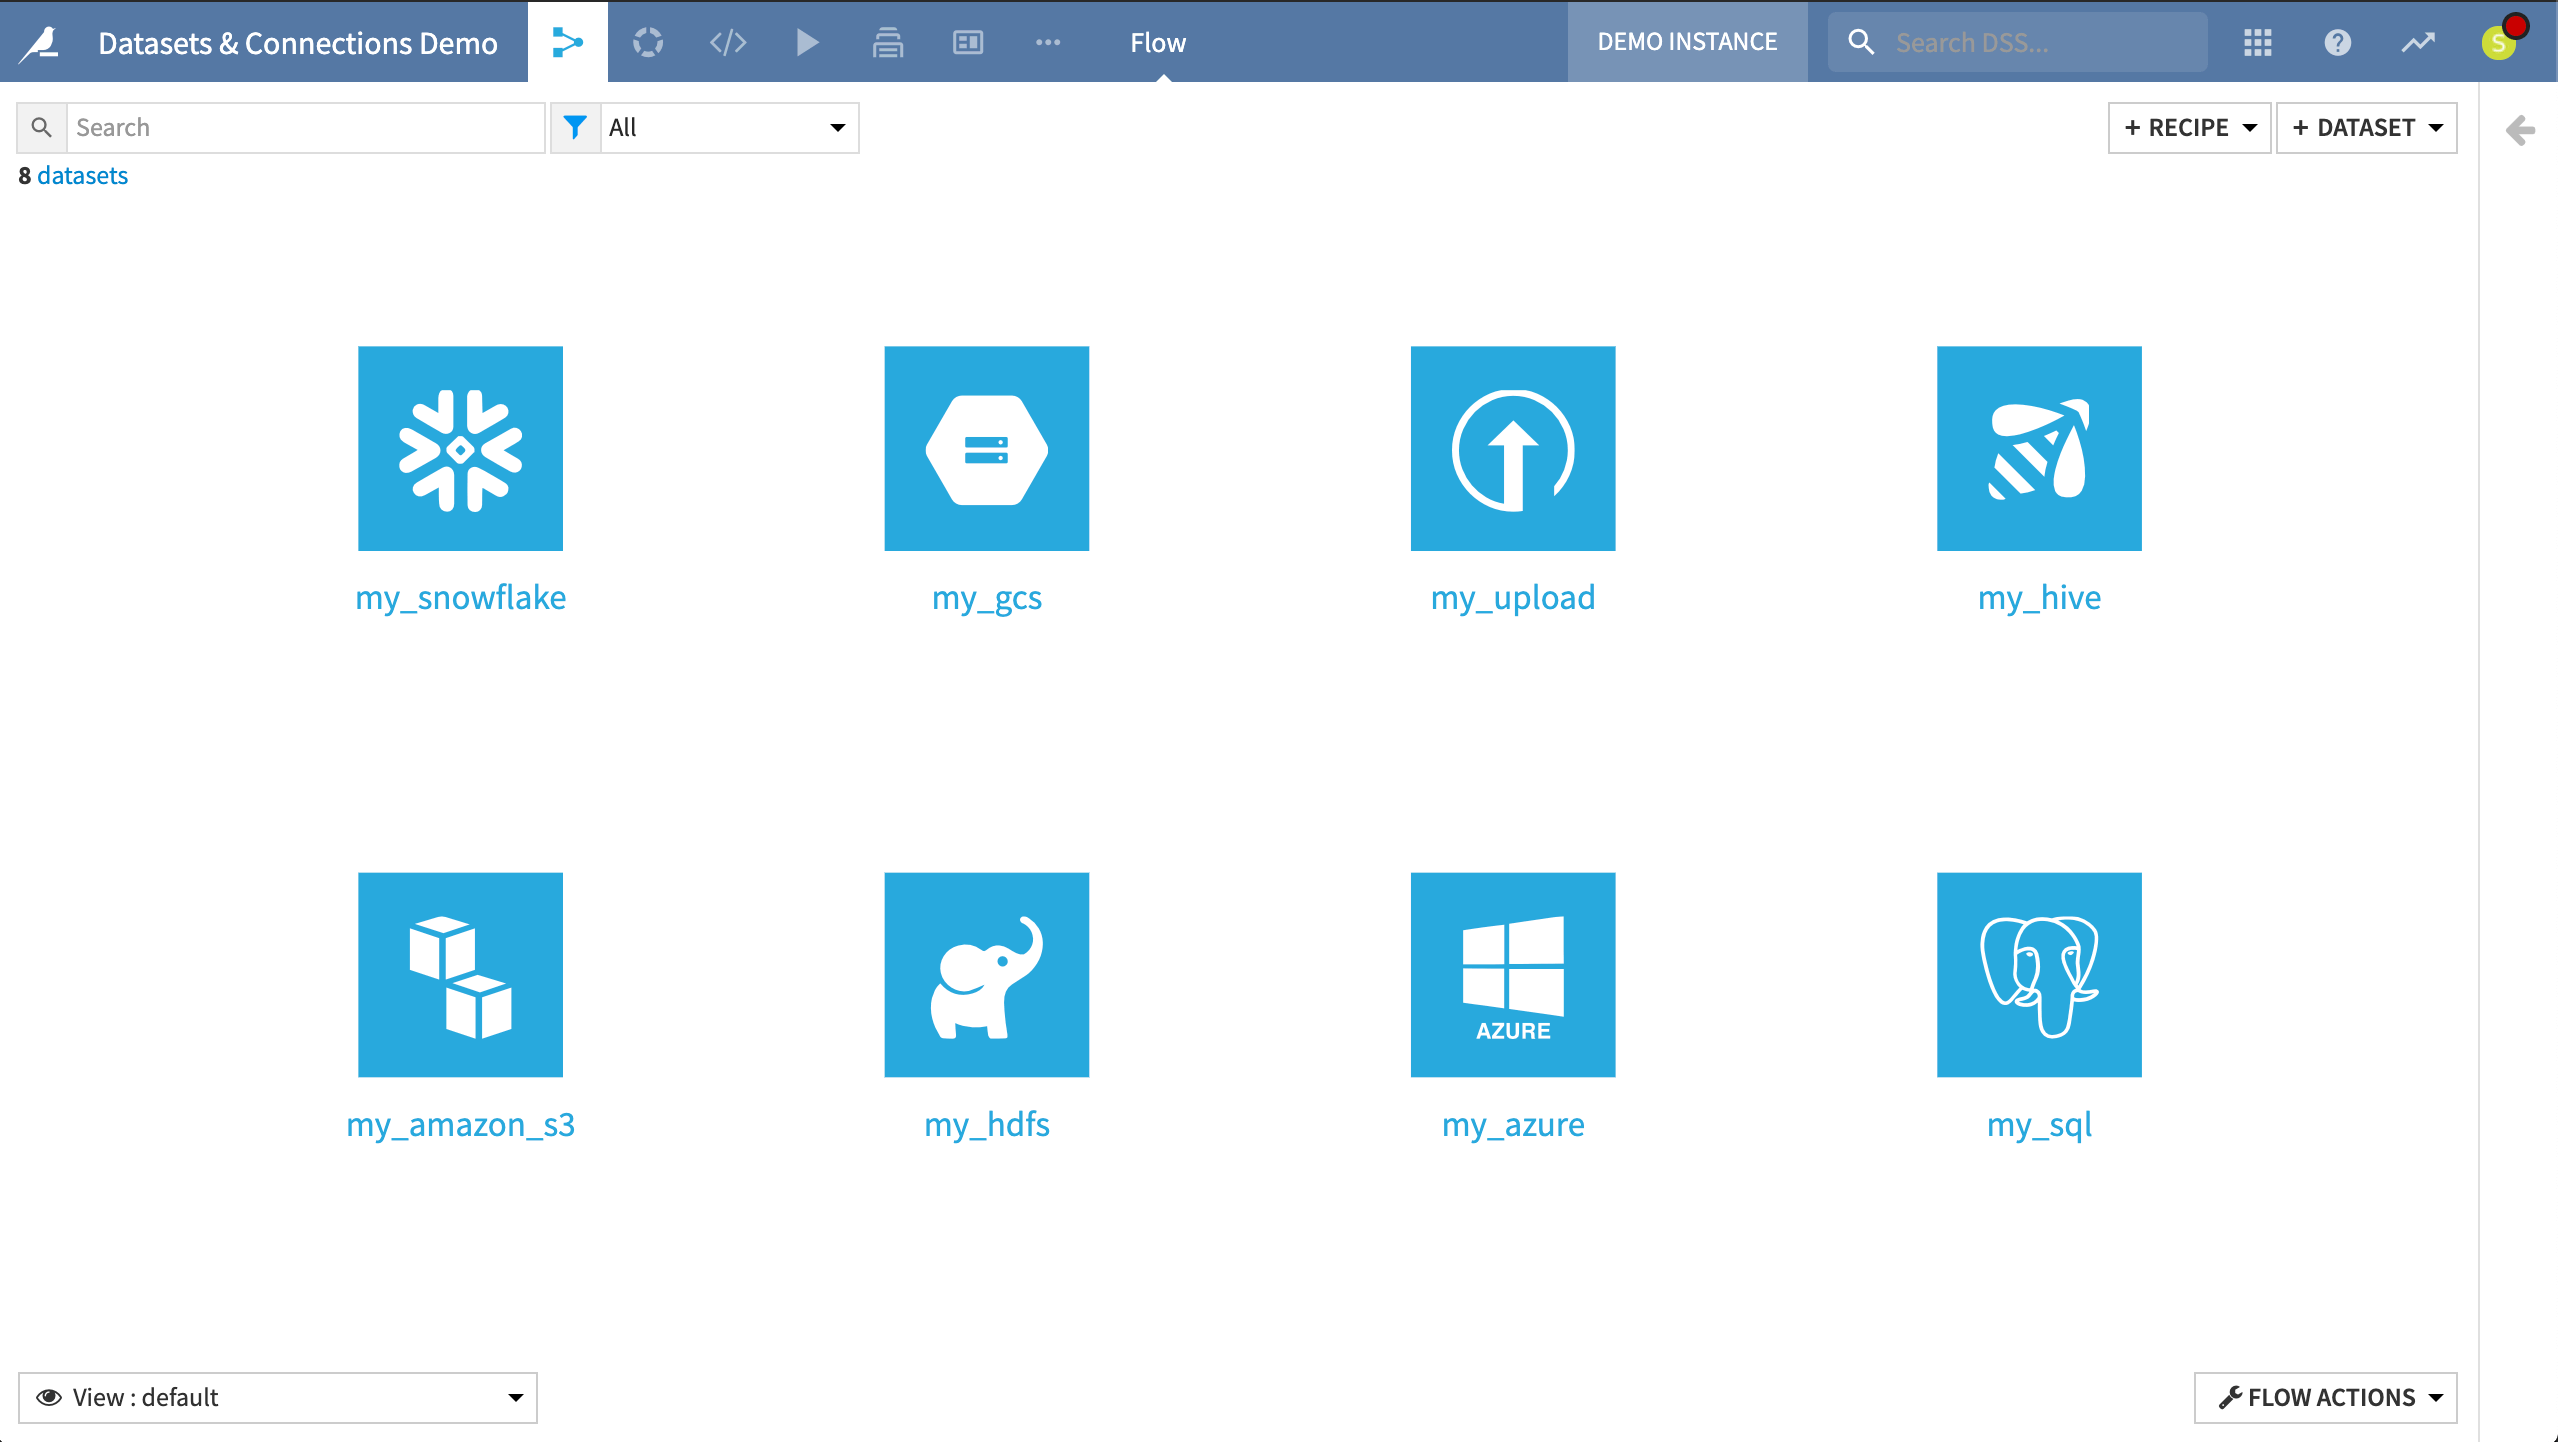
Dataiku represents all the datasets in the Flow of a project with a blue square with the icon matching the type of the source dataset.
The following example Flow includes different types of datasets, such as an uploaded file, a table in an SQL database, and cloud storage datasets.
Interactions with datasets#
Regardless of the origins of the source dataset, the methods for interacting with any Dataiku dataset are the same. You can read, write, visualize, and manipulate datasets within Dataiku using the same methods.
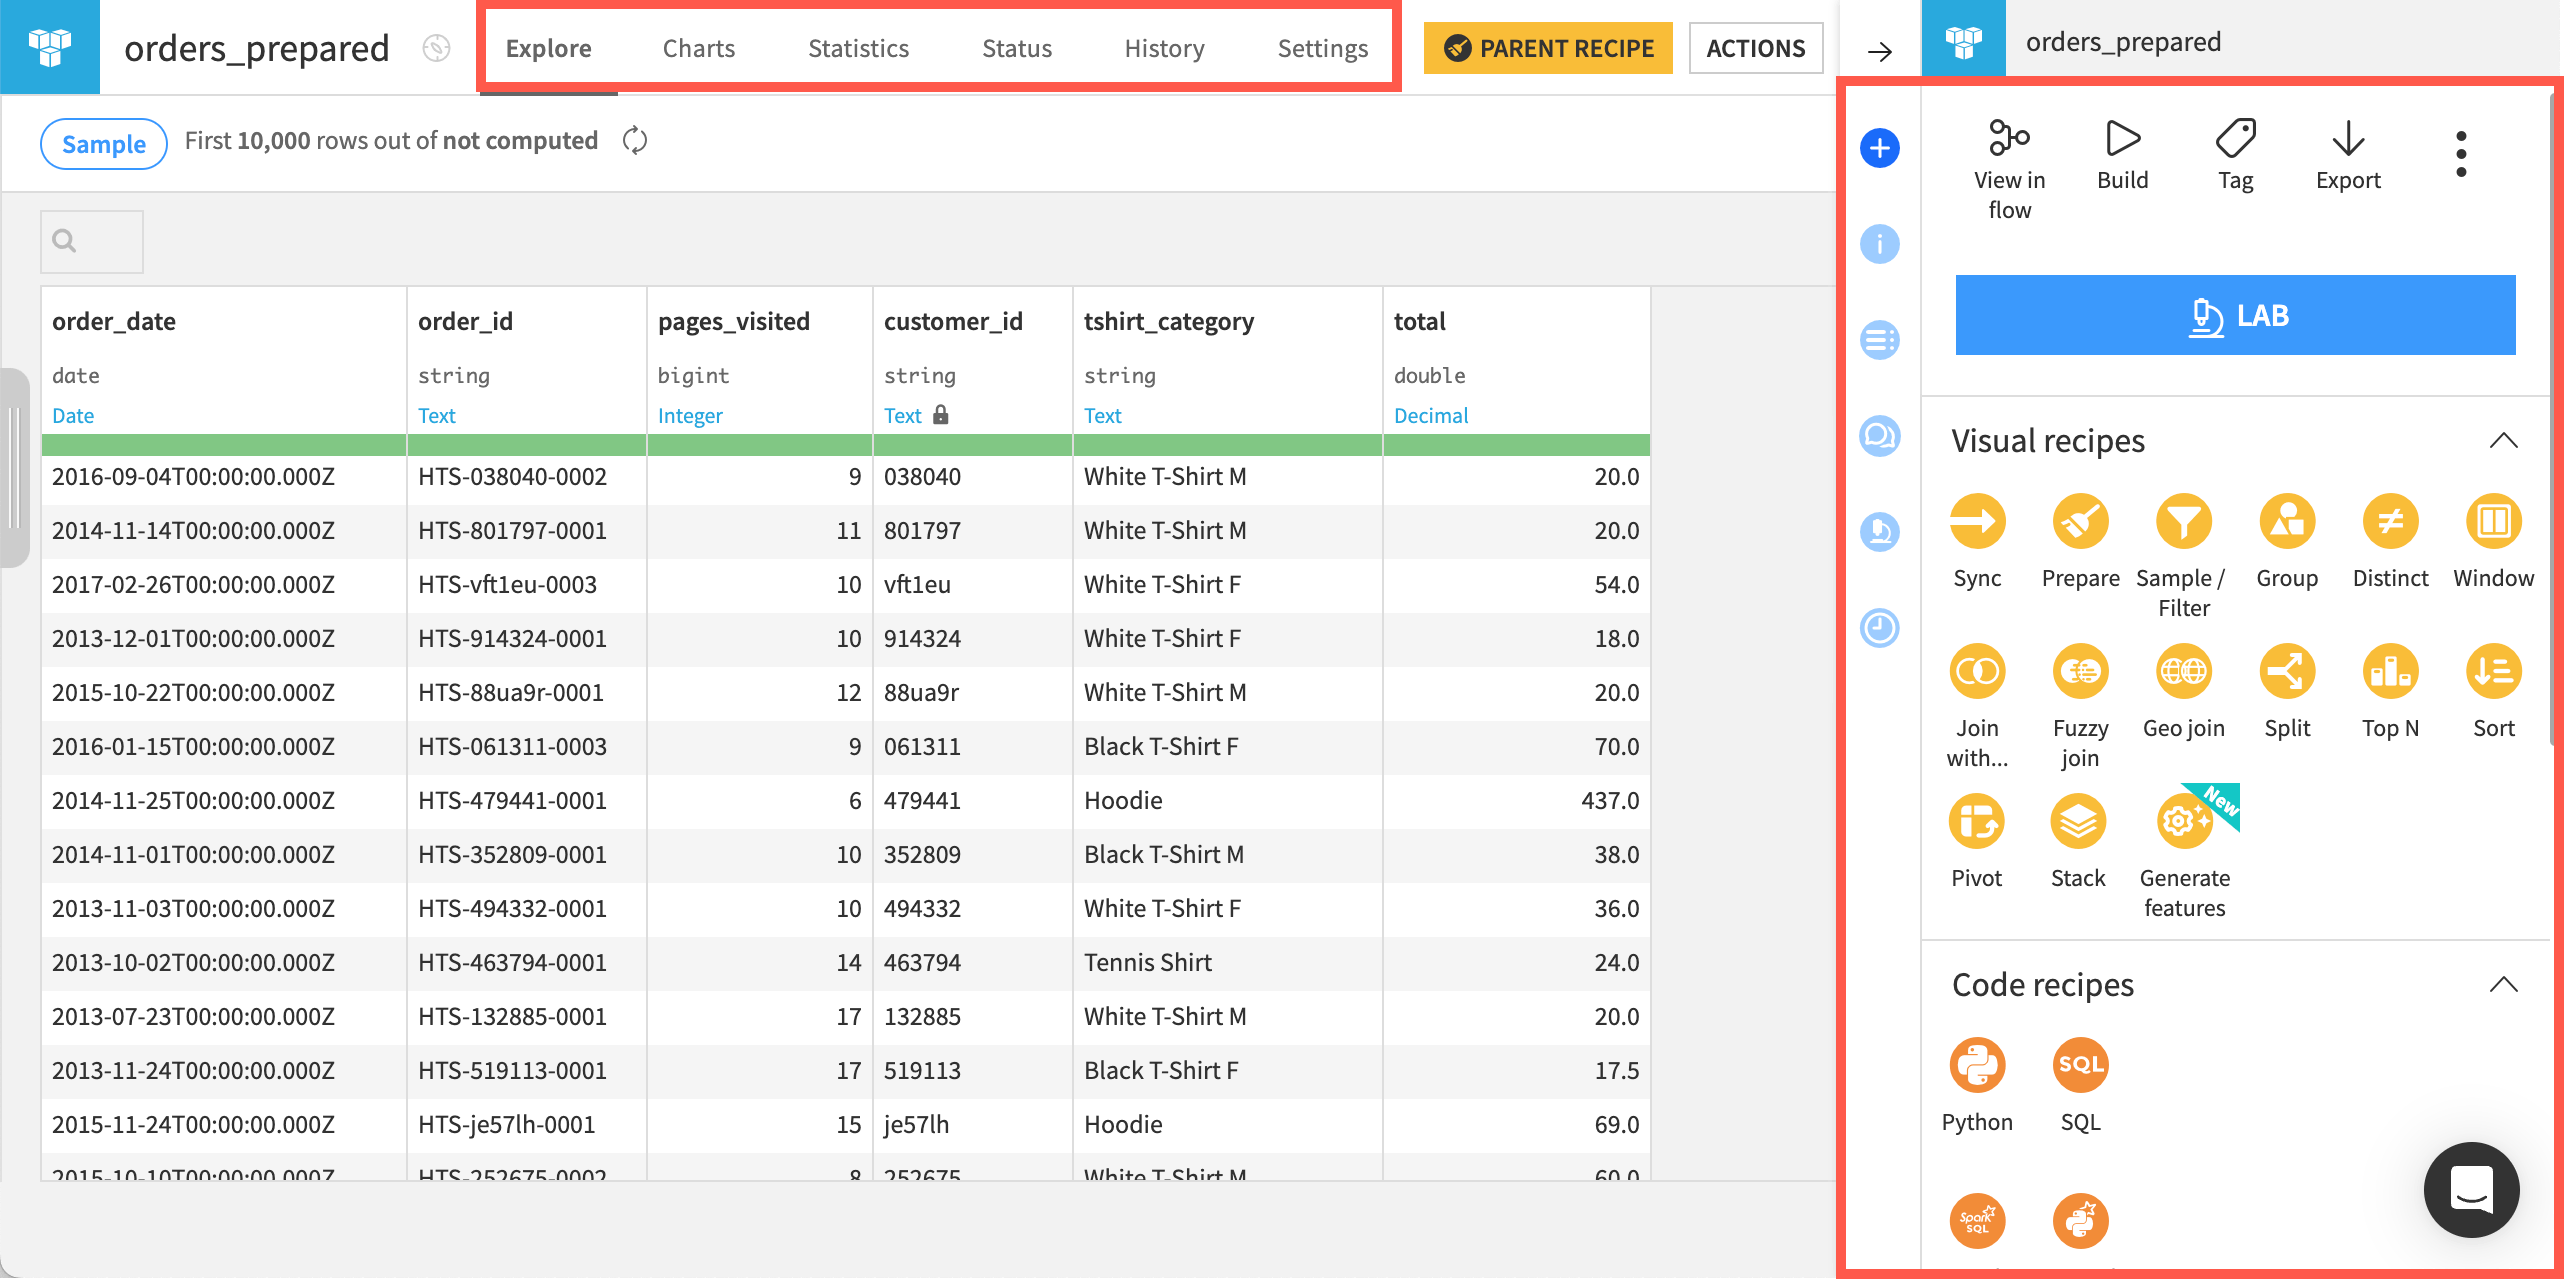
Indeed, the complete dataset interface includes:
An Explore tab for investigating the dataset
A Charts tab for visualization
A Statistics tab for in-depth statistical reports
A Data Quality tab for establishing rules
A Metrics tab for tracking important measurements
A History tab for following the dataset history (creation date, commits, etc.)
A Settings tab including details about the source of the dataset, either the underlying connection or the original files that were uploaded
The same sets of visual, code, and plugin recipes
This is possible because Dataiku decouples data processing logic (such as recipes in the Flow) from the underlying storage infrastructure of a dataset.
Connections to the data#
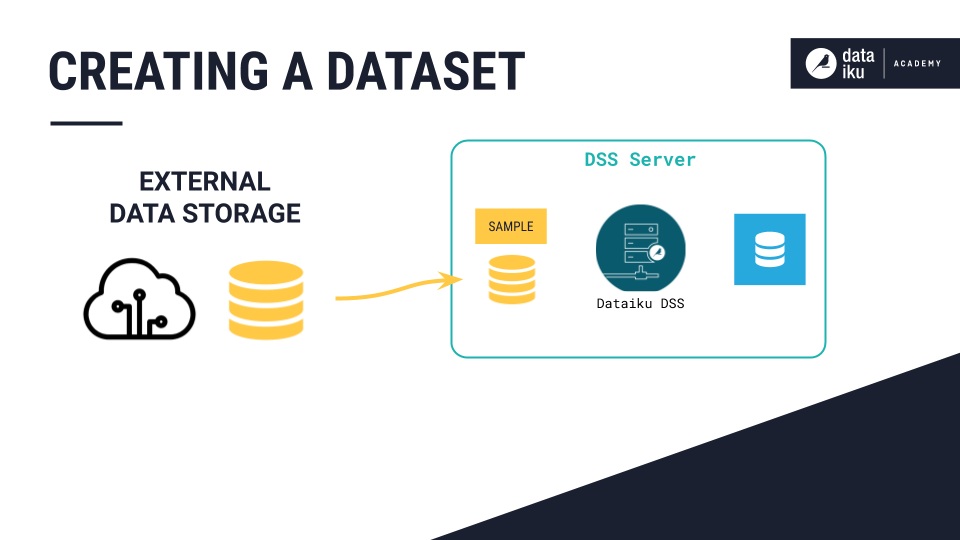
Except for directly uploading files to Dataiku, the Dataiku server doesn’t need to ingest the entire dataset to create its representation in Dataiku.
Generally, creating a dataset in Dataiku means that the user merely informs Dataiku of how it can access the data from a particular connection.
Dataiku remembers the location of the original external or source datasets. The data isn’t copied into Dataiku. Rather, the dataset in Dataiku is a view of the data in the original system. The browser transfers only a dataset sample, as configured by the user.
See also
For more information, see also Connecting to data in the reference documentation.
Next steps#
In this lesson, you learned about datasets used in a Dataiku project. Continue getting to know the basics of Dataiku by learning about: