Tutorial | Static insights#
Get started#
Dataiku has a native drag-and-drop chart builder for many types of plots. However, sometimes you may prefer to code your own visualization using your favorite library.
For these cases, static insights are data files generated with code in Dataiku that allow you to save and publish on a dashboard any custom figure. Let’s see how they work!
Objectives#
In this tutorial, you will:
Create a static insight with a Python or R visualization library (such as matplotlib, ggplot2, or altair).
Publish a static insight to a dashboard.
Prerequisites#
Dataiku 12.0 or later.
An Advanced Analytics Designer or Full Designer user profile.
Some familiarity with Python and/or R.
Basic knowledge of working with code notebooks in Dataiku.
A code environment that supports the visualization library you want to use. The default Python and R code environments on Dataiku Cloud include the libraries found in this tutorial.
Create the project#
From the Dataiku Design homepage, click + New Project.
Select Learning projects.
Search for and select Static Insights.
If needed, change the folder into which the project will be installed, and click Create.
From the project homepage, click Go to Flow (or type
g+f).
From the Dataiku Design homepage, click + New Project.
Select DSS tutorials.
Filter by Developer.
Select Static Insights.
From the project homepage, click Go to Flow (or type
g+f).
Note
You can also download the starter project from this website and import it as a ZIP file.
Create a notebook#
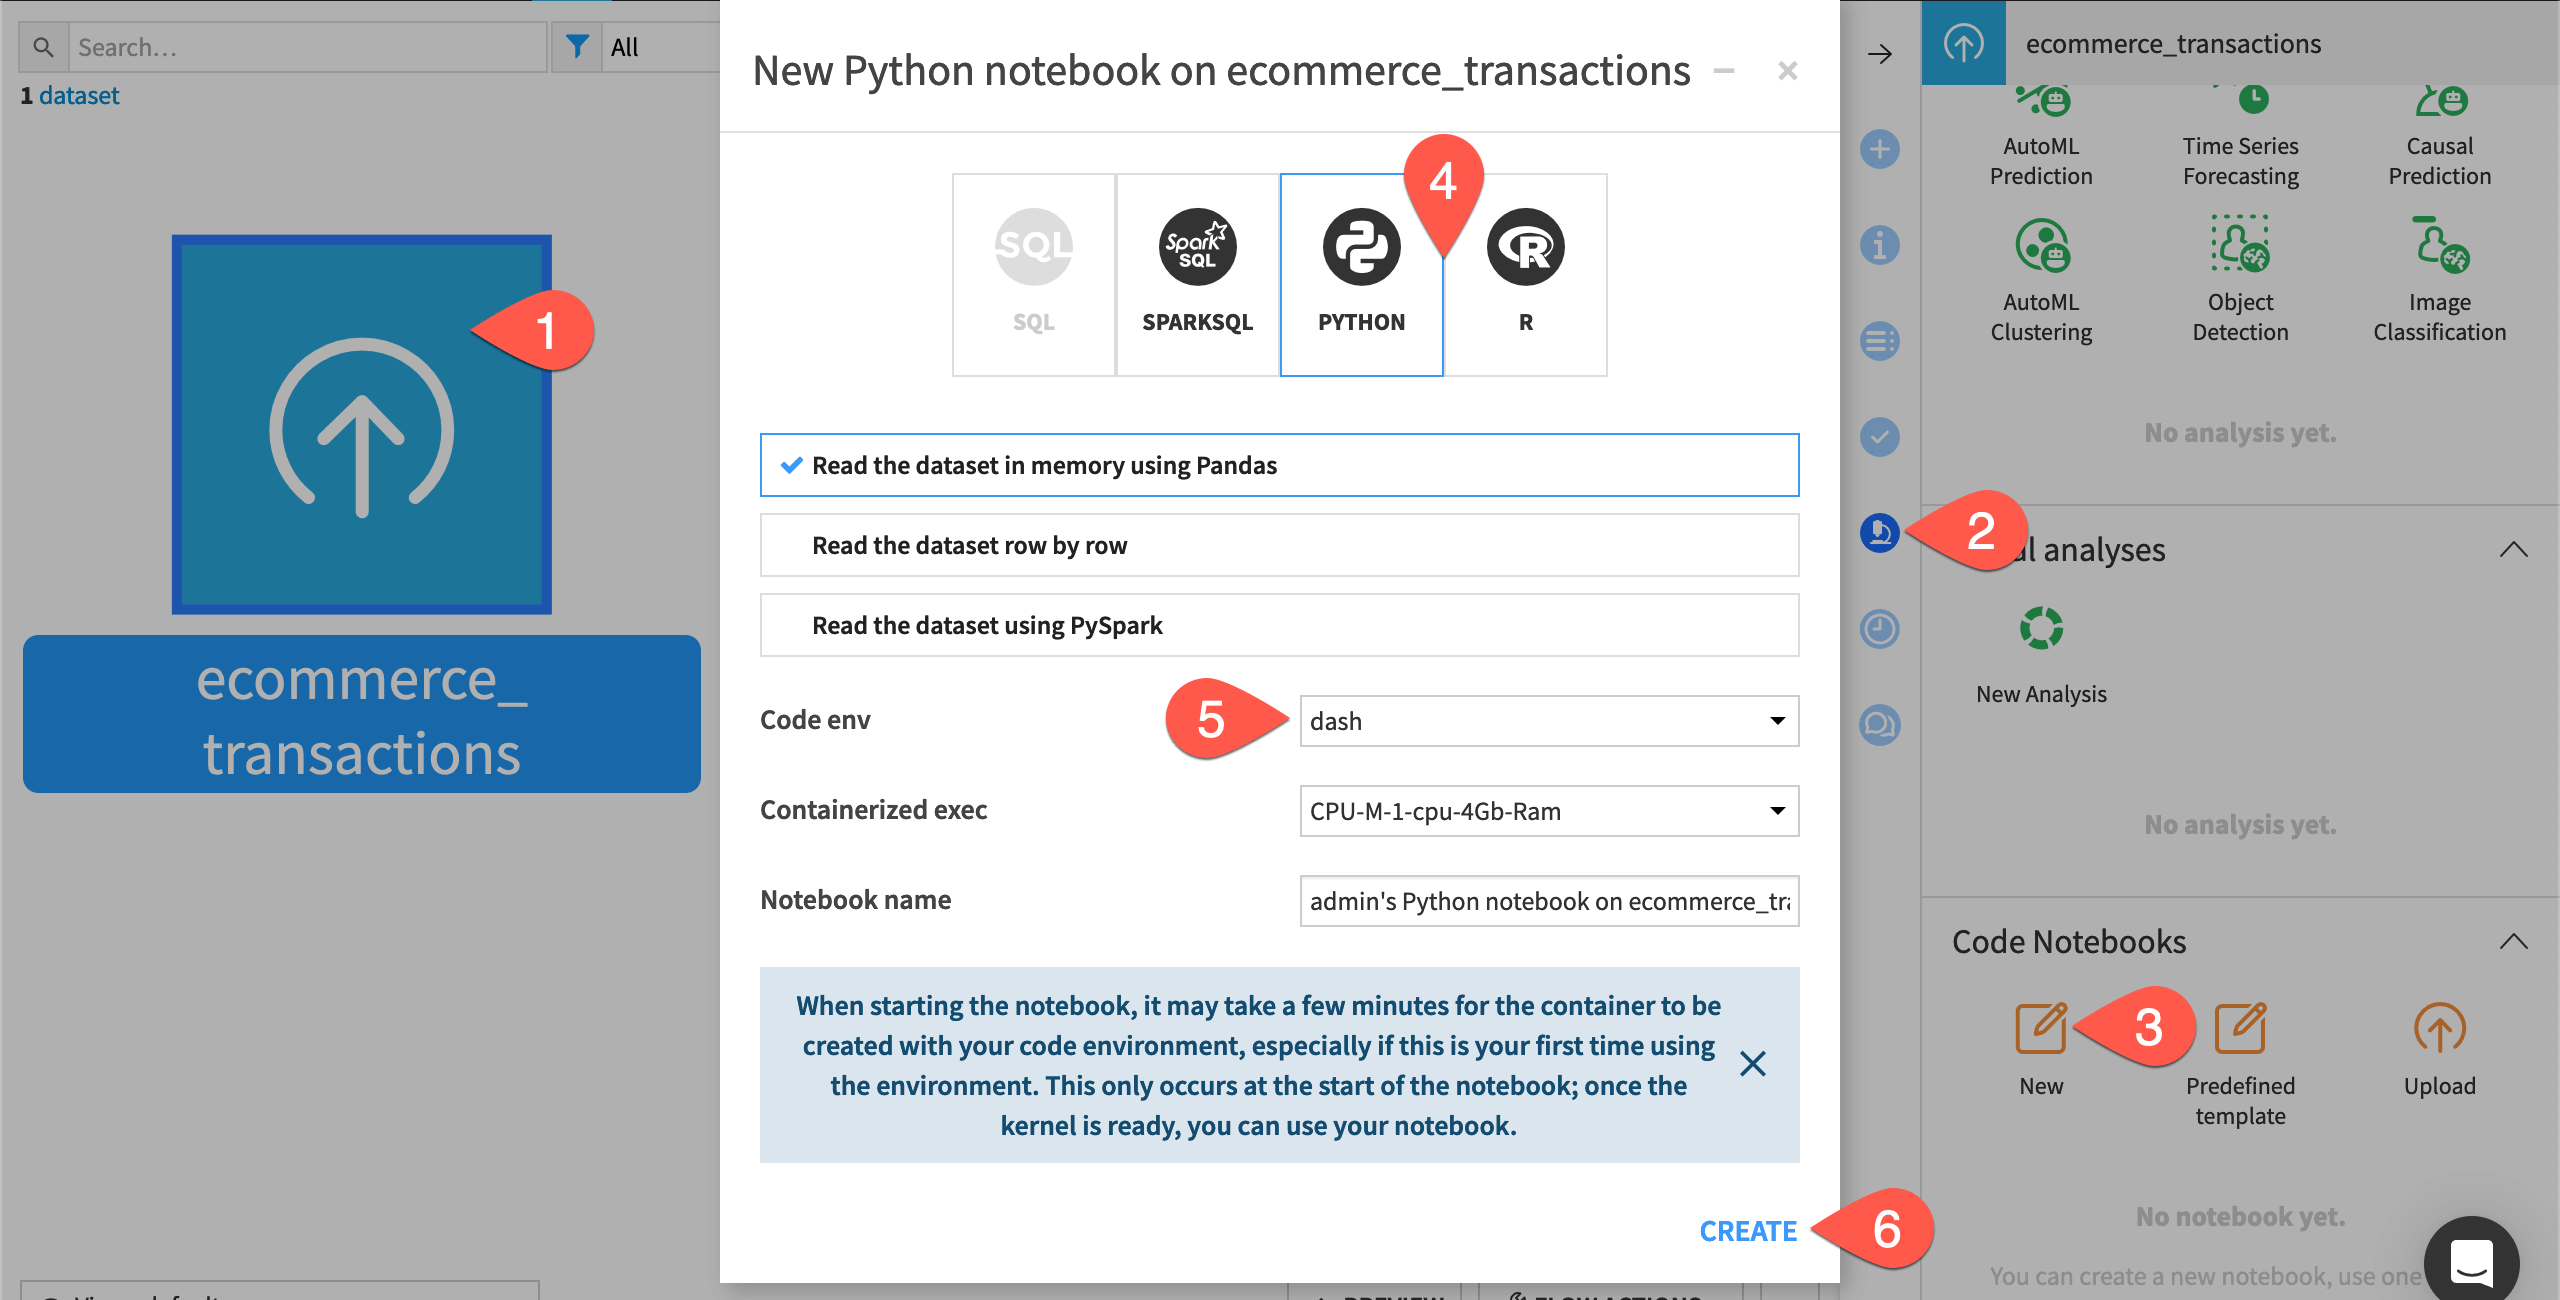
To create a static insight, you’ll start in a code notebook. As an example, you’ll use a dataset of transactions including a CustomerAge column.
From the Flow, select the ecommerce_transactions dataset.
From the Actions (
) tab, select the Lab (
).
Under Code Notebooks, select New.
In the dialog, select Python (or R if using ggplot2).
Ensure you have selected a compatible code environment.
Click Create.

Create a chart with a visualization library#
Having created a notebook from the ecommerce_transactions dataset, Dataiku has already provided starter code creating a pandas (or R) DataFrame object named df.
Regardless of which visualization library you prefer, the overall procedure is the same. We’ll provide examples using popular libraries. This tutorial also provides a generic example using altair to illustrate cases where there is no dedicated method for saving that particular type of insight.
Confirm the notebook’s kernel supports your visualization library.
Import the necessary libraries at the top of the notebook.
import matplotlib.pyplot as plt
library(ggplot2)
import altair as alt
import base64
Tip
The eventual HTML payload for the insight should be encoded in base64, which is why the base64 library is imported.
Beneath the code creating the
dfobject, add the code for the actual plot. Then execute the notebook to display a plot.fig = plt.figure() ax = fig.add_subplot(111) ax.hist(df['CustomerAge']) plt.show()
fig <- ggplot(df, aes(x = CustomerAge)) + geom_histogram()
print(fig)
df['CustomerAge_Binned'] = pd.cut(df['CustomerAge'], bins=20)
df['CustomerAge_Binned'] = df['CustomerAge_Binned'].astype(str)
hist_data = df.groupby('CustomerAge_Binned').size().reset_index(name='count')

fig = alt.Chart(hist_data).mark_bar().encode(
    alt.X("CustomerAge_Binned:N"),
    alt.Y('count:Q')
)
fig
Save the plot as an insight#
Once the plot displayed in your notebook satisfies you, the next step is to save it as an insight.
Those using Python need to add one more import statement. R users can skip this step.
from dataiku import insights
Beneath the code for the visualization, copy-paste and run the code below to save the plot as an insight.
insights.save_figure("matplotlib_insight", fig)
dkuSaveGgplotInsight("ggplot2_insight", fig)
Dataiku won’t have a dedicated
save_*function for every library you may want to use. In these cases, use the genericinsights.save_datato save your visualization as an HTML object (maintaining its interactivity) or as an image.fig_html = fig.to_html() fig_insight = base64.b64encode(fig_html.encode("utf-8")) insights.save_data("altair_insight", payload=fig_insight, content_type="text/html", label=None, encoding="base64")
Go to the Insights page (
g+i), and open the saved insight.
Publish an insight to a dashboard#
You have now saved an insight, but it’s often more useful to share it on a dashboard.
From the insight, open the Actions (
) tab.
Select Add insight.
If desired, adjust the default selection for the dashboard and slide, and click Pin.
Go to the Dashboards (
) page (
g+p), and open the chosen dashboard.From the dashboard, click Edit to be able to adjust the insight’s size and position as needed.
Tip
The Export notebook step in a scenario can automate rebuilding static insights.
Next steps#
Using static insights in Dataiku, you have created, saved, and published custom visualizations.
To learn more about creating static insights with Python and R libraries, visit:
The Developer Guide for the Python static insights concept and API reference, where you’ll find examples for additional libraries like bokeh and plotly.
The reference documentation for the R static insights API, where, in addition to ggplot2, you’ll also find examples for dygraphs, ggvis, and googleVis.

