
Tutorial | Deploy a project bundle to a production environment#
Get started#
When you finish designing a project, it’s time to push it into production! As opposed to real-time scoring, let’s implement a batch processing production framework.
Objectives#
In this tutorial, you will:
Create a bundle in a project on a Design node.
Deploy the bundle to an Automation node using the Project Deployer.
Manage bundle versions between Design and Automation nodes.
Monitor the project’s status on the Deployer.
Prerequisites#
Dataiku 12.6 or later for importing the tutorial project.
An Automation node connected to the Design node.
Dataiku Cloud users can follow instructions for adding the Automation node extension.
Administrators of self-managed Dataiku instances should follow the reference documentation on Production deployments and bundles.
Caution
Free trial and free edition users won’t be able to meet this requirement.
The permission to create and deploy project bundles.
Dataiku Cloud users require group membership in the designers and/or project-deployer group.
Self-managed users require the Write project content permission on the project used in this tutorial.
Intermediate knowledge of Dataiku (recommended courses in the Advanced Designer learning path or equivalent).
Create the project#
From the Dataiku Design homepage, click + New Project.
Select Learning projects.
Search for and select Project Deployment.
If needed, change the folder into which the project will be installed, and click Create.
From the project homepage, click Go to Flow (or type
g+f).
Note
You can also download the starter project from this website and import it as a ZIP file.
Use case summary#
The project has three data sources:
Dataset |
Description |
|---|---|
tx |
Each row is a unique credit card transaction with information such as the card that was used and the merchant where the transaction was made. It also indicates whether the transaction has either been:
|
merchants |
Each row is a unique merchant with information such as the merchant’s location and category. |
cards |
Each row is a unique credit card ID with information such as the card’s activation month or the cardholder’s FICO score (a common measure of creditworthiness in the US). |
Run the failing scenario on the Design node#
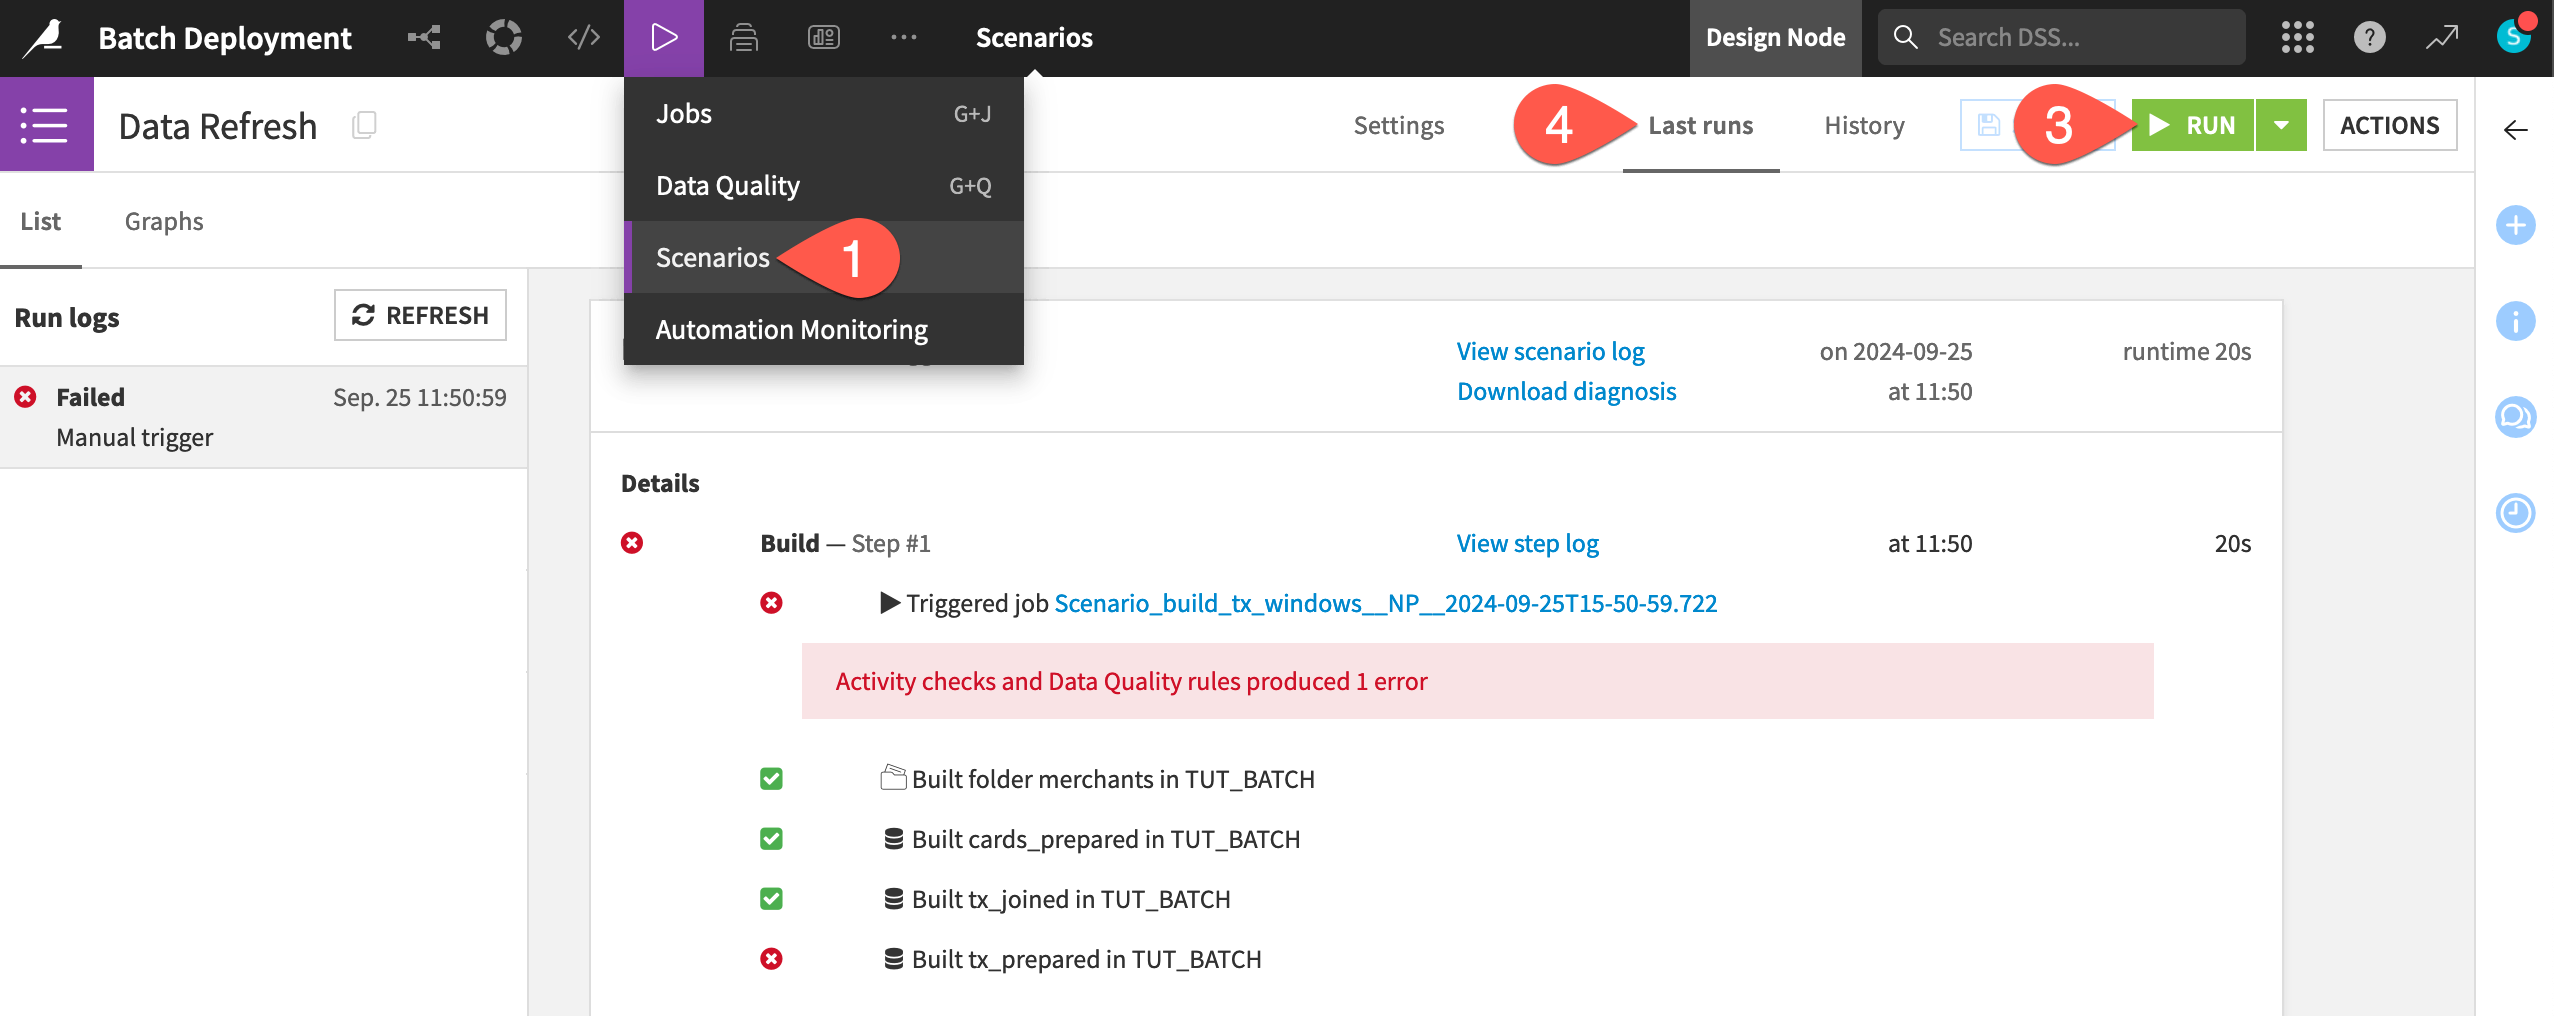
The existing Data Refresh scenario found in the project automates the build of the tx_windows dataset. However, it’s currently failing because of a data quality rule on the tx_prepared dataset.
From the Jobs (
 ) menu in the top navigation bar, go to the Scenarios page.
Open the Data Refresh scenario.
Click Run to manually trigger it.
Go to the Last Runs tab to confirm the scenario run failed.
Normally you’d want to fix a failing scenario before deploying the project into production. In this case though, the error will be instructive. Let’s move the project into production!
Create a bundle and publish it to the Deployer#
See a screencast covering this section’s steps.

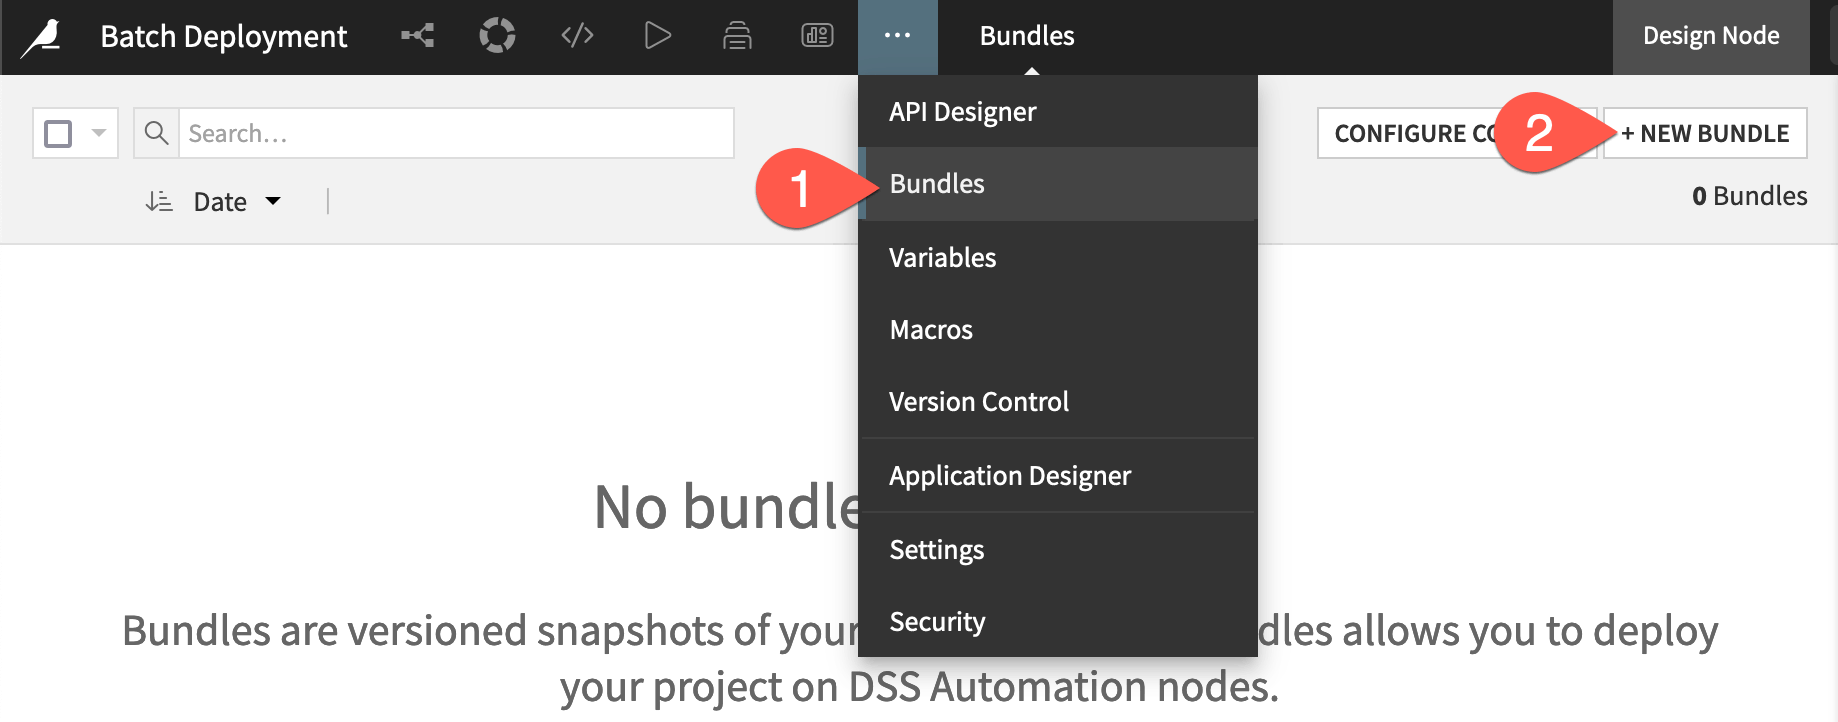
The first step is to create a bundle from the project found in the Design node (the development environment).
From the More Options (
 ) menu in the top navigation bar, choose Bundles.
Click + New Bundle.
Add additional content to the bundle#
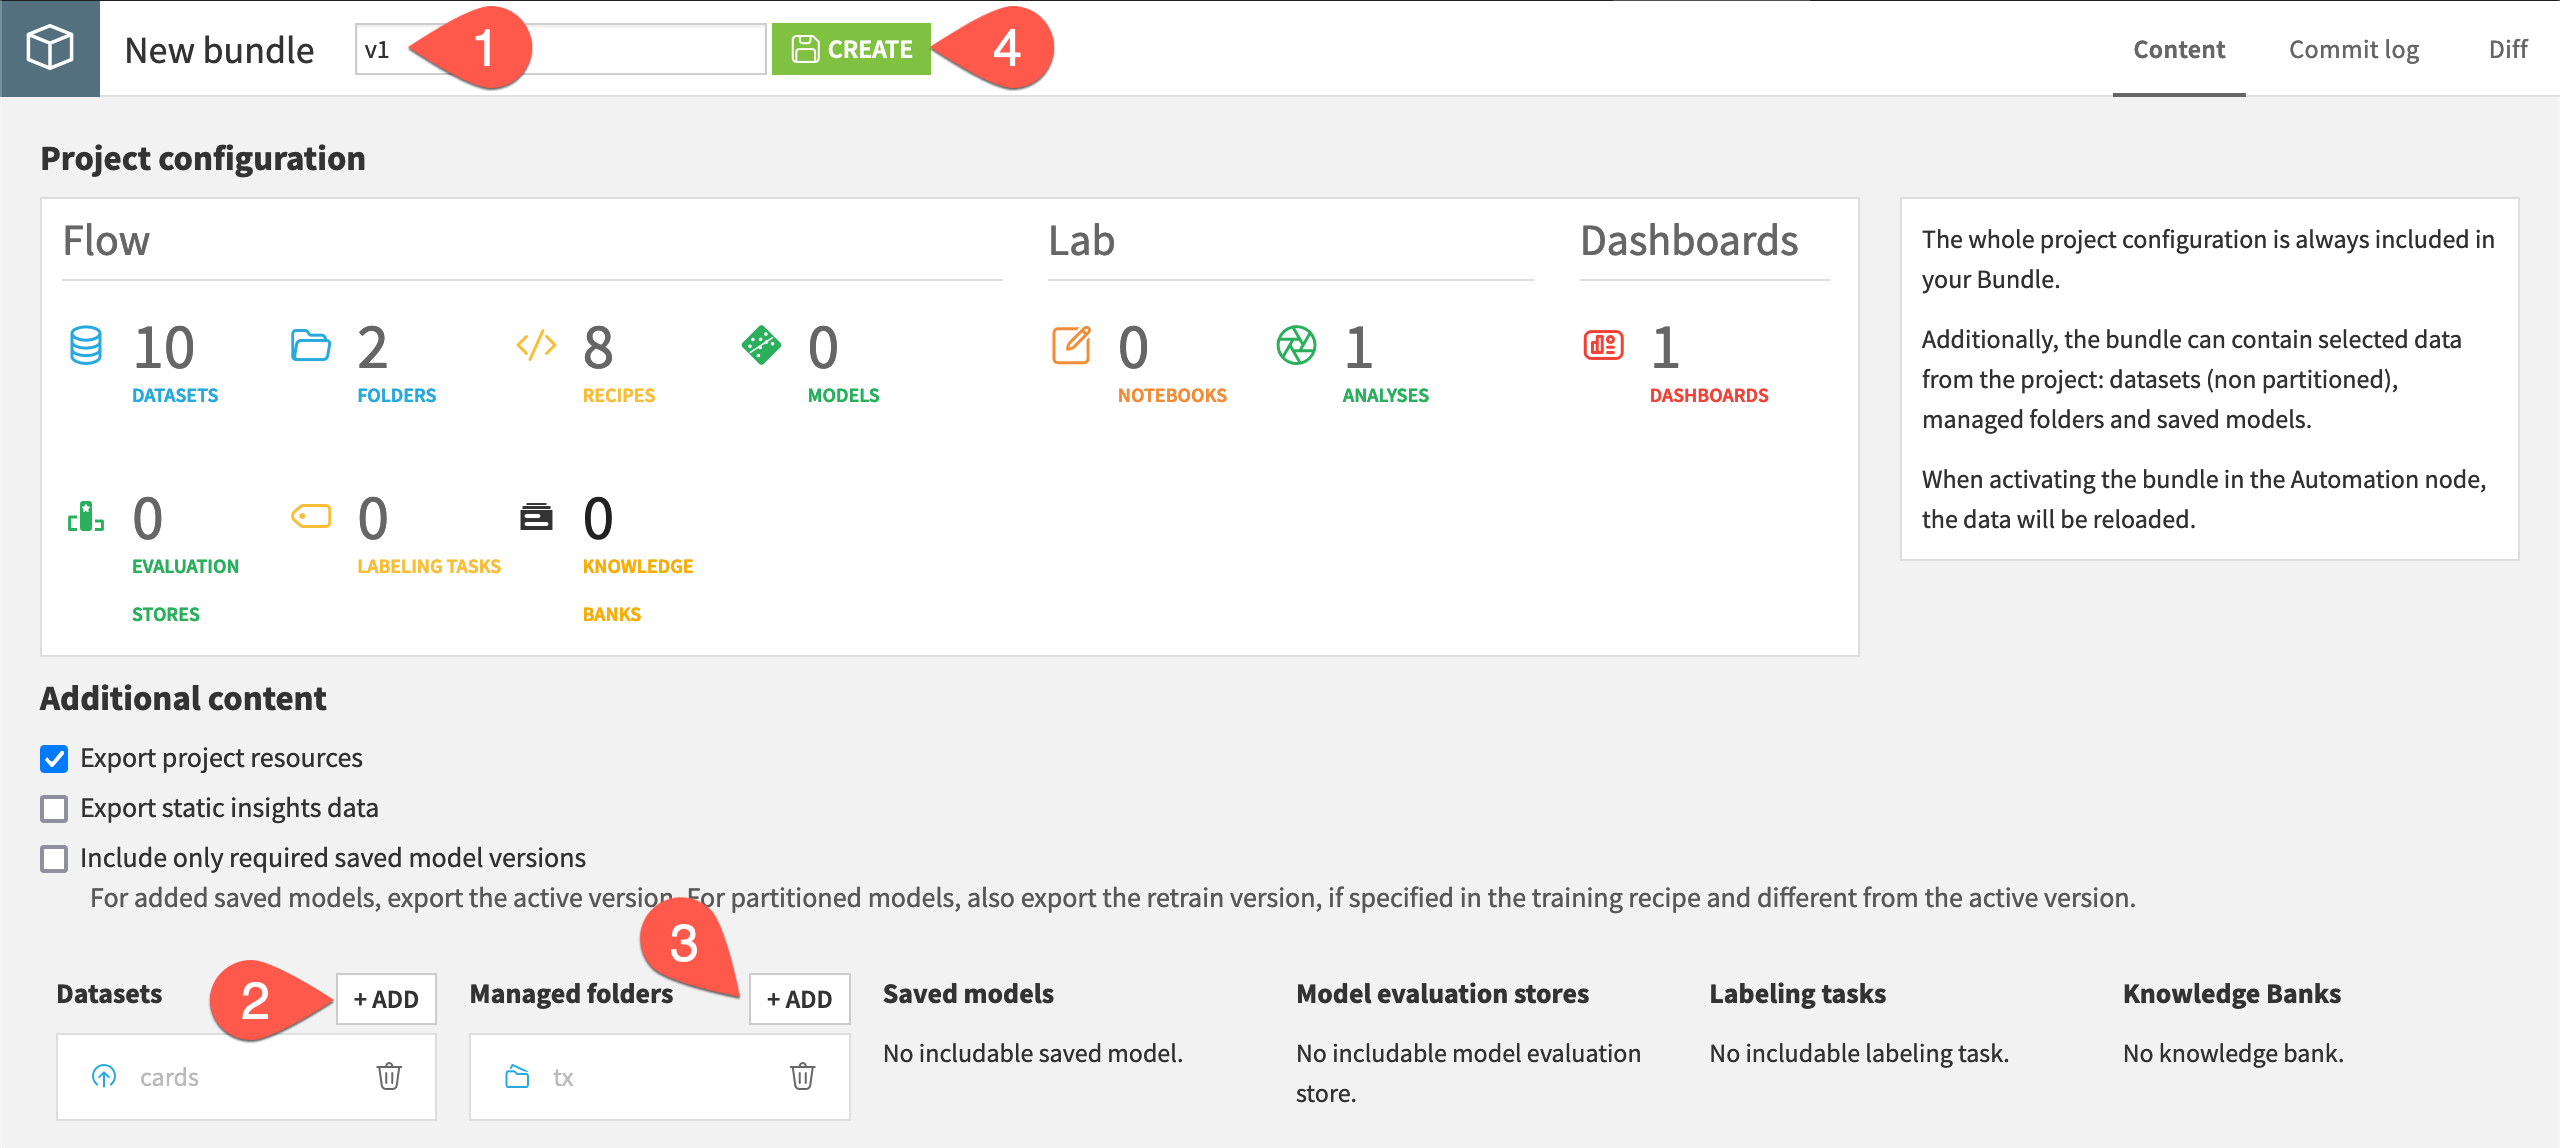
A bundle acts as a consistent packaging of a complete Flow. By default, it includes only the project metadata. As a result, all datasets will come empty, and models will come untrained. However, depending on the use case, you can choose to include additional content such as datasets, managed folders, and saved models.
Unlike in most real-life projects that would connect to some kind of database or cloud storage, the initial datasets here are uploaded files and managed folders. Therefore, they won’t be re-computed from production sources. To access these files in the production environment, you’ll also need to include them in the bundle.
Provide the bundle ID
v1.In the Additional content section, to the right of Datasets, click + Add. Choose cards.
To the right of Managed folders, click + Add. Choose tx.
Click Create.
Important
Unlike tx and cards, the starting merchants dataset originates from a Download recipe, and hence Dataiku is able to recompute it in the production environment.
If the project included a saved model that you wanted to use for batch scoring (or real-time inference), you’d also need to include it in the bundle.
Publish the bundle to the Deployer#
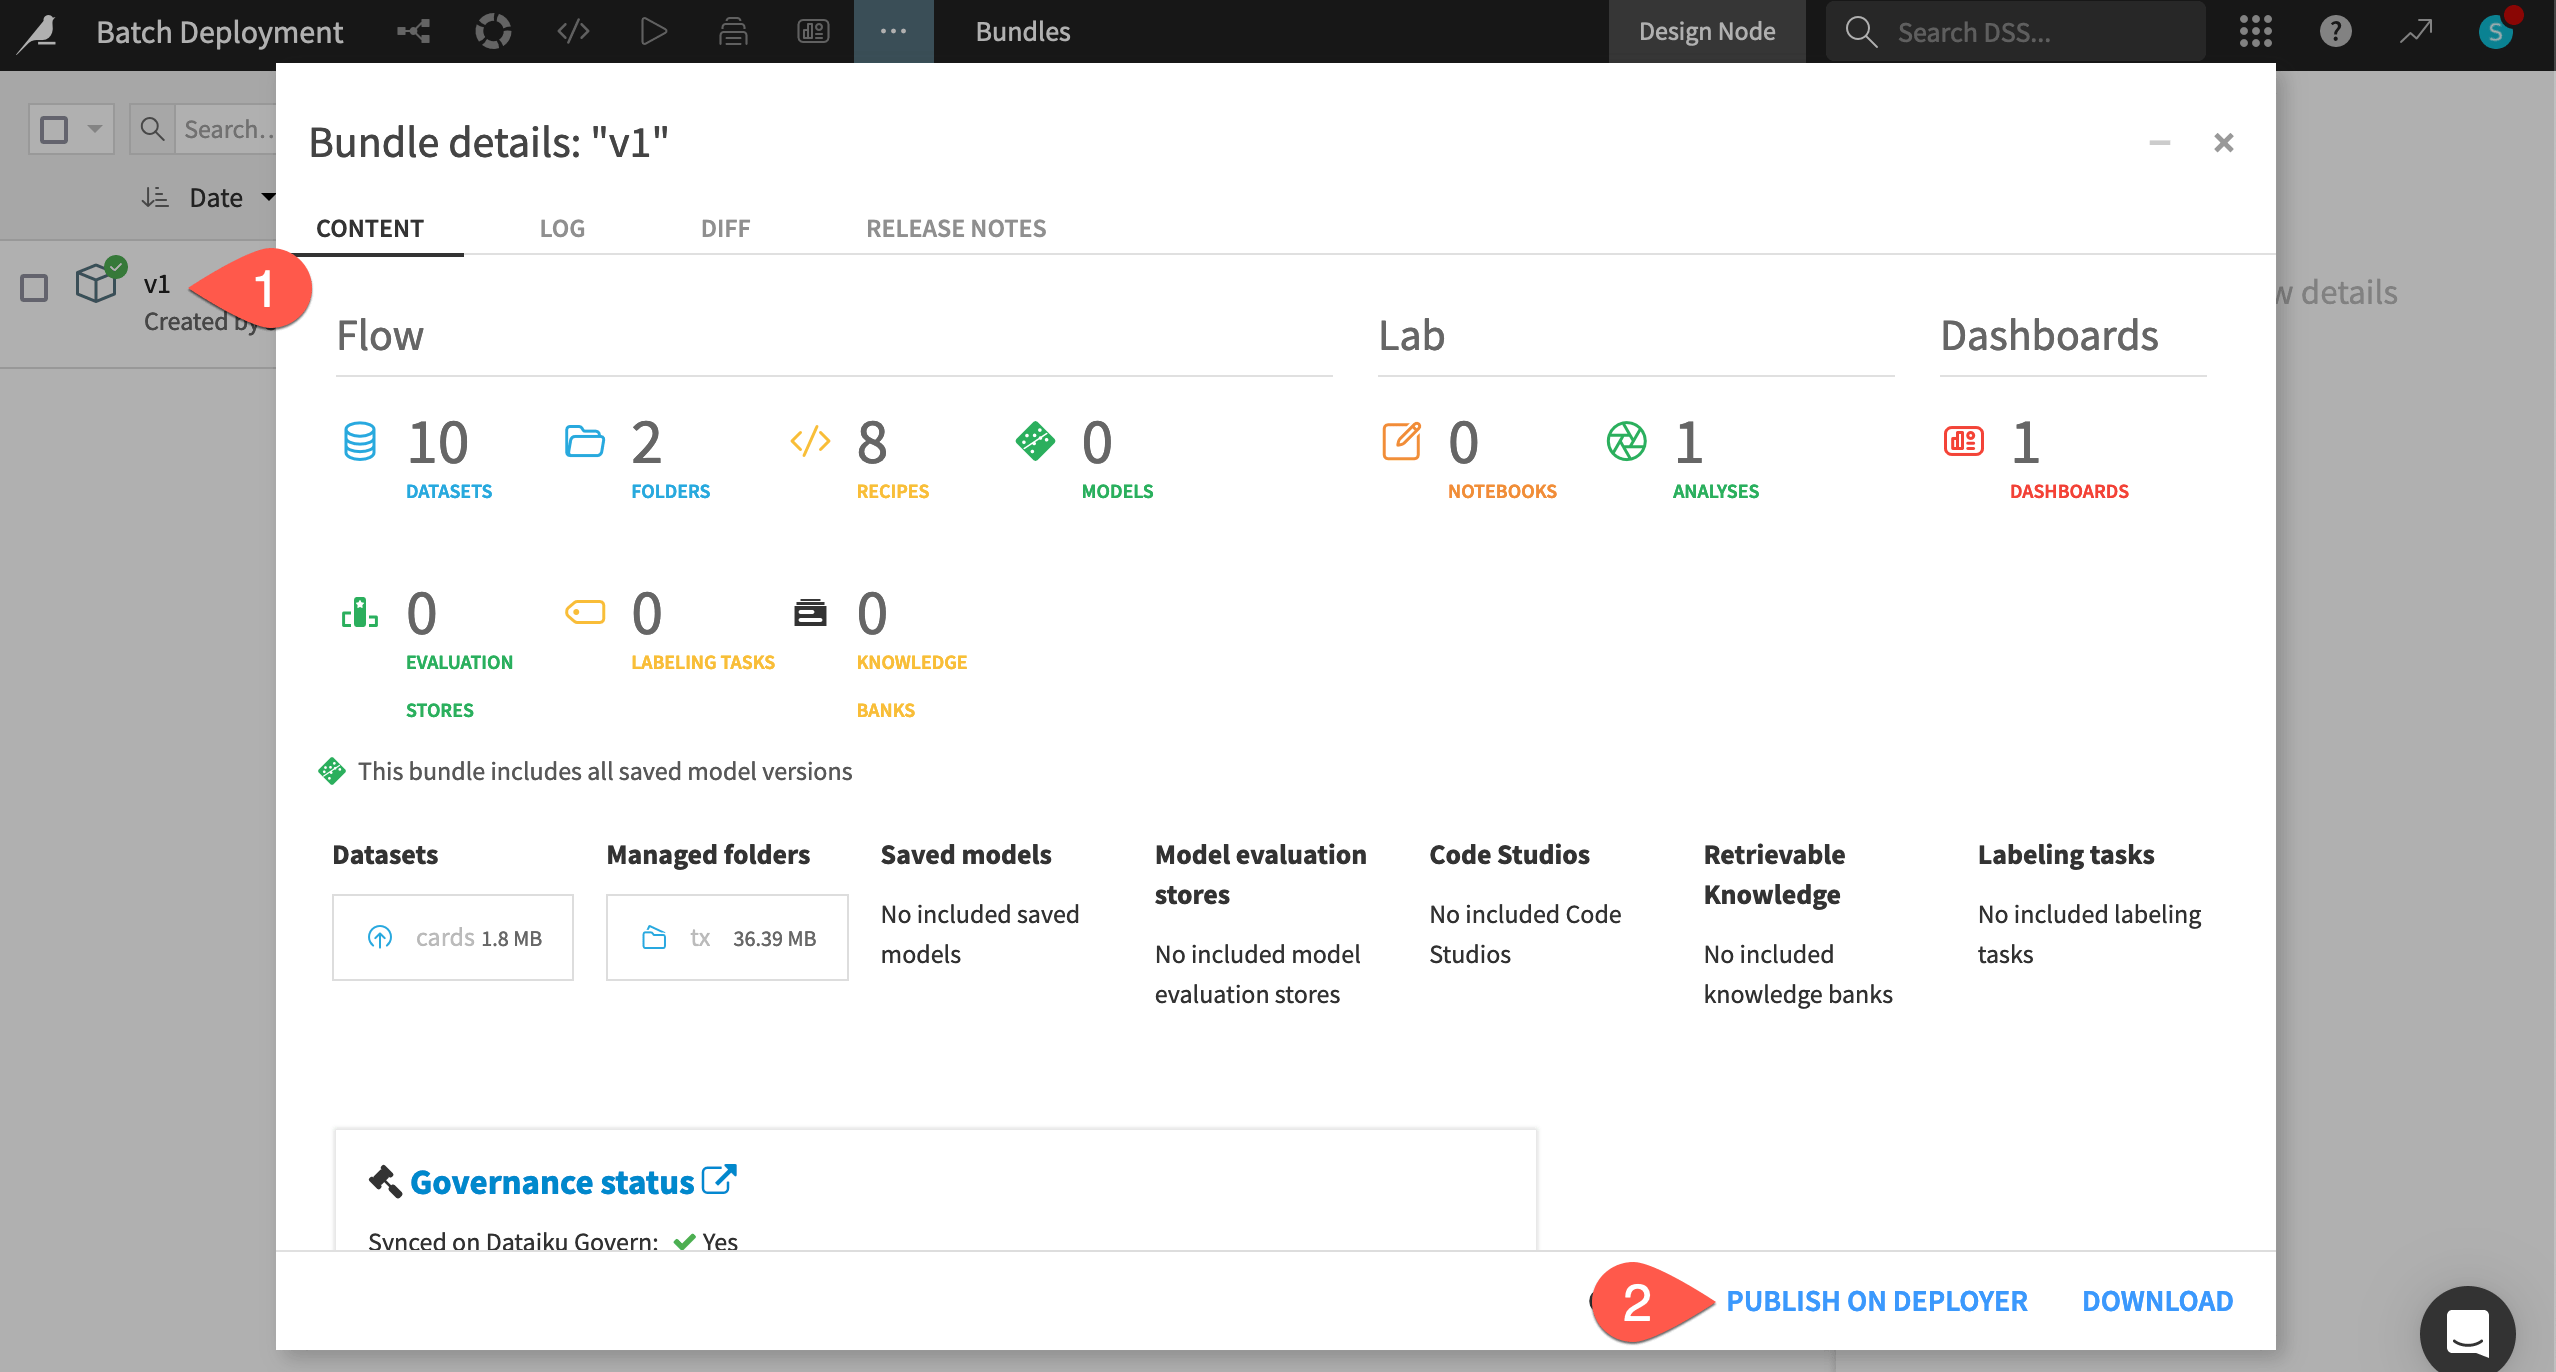
The project on the Design node now includes a bundle. You could download this file and manually upload it to the Automation node. However, the strongly preferred method is to use the Project Deployer because it centralizes the history of all deployments.
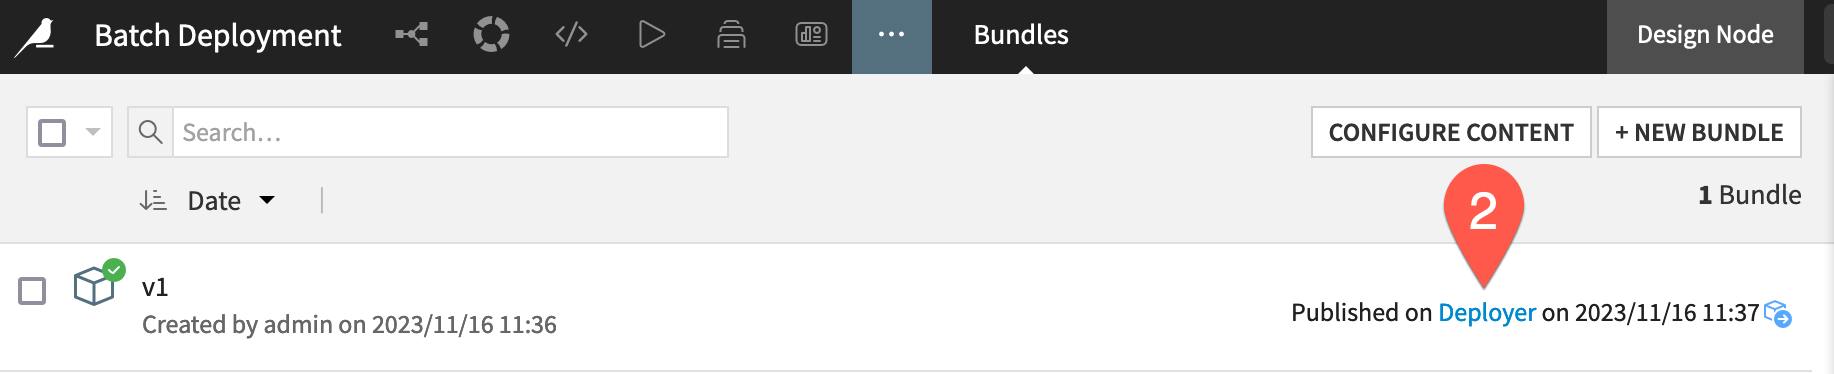
From the Bundles page of the Design node project, select the v1 bundle.
Click Publish on Deployer, and then again confirm the same.
Instead of immediately opening the Deployer, click Done for now.
Tip
If you don’t have the ability to Publish on Deployer, return to the prerequisites for instructions on connecting your Design node to an Automation node.
Create and manage deployments#
Until now, the Design node may have been your only experience with Dataiku. However, as an end-to-end platform, Dataiku includes other nodes (Automation, API, Govern) for production-oriented tasks.
Explore the Deployer#
Before actually deploying the bundle to the Automation node, look at how the Deployer, and in particular, the Project Deployer, fits into this process.
First, there are two modes for installing the Deployer:
One is a local Deployer that sits on top of either the Design or Automation node and requires no further setup. Dataiku Cloud employs this option.
The other is a standalone or remote Deployer for infrastructures with multiple Design and/or Automation nodes.
Regardless of which setup your instance uses, the process for using the Project Deployer is the same.
If you are using a remote Deployer, make sure you’re connected to this instance. You’ll need credentials from your instance administrator.
For either setup, from the bundle details page on the Design node, click Deployer where the publishing timestamp is present.
Tip
You can also navigate to the Deployer by choosing Local/Remote Deployer in the waffle (![]() ) menu from the top navigation bar.
) menu from the top navigation bar.
Although you’ve published a bundle to the Deployer, you don’t yet have an actual deployment. Before creating a new deployment, take a moment to explore the Deployer. If you are using a remote Deployer, note the change in the instance URL.
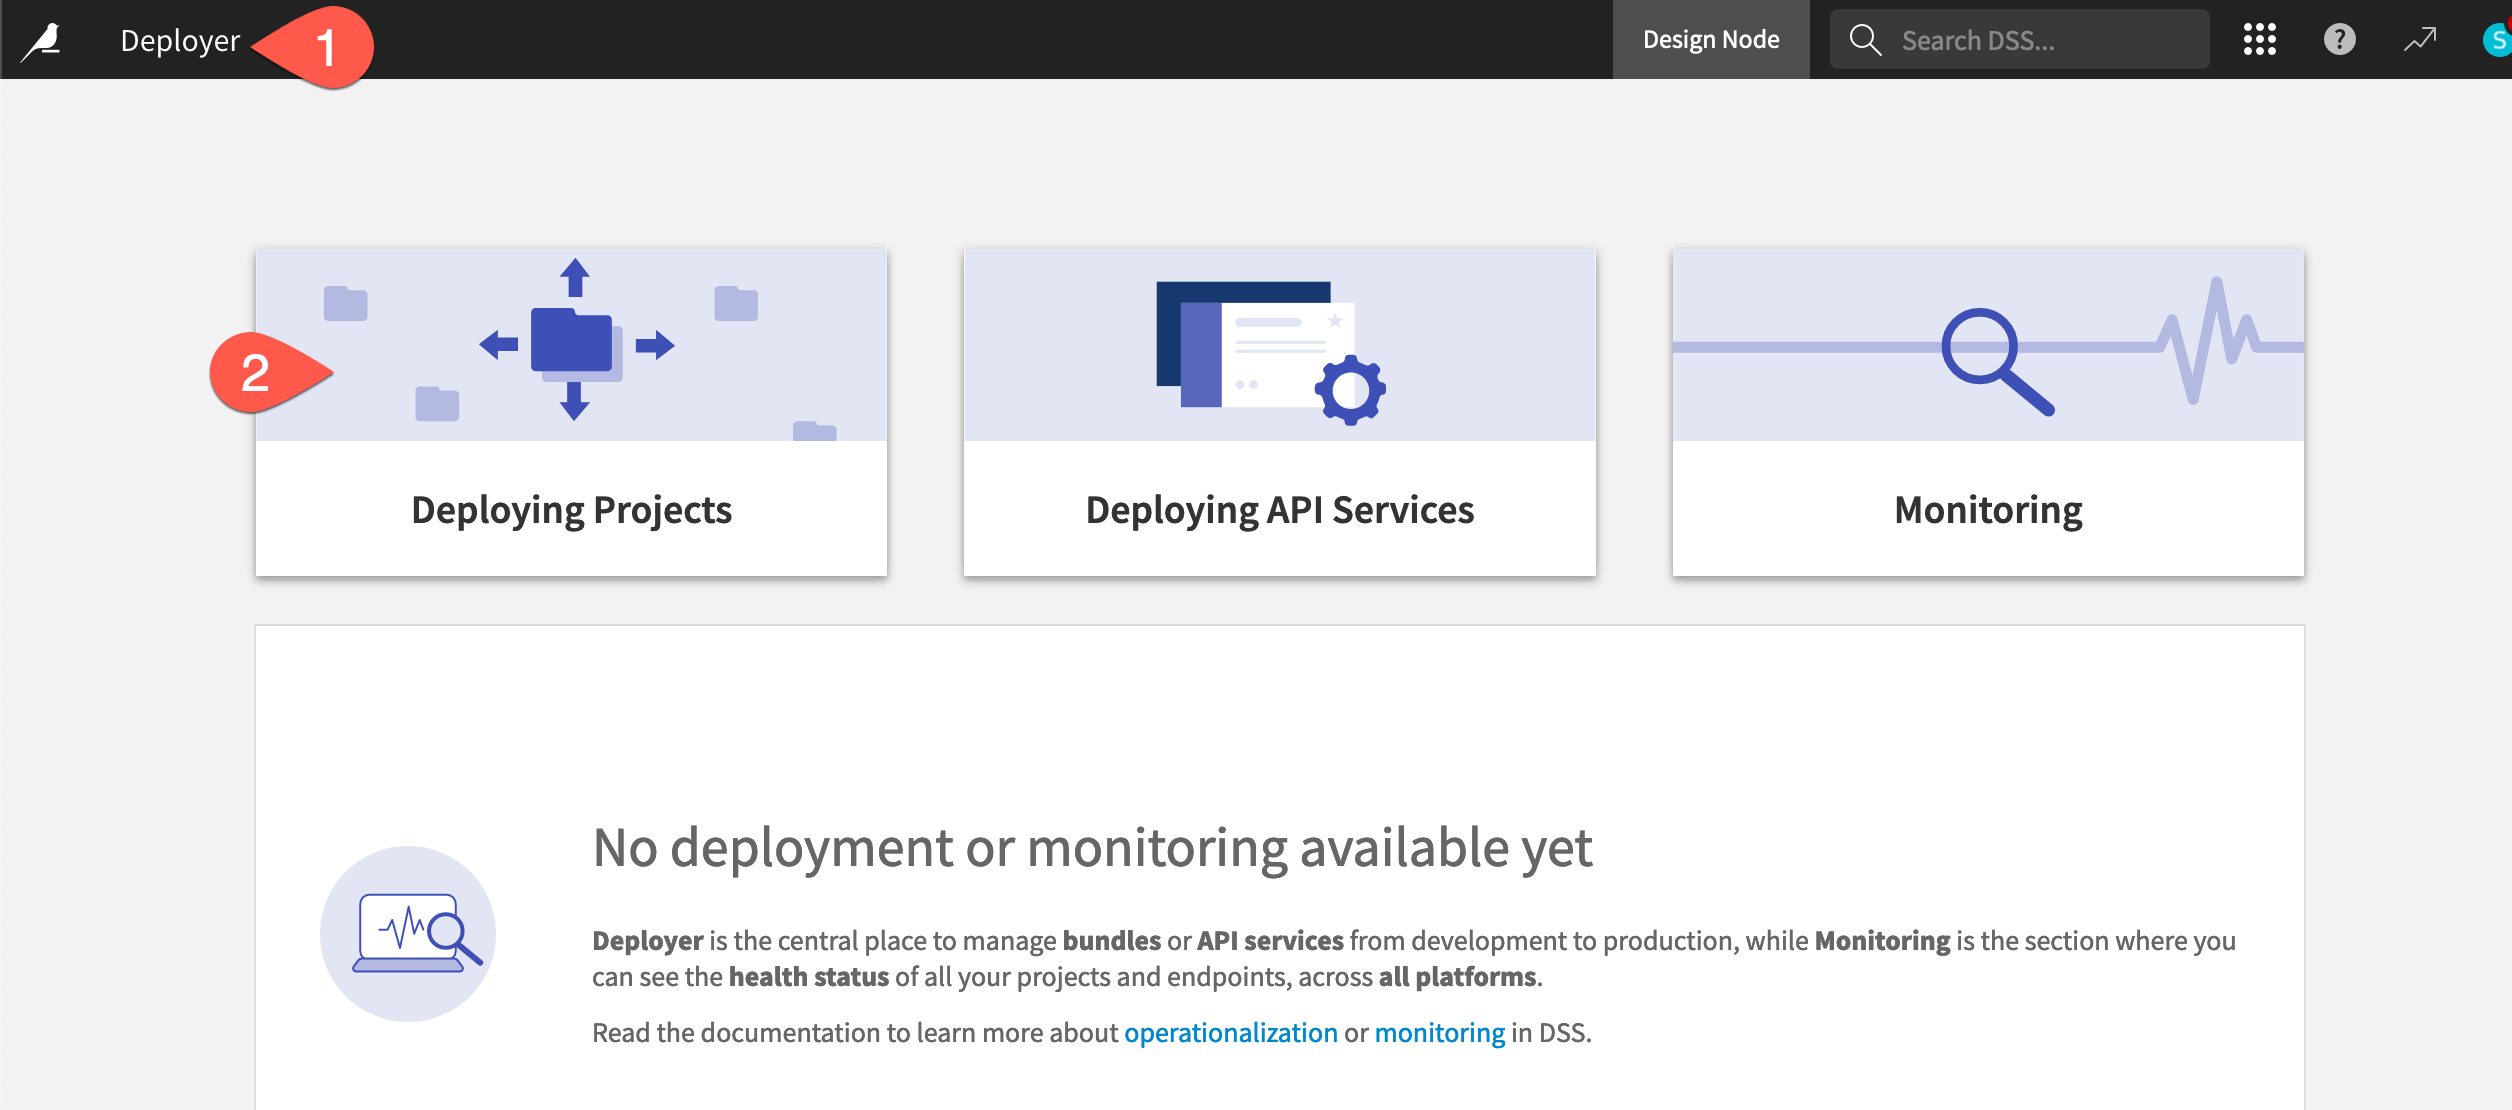
From the Project Deployer, click Deployer at the top left corner to see how this node has separate components for deploying projects, deploying API services, and monitoring.
Click on Deploying Projects to view current deployments, projects that have published bundles, and available infrastructures.
Tip
The Deployer for your instance might already have projects and/or API services belonging to colleagues and other teams!
Create a new deployment#
Thus far, you’ve published a bundle from the Design node to the Project Deployer. To create an active deployment, you still need to push the bundle from the Project Deployer to an Automation node.
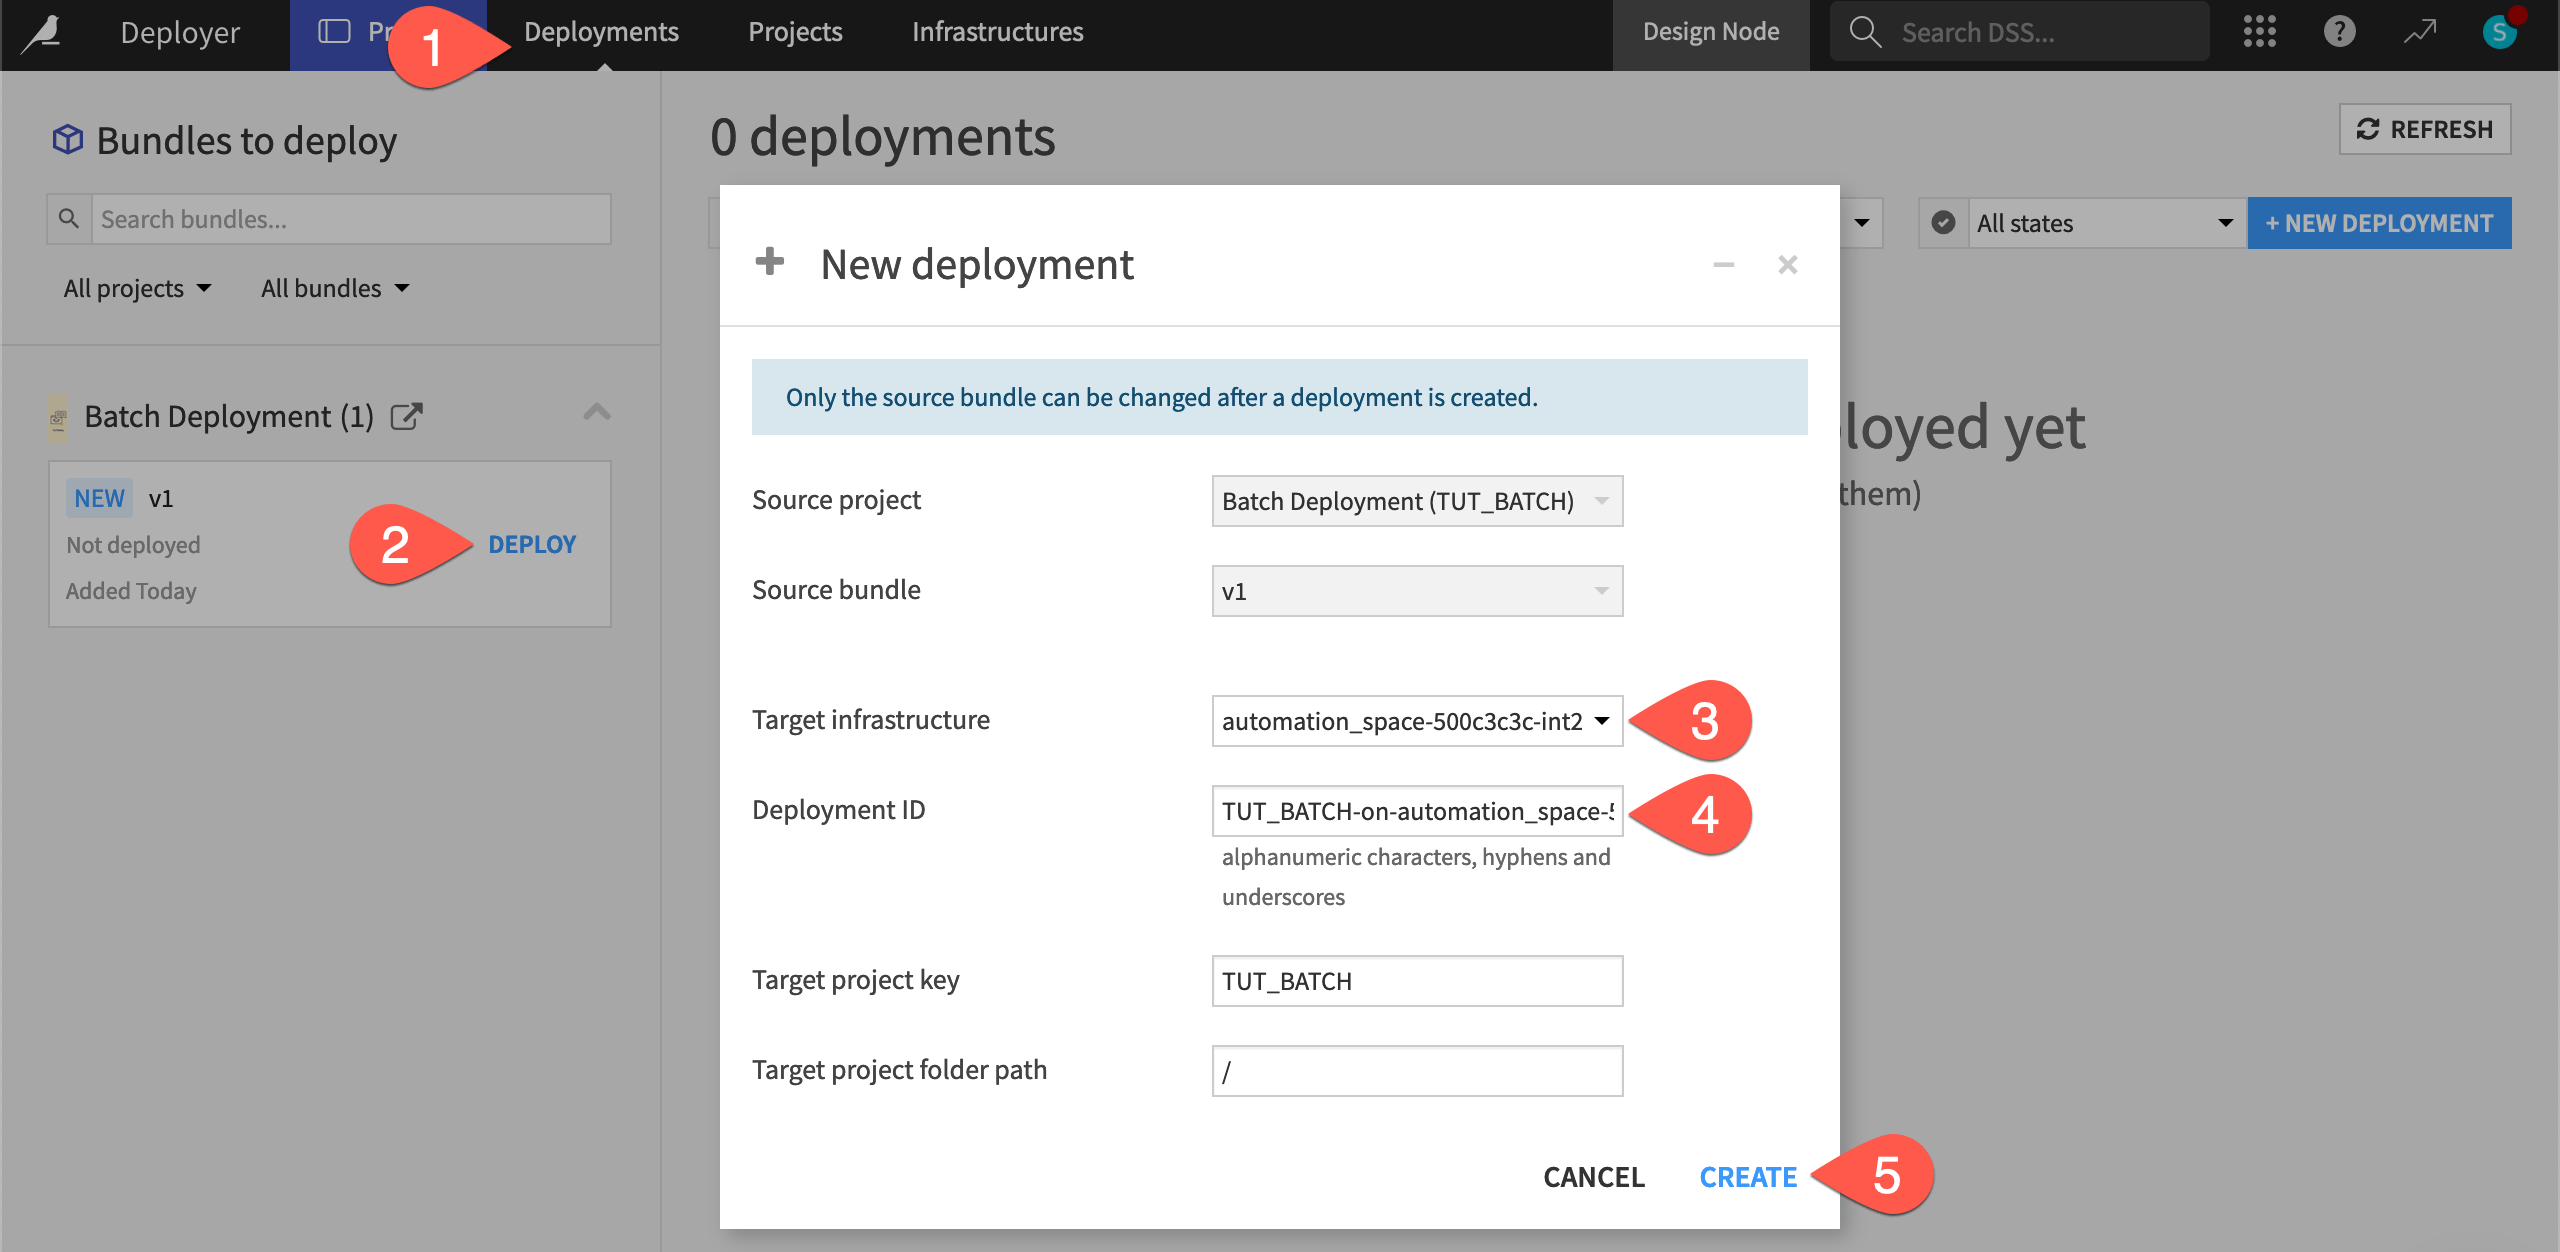
If not already there, click Deployments in the top navigation bar of the Project Deployer to view all project deployments on the instance.
In the Bundles to deploy panel, find the v1 bundle for your project, and click Deploy.
Caution
If the Deploy button isn’t clickable, it means there is no infrastructure ready for deployment. Dataiku Cloud users need to add the Automation node extension. Self-managed users should have their instance admins consult the reference documentation on Deployment infrastructures.
Choose a Target infrastructure. This will vary depending on the infrastructure available to your organization.
Leave the default Deployment ID, which takes the form of
<PROJECTKEY>-on-<infrastructure>.Click Create.
Click Deploy and Activate.
Important
Just as when importing a project ZIP file to a Dataiku instance, you may see warnings about missing plugins or plugin version mismatches. If the project at hand uses any of these plugins, you’ll want to review them. The same is true for missing connections. See Concept | Automation node preparation for more details.
Manage deployment settings#
Your bundle is now running on the Automation node! You can find a link to it within the deployment’s Status tab. Before doing so though, it’s helpful to understand what deployment settings you can control from the Project Deployer itself.
Within the Project Deployer, you can monitor the status of deployments, such as:
Who created it (and when).
Who last updated it (and when).
Recent scenario runs.
See also
The reference documentation also covers how to modify deployment settings from the Project Deployer.
Remap connections#
In the Settings tab of a deployment, you can configure criteria around variables, connections, code environments, and scenarios.
Connection remapping, for example, is one setting that you will commonly need to configure. Organizations often maintain different databases for development and production environments. If this is the case, you’ll need to remap the source connections used on the Design node to the target connections needed on the Automation node.
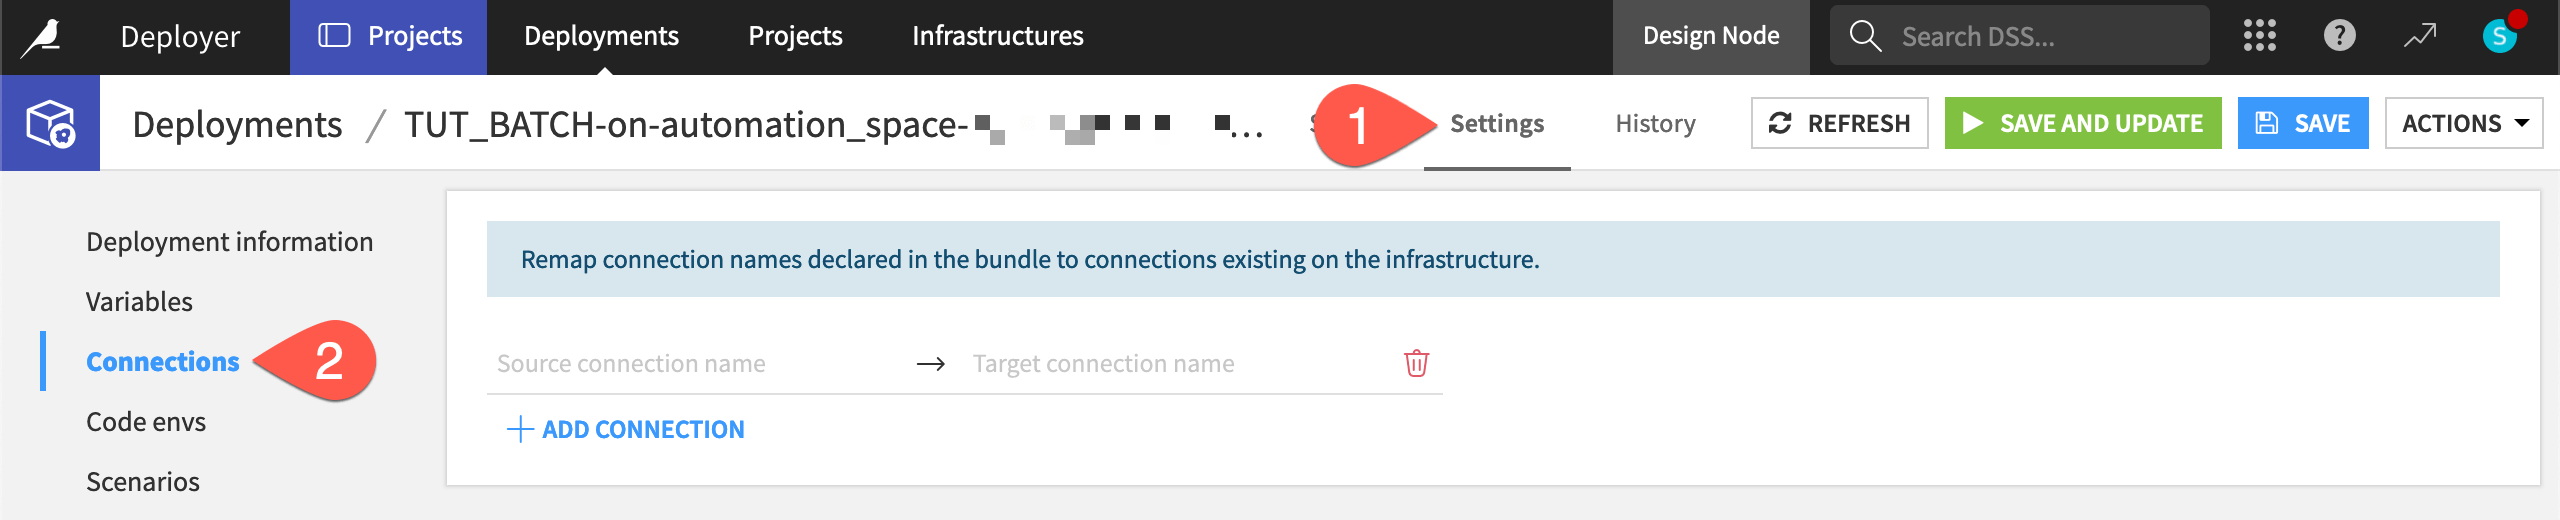
Within the new deployment, navigate to the Settings tab.
Navigate to the Connections panel.
Tip
Assuming you are using the same data sources for development and production environments for this tutorial, you don’t need to perform any action.
Manage scenario auto-triggers#
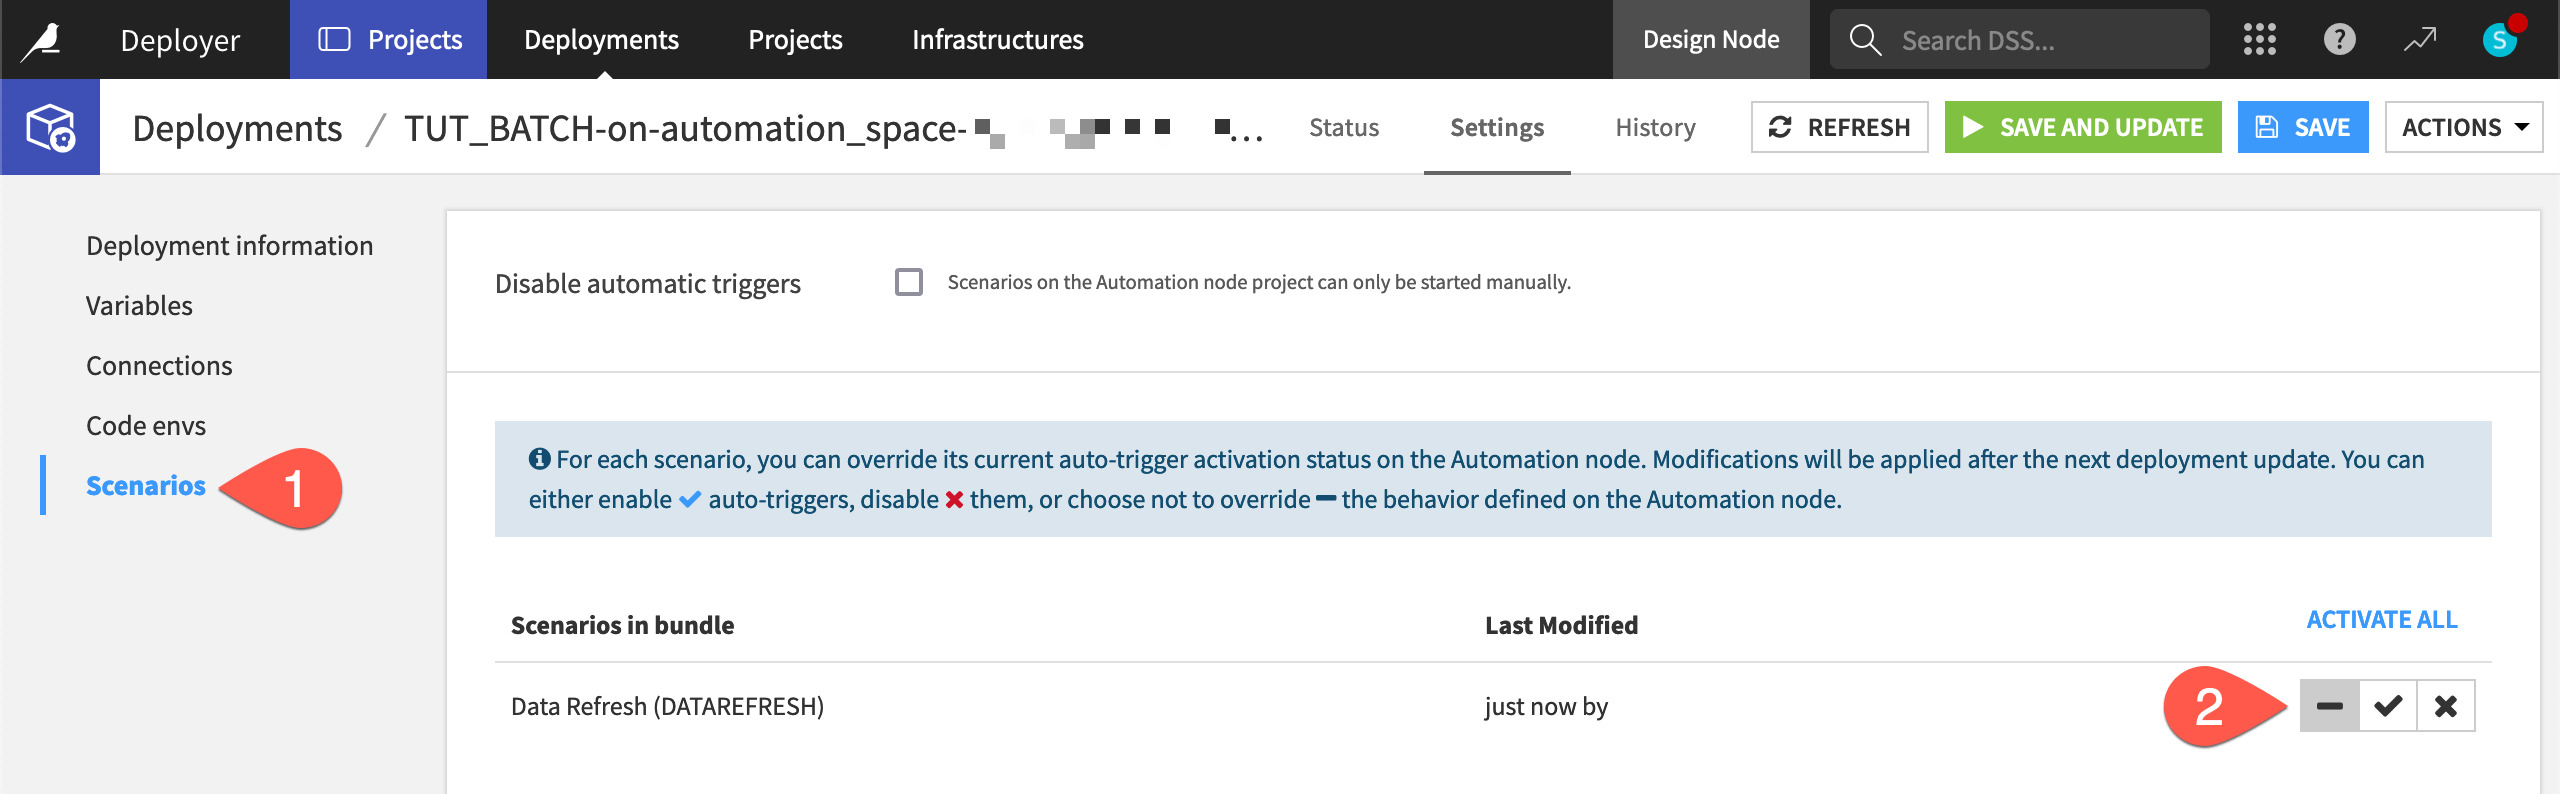
To ensure scenarios never run by accident, the Deployer deactivates all scenarios in a new deployment by default. It does this regardless of the scenario’s settings on the Design node.
Remaining within the Settings tab of the deployment, navigate to the Scenarios panel.
Here you can enable, disable, or even override the behavior defined on the Automation node. This gives you control over how you want to manage the scenarios for a deployed project.
Leave the default setting (marked by a hyphen) that doesn’t override the behavior defined on the Automation node.
Activate the scenario on the Automation node project#
Finally, check out the project on the Automation node.
Ensure you’re connected to a running Automation node.
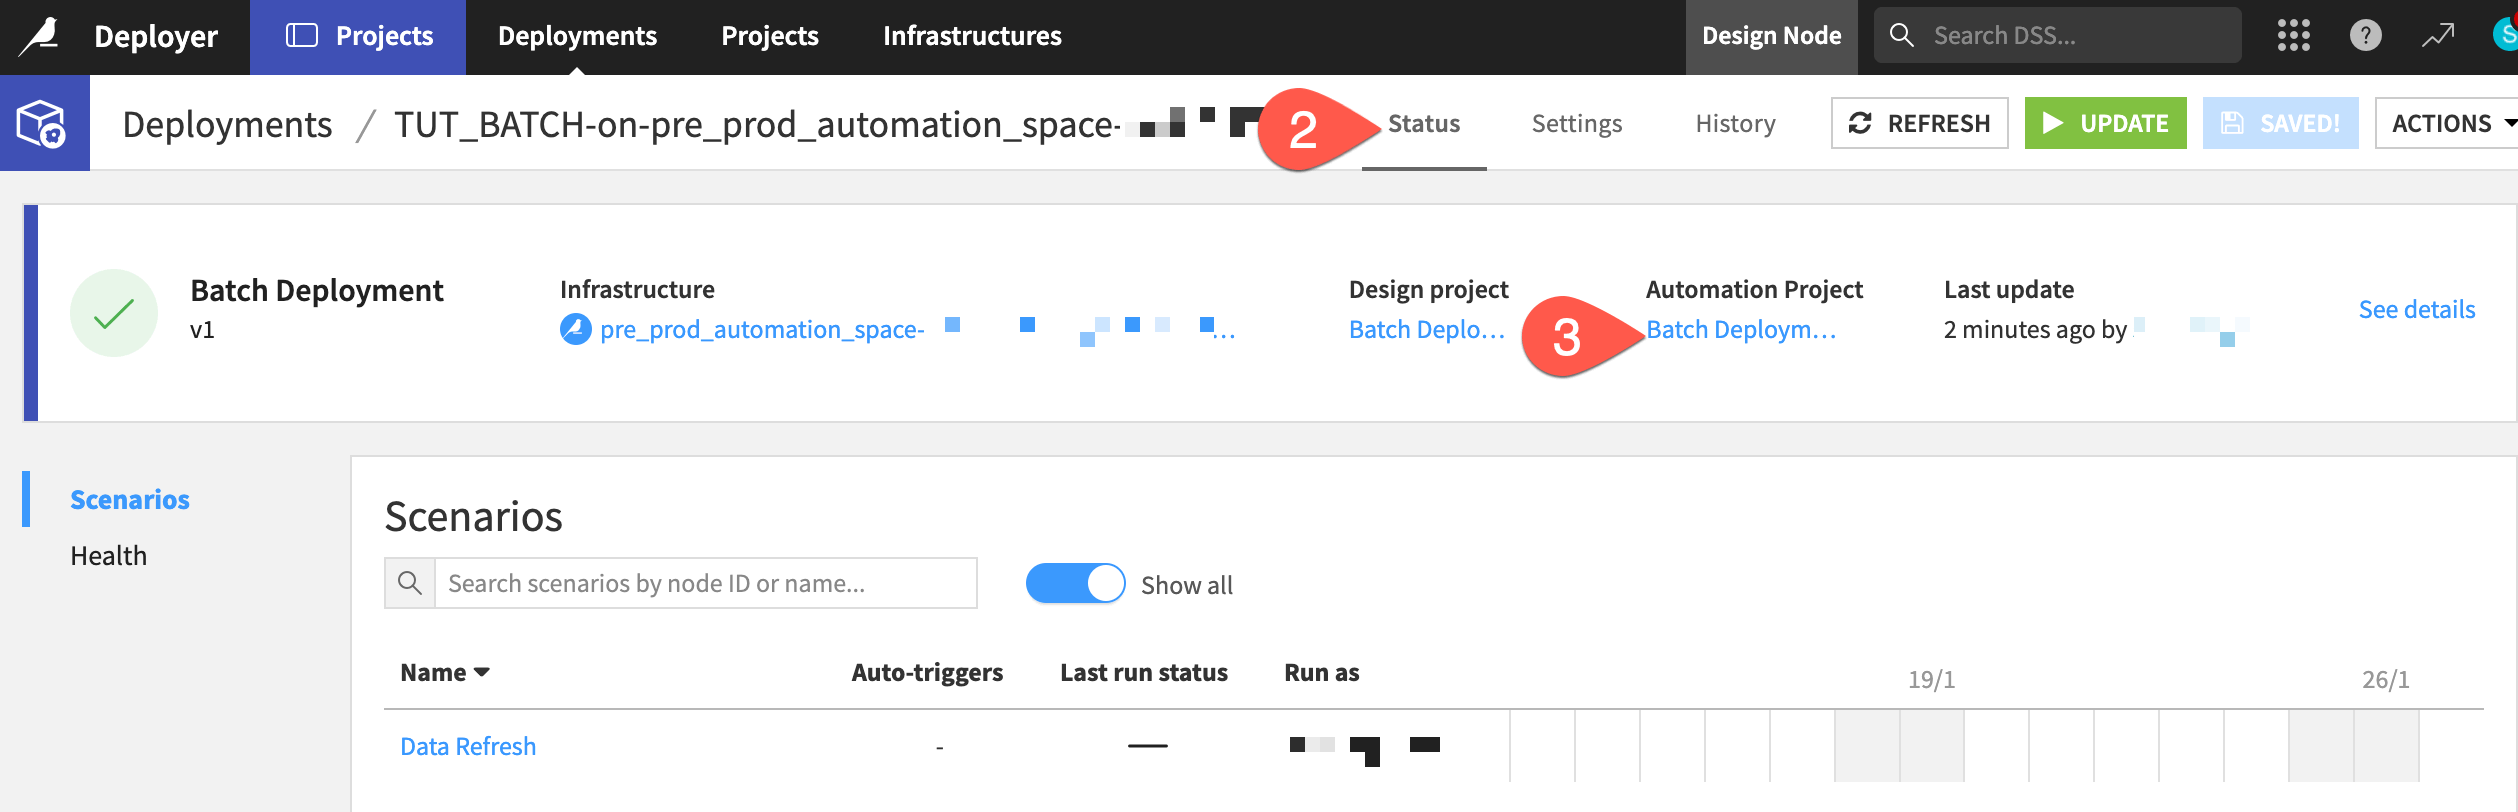
Navigate back to the Status tab of the deployment.
Click to open the Automation project.
Tip
Keep your Design, Deployer, and Automation nodes open in separate browser tabs!
Once on the Automation node, the project should look familiar. Confirm a few points:
The project homepage reports what bundle is running and when it was activated.
The scenario isn’t yet active.
Next, activate the scenario in the Automation node project!
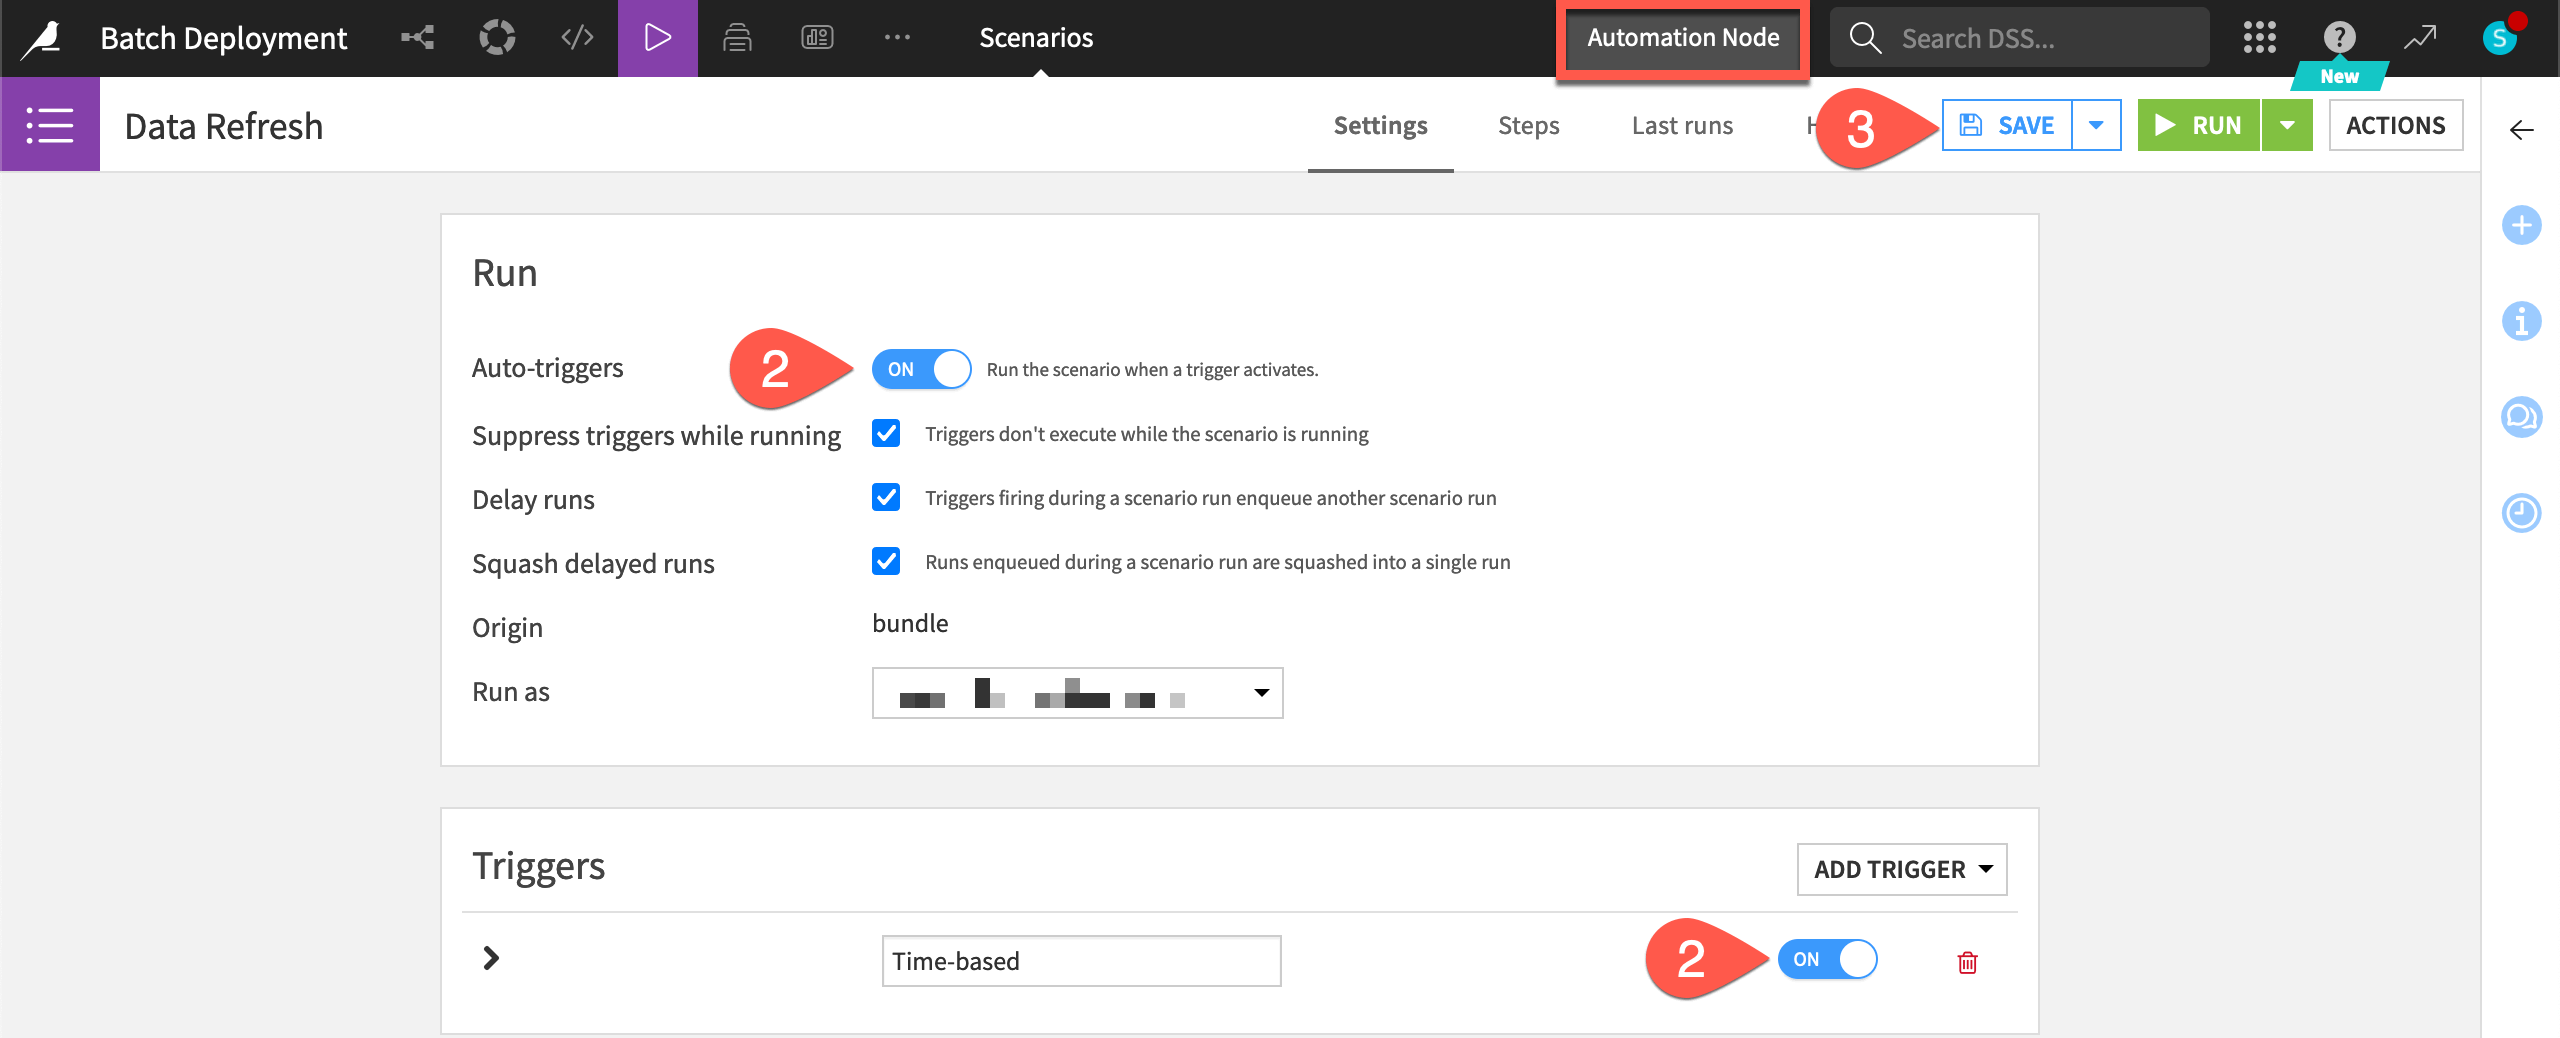
While in the Automation node version of the project, open the Data Refresh scenario.
In the Settings tab, turn On the Auto-triggers setting so any trigger, when activated, can run.
Make sure the Time-based trigger is also enabled.
Click Save to activate the scenario (which will continue failing on the Automation node, as it did on the Design node).
Monitor a batch deployed project#
Now that you have an active scenario running in production, you must monitor it. In addition to the scenario’s Last runs tab, let’s examine additional monitoring tools at your disposal.
At the project-level#
The most granular view is within the project itself.
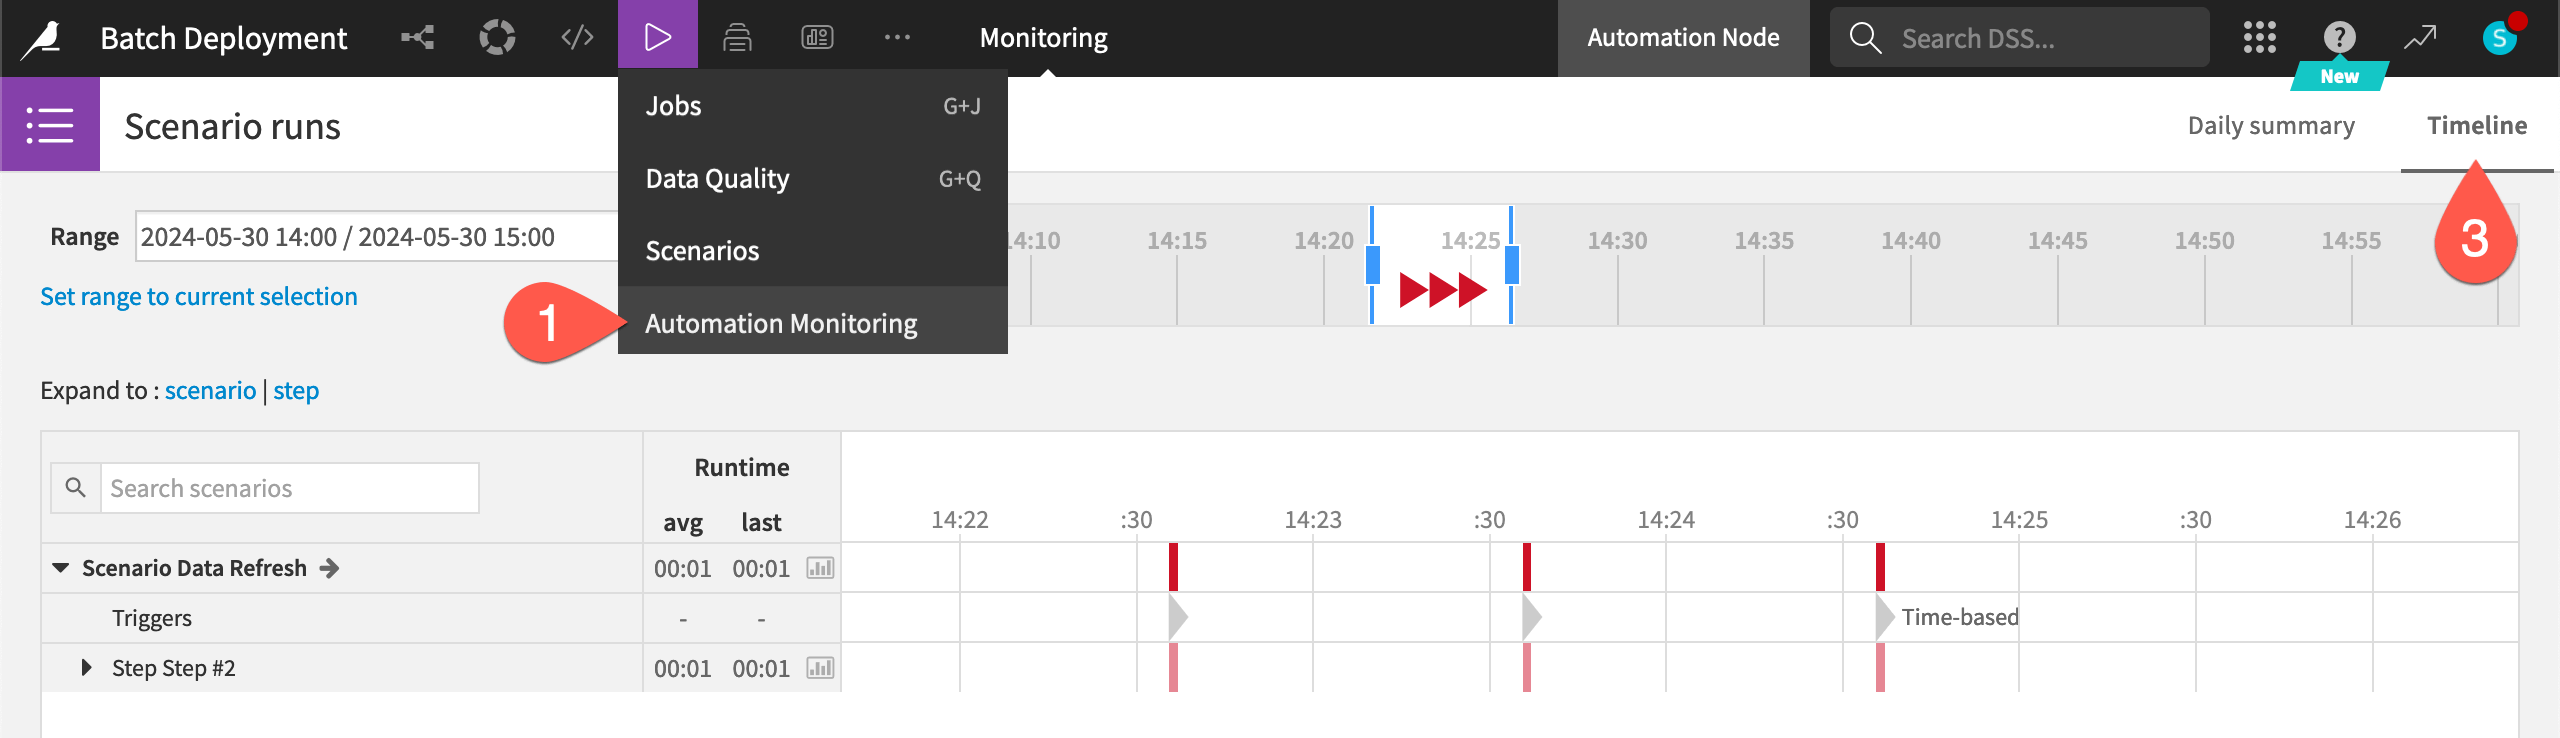
From the Jobs (
) menu of the Automation node project, select Automation Monitoring.Click Load Scenario Runs.
Explore the Daily Summary and Timeline tabs using the filters to view the progress of any scenarios within this project.
At the Project Deployer-level#
Instead of checking the progress on the Automation node, you can also monitor the progress of deployments from the Project Deployer.
Return to the Project Deployer.
From the Deployments tab, view information about the status of any deployment, including scenario runs.
Select the current deployment to see an overview in the Status tab.
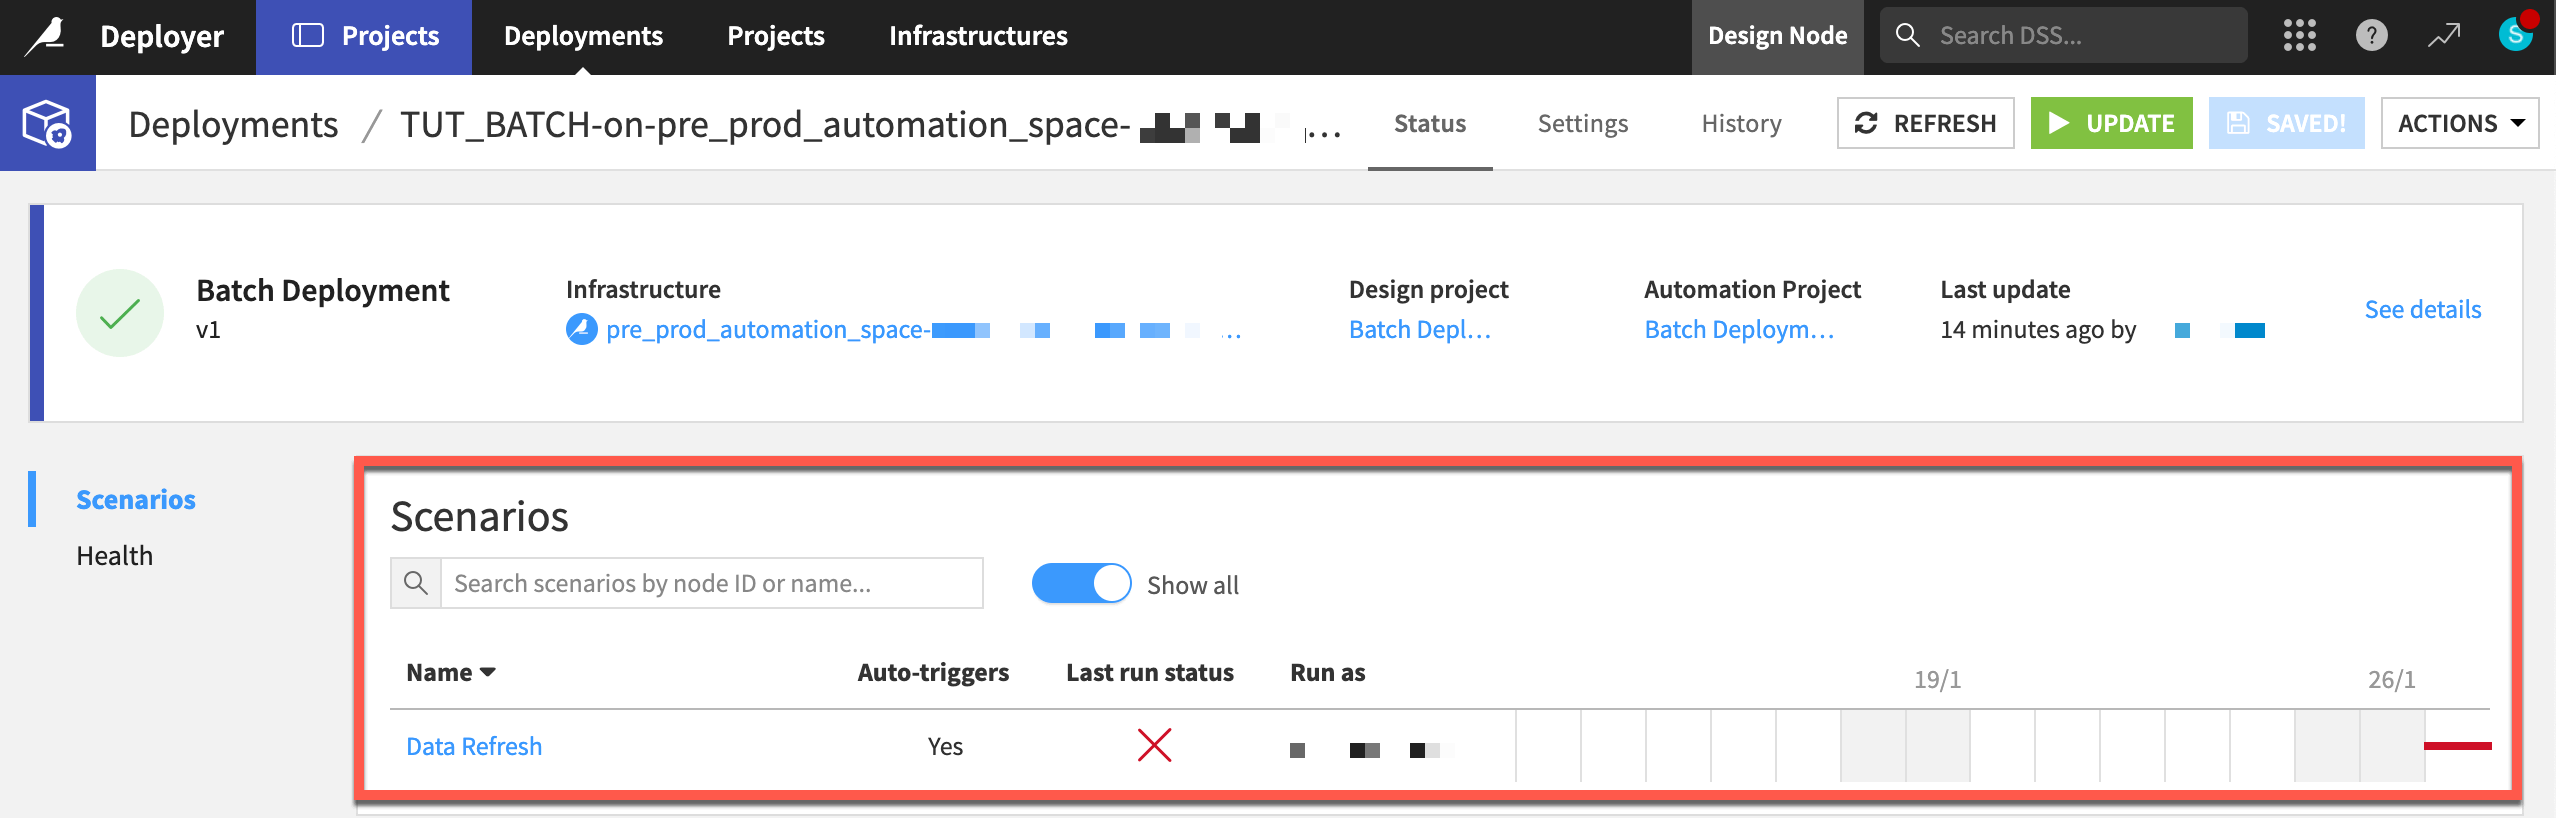
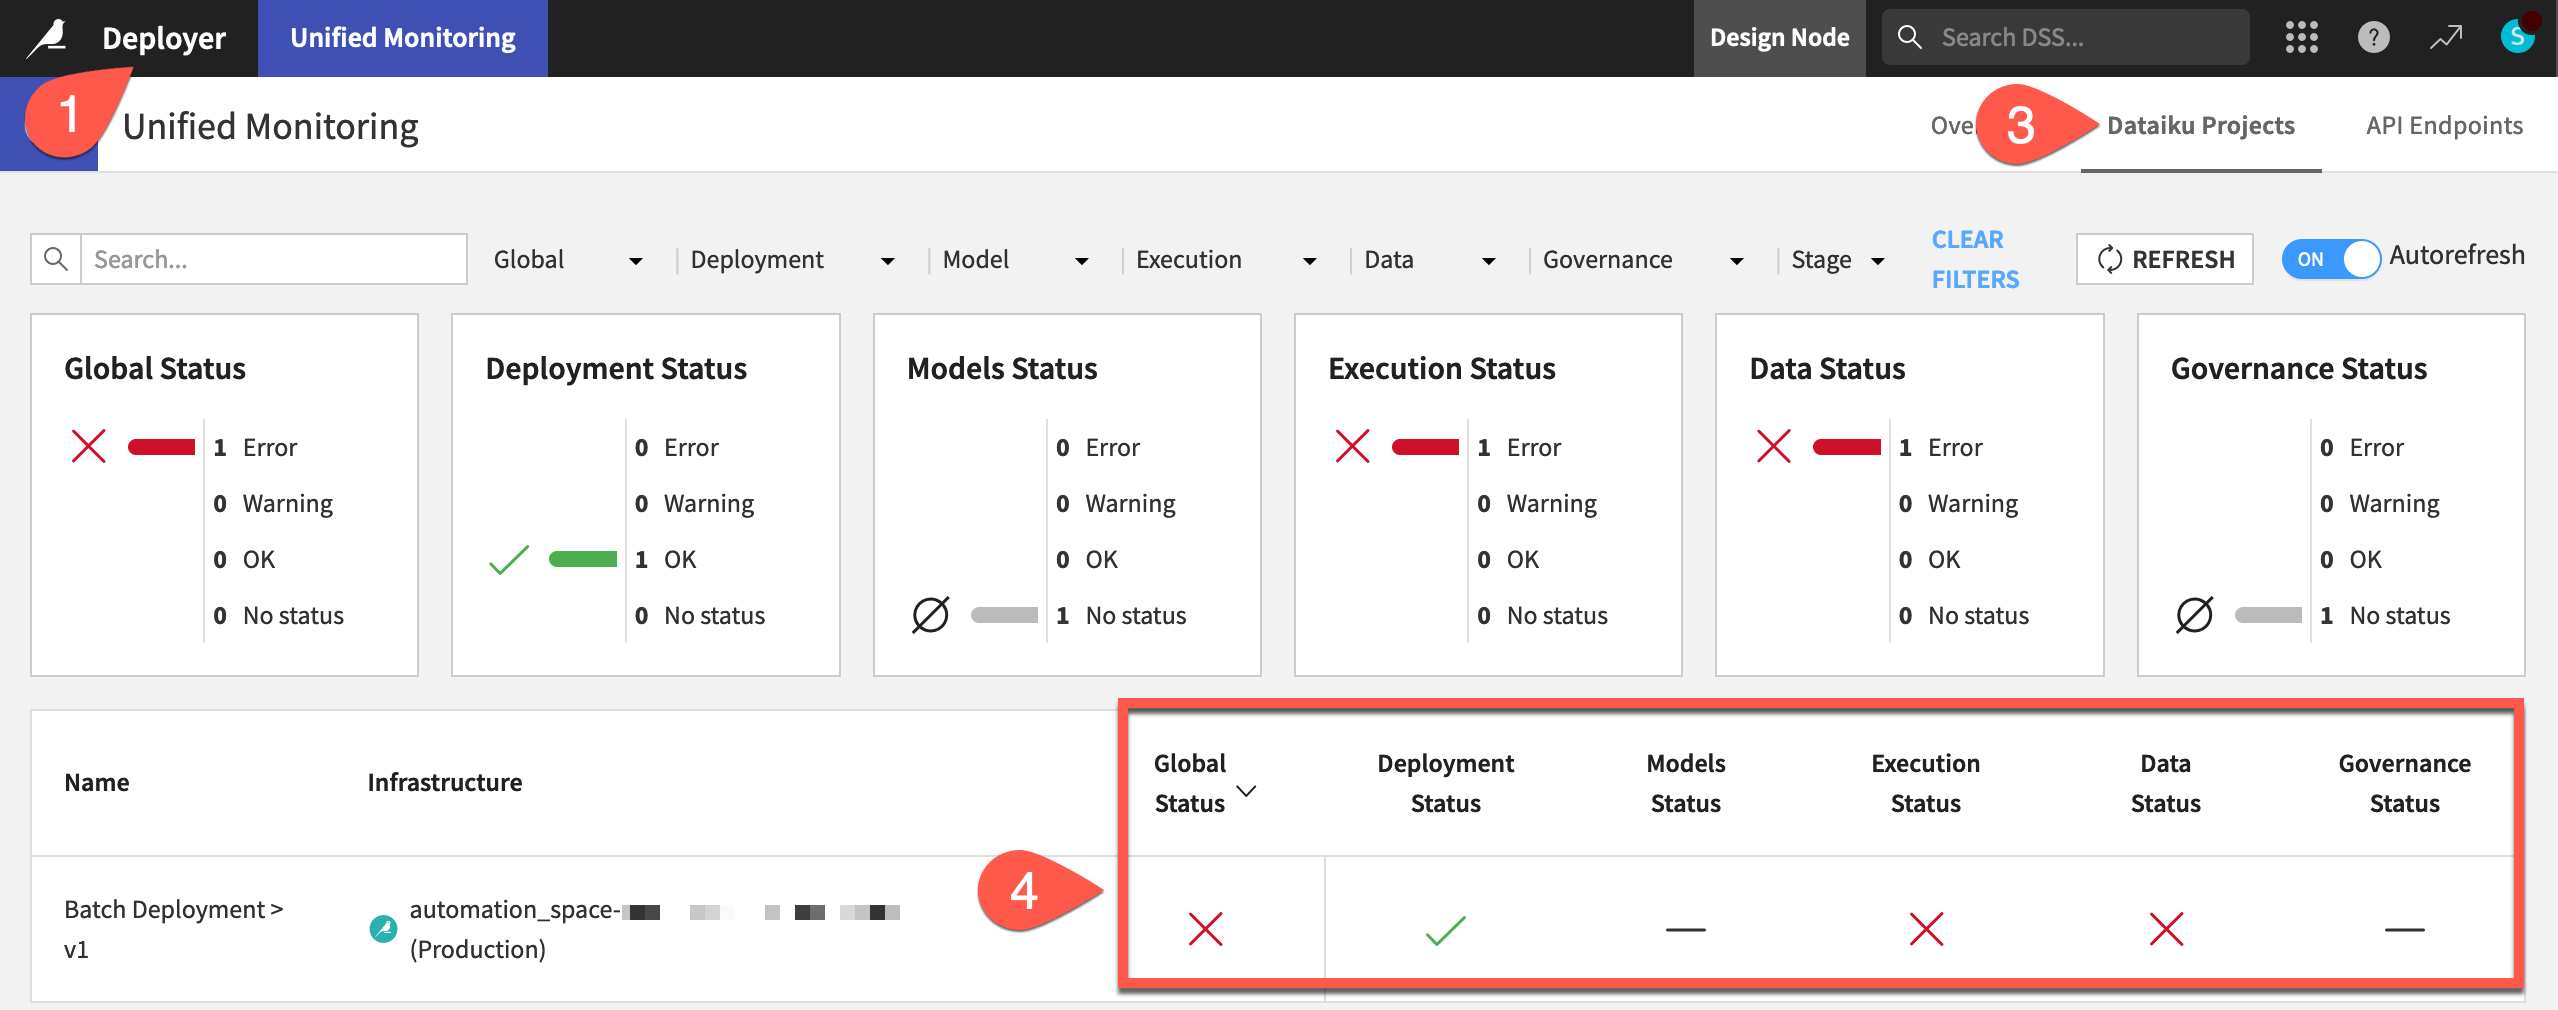
At the instance-level#
It can also be helpful to have an instance-wide view of the health status of all deployed projects (as well as API services).
From the Project Deployer, click Deployer at the top left to go to the Deployer home.
Select Monitoring.
Navigate to the Dataiku Projects tab as that’s the interest at the moment.
Find your deployment, using the search box if needed.
If you can’t find it, the infrastructure to which you’ve deployed might not be monitored. Go to the Settings tab of the Unified Monitoring page, and confirm that the infrastructure hosting your deployment is in fact monitored.
See also
See Unified Monitoring to learn more about interpreting these health statuses. You’ll address this topic more directly in the Production Monitoring Academy course.
Disable scenarios from the Deployer#
Since you can see the scenario failing, deactivate the automated trigger from the Project Deployer.
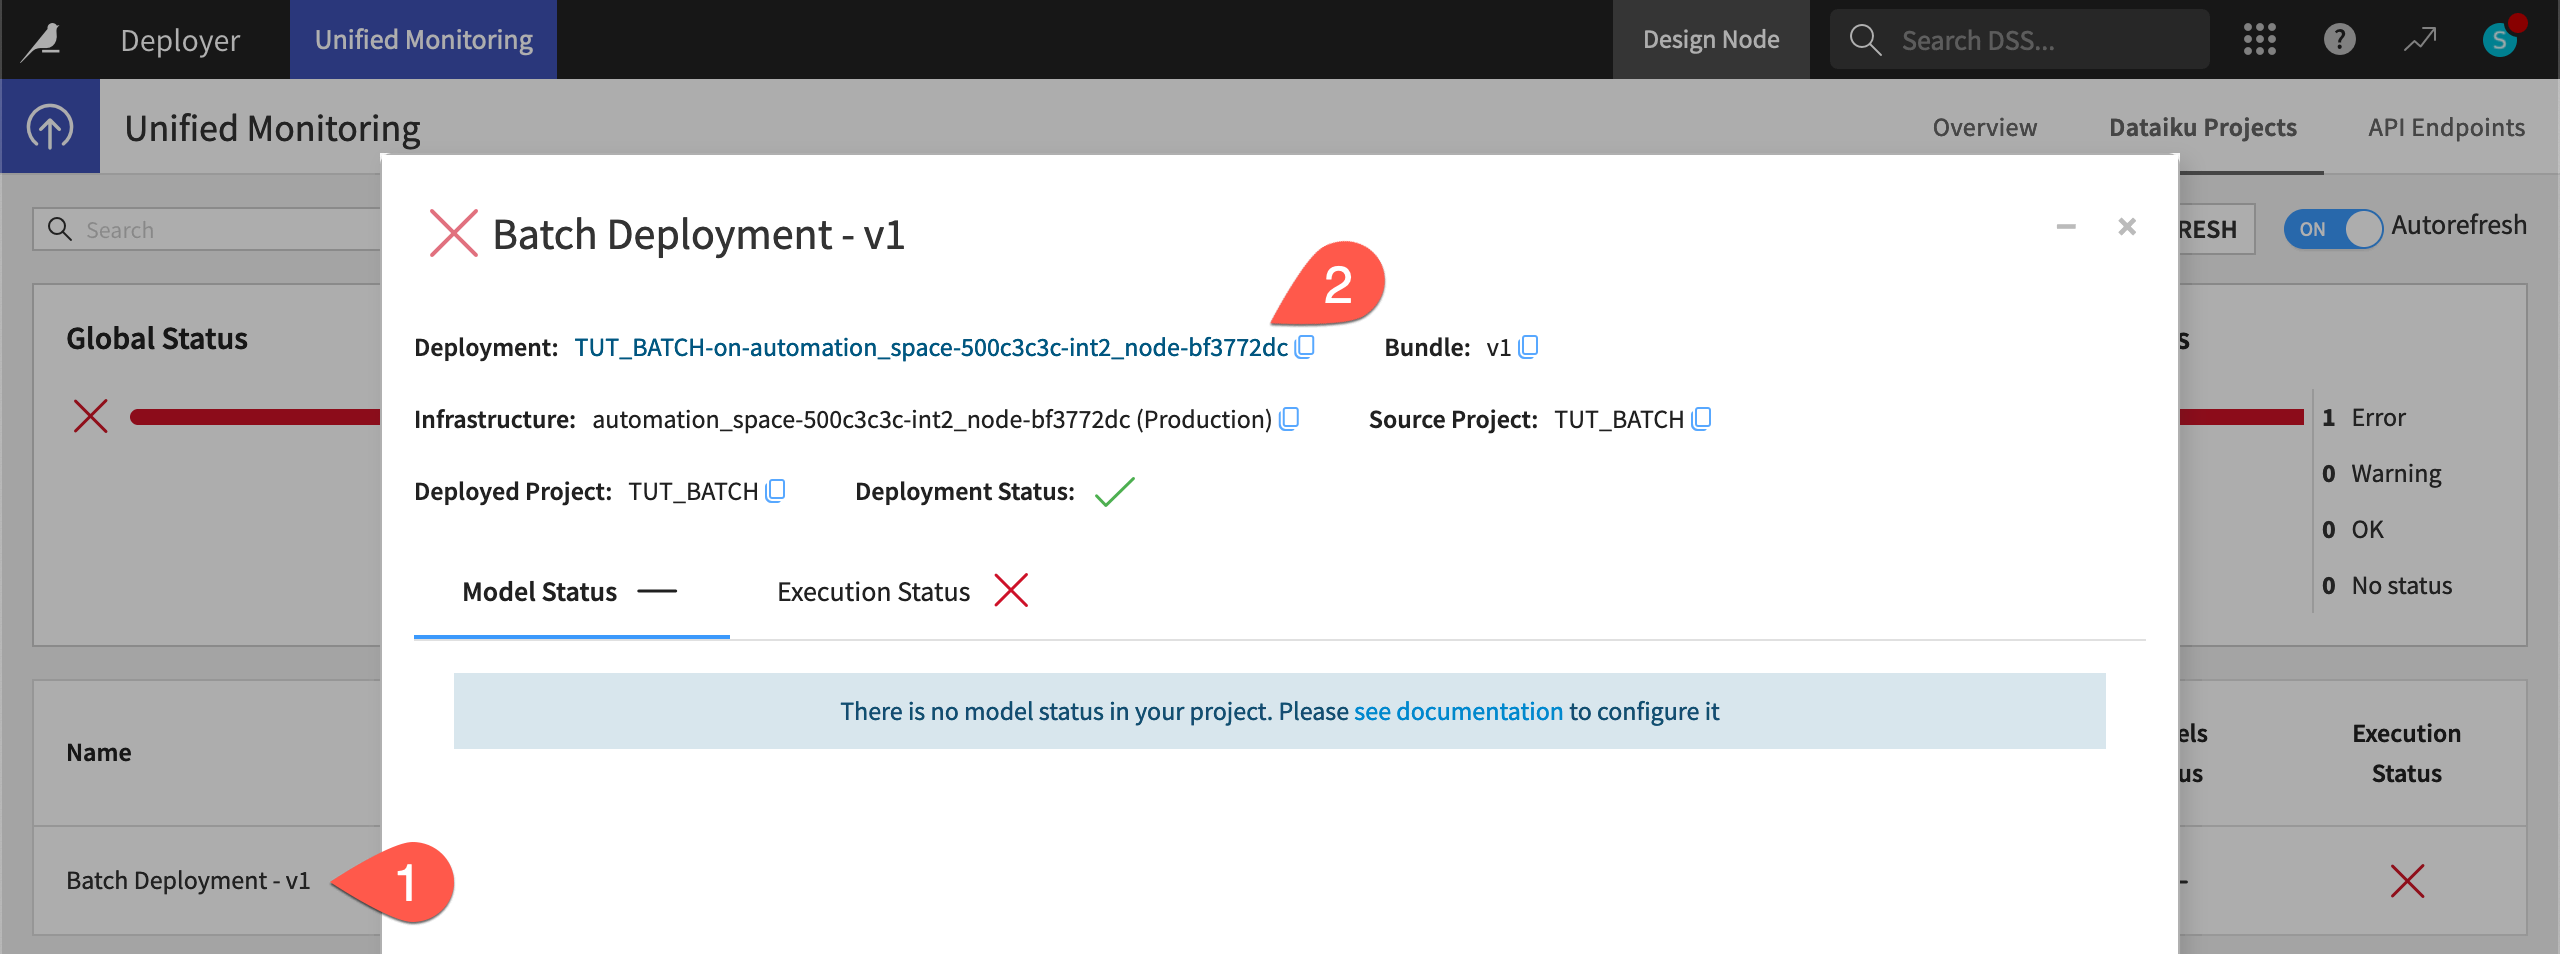
From the Dataiku Projects tab of the Unified Monitoring page, click on the row for the failing deployment to see more information.
Click on the deployment.
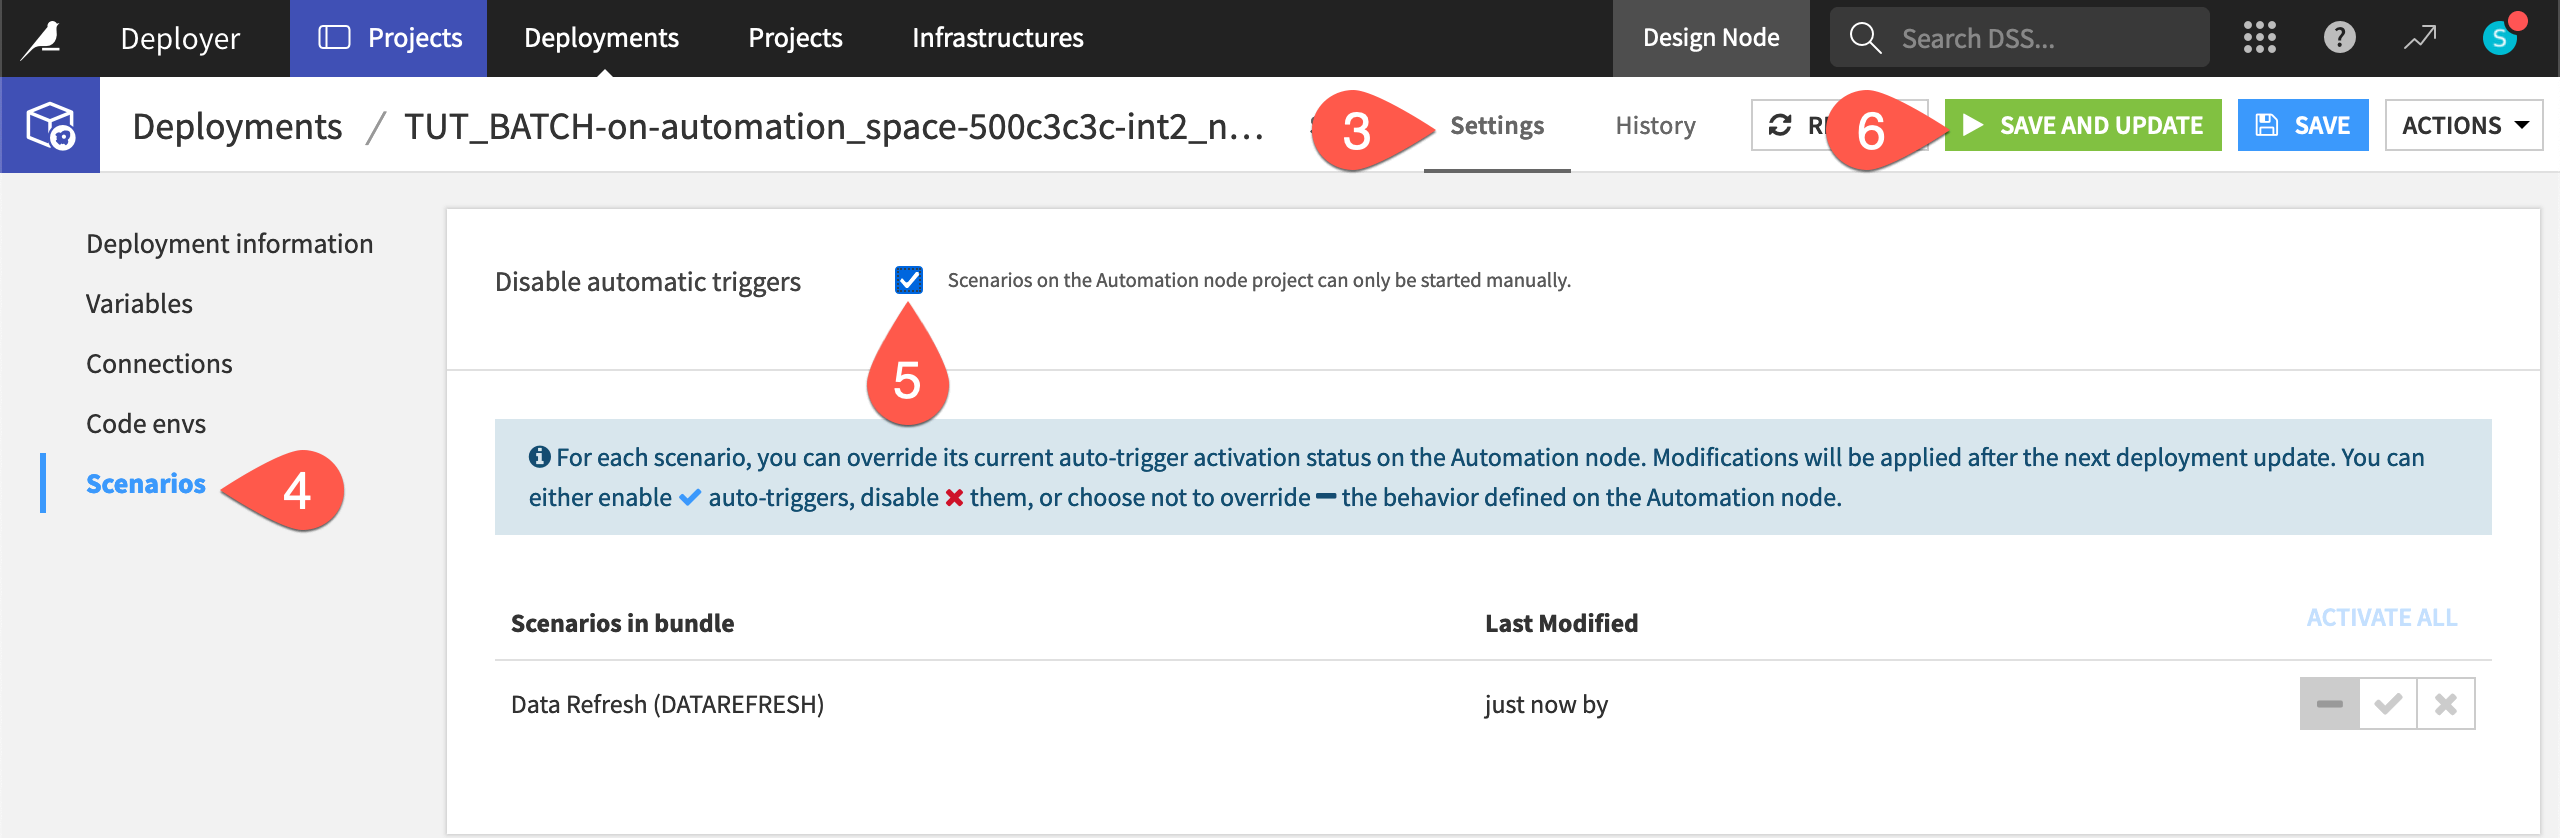
Navigate to the Settings tab of the deployment.
Go to the Scenarios panel.
Click to Disable automatic triggers.
Click Save and Update, and then Confirm.
Tip
Check the homepage of the Automation project to confirm the scenario is no longer active!
Version a deployed project#
As you monitor the health of deployments, you’ll need to deploy updated versions of projects over time — especially since this one is already failing!
Where to make changes to a project#
When it’s necessary to make a change to a deployed project, it’s critical to make all such changes in the development environment (the Design node). Only then should you push a new bundle to the production environment (the Automation node).
It may be tempting to make a quick change to the project on the Automation node. However, you should avoid this temptation because the project in the production environment would no longer be synced with its counterpart in the development environment.
Consider a situation where you want to revert back to an earlier version of the project. If you’ve made changes in the Automation node, you will lose these changes. Accordingly, actual development should always happen in the Design node. You should publish new versions of bundles from there.
Fix the failing scenario#
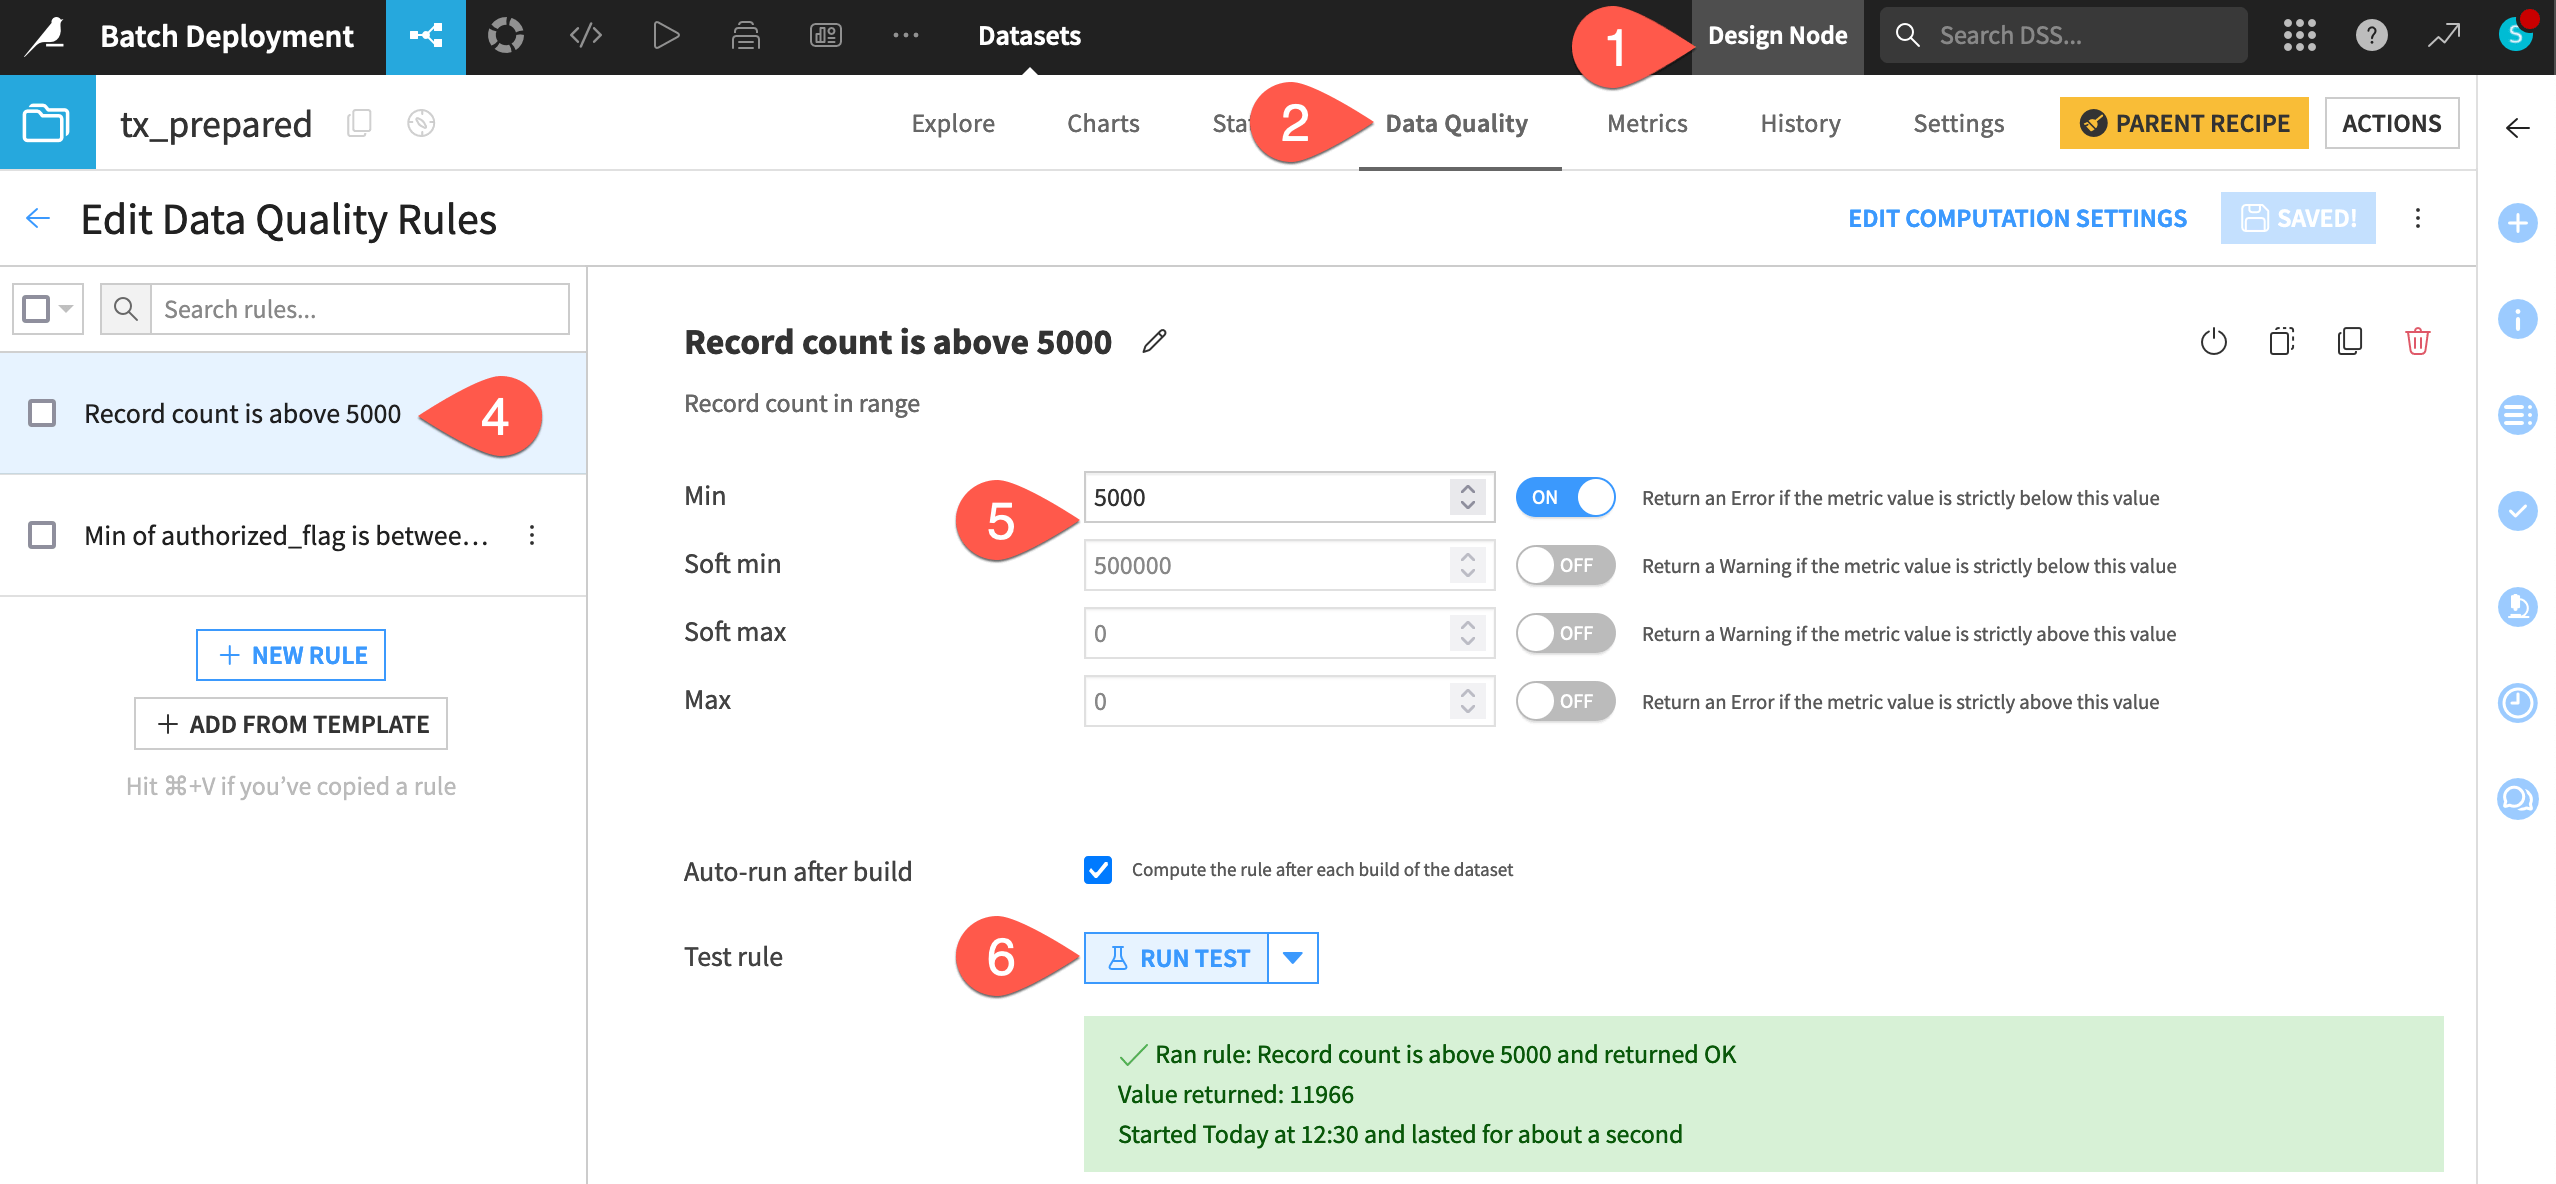
Taking this advice, return to the Design node project. You know the source of the problem is a data quality rule on the tx_prepared dataset. Fix it so the scenario can succeed.
In the Design node project, open the tx_prepared dataset. If it’s empty, build it.
Navigate to the Data Quality tab.
Click Edit Rules.
Select the Record count rule.
Decrease the min to
5000, and turn Off the soft min.Click Run Test to confirm it returns OK.
Create a second bundle#
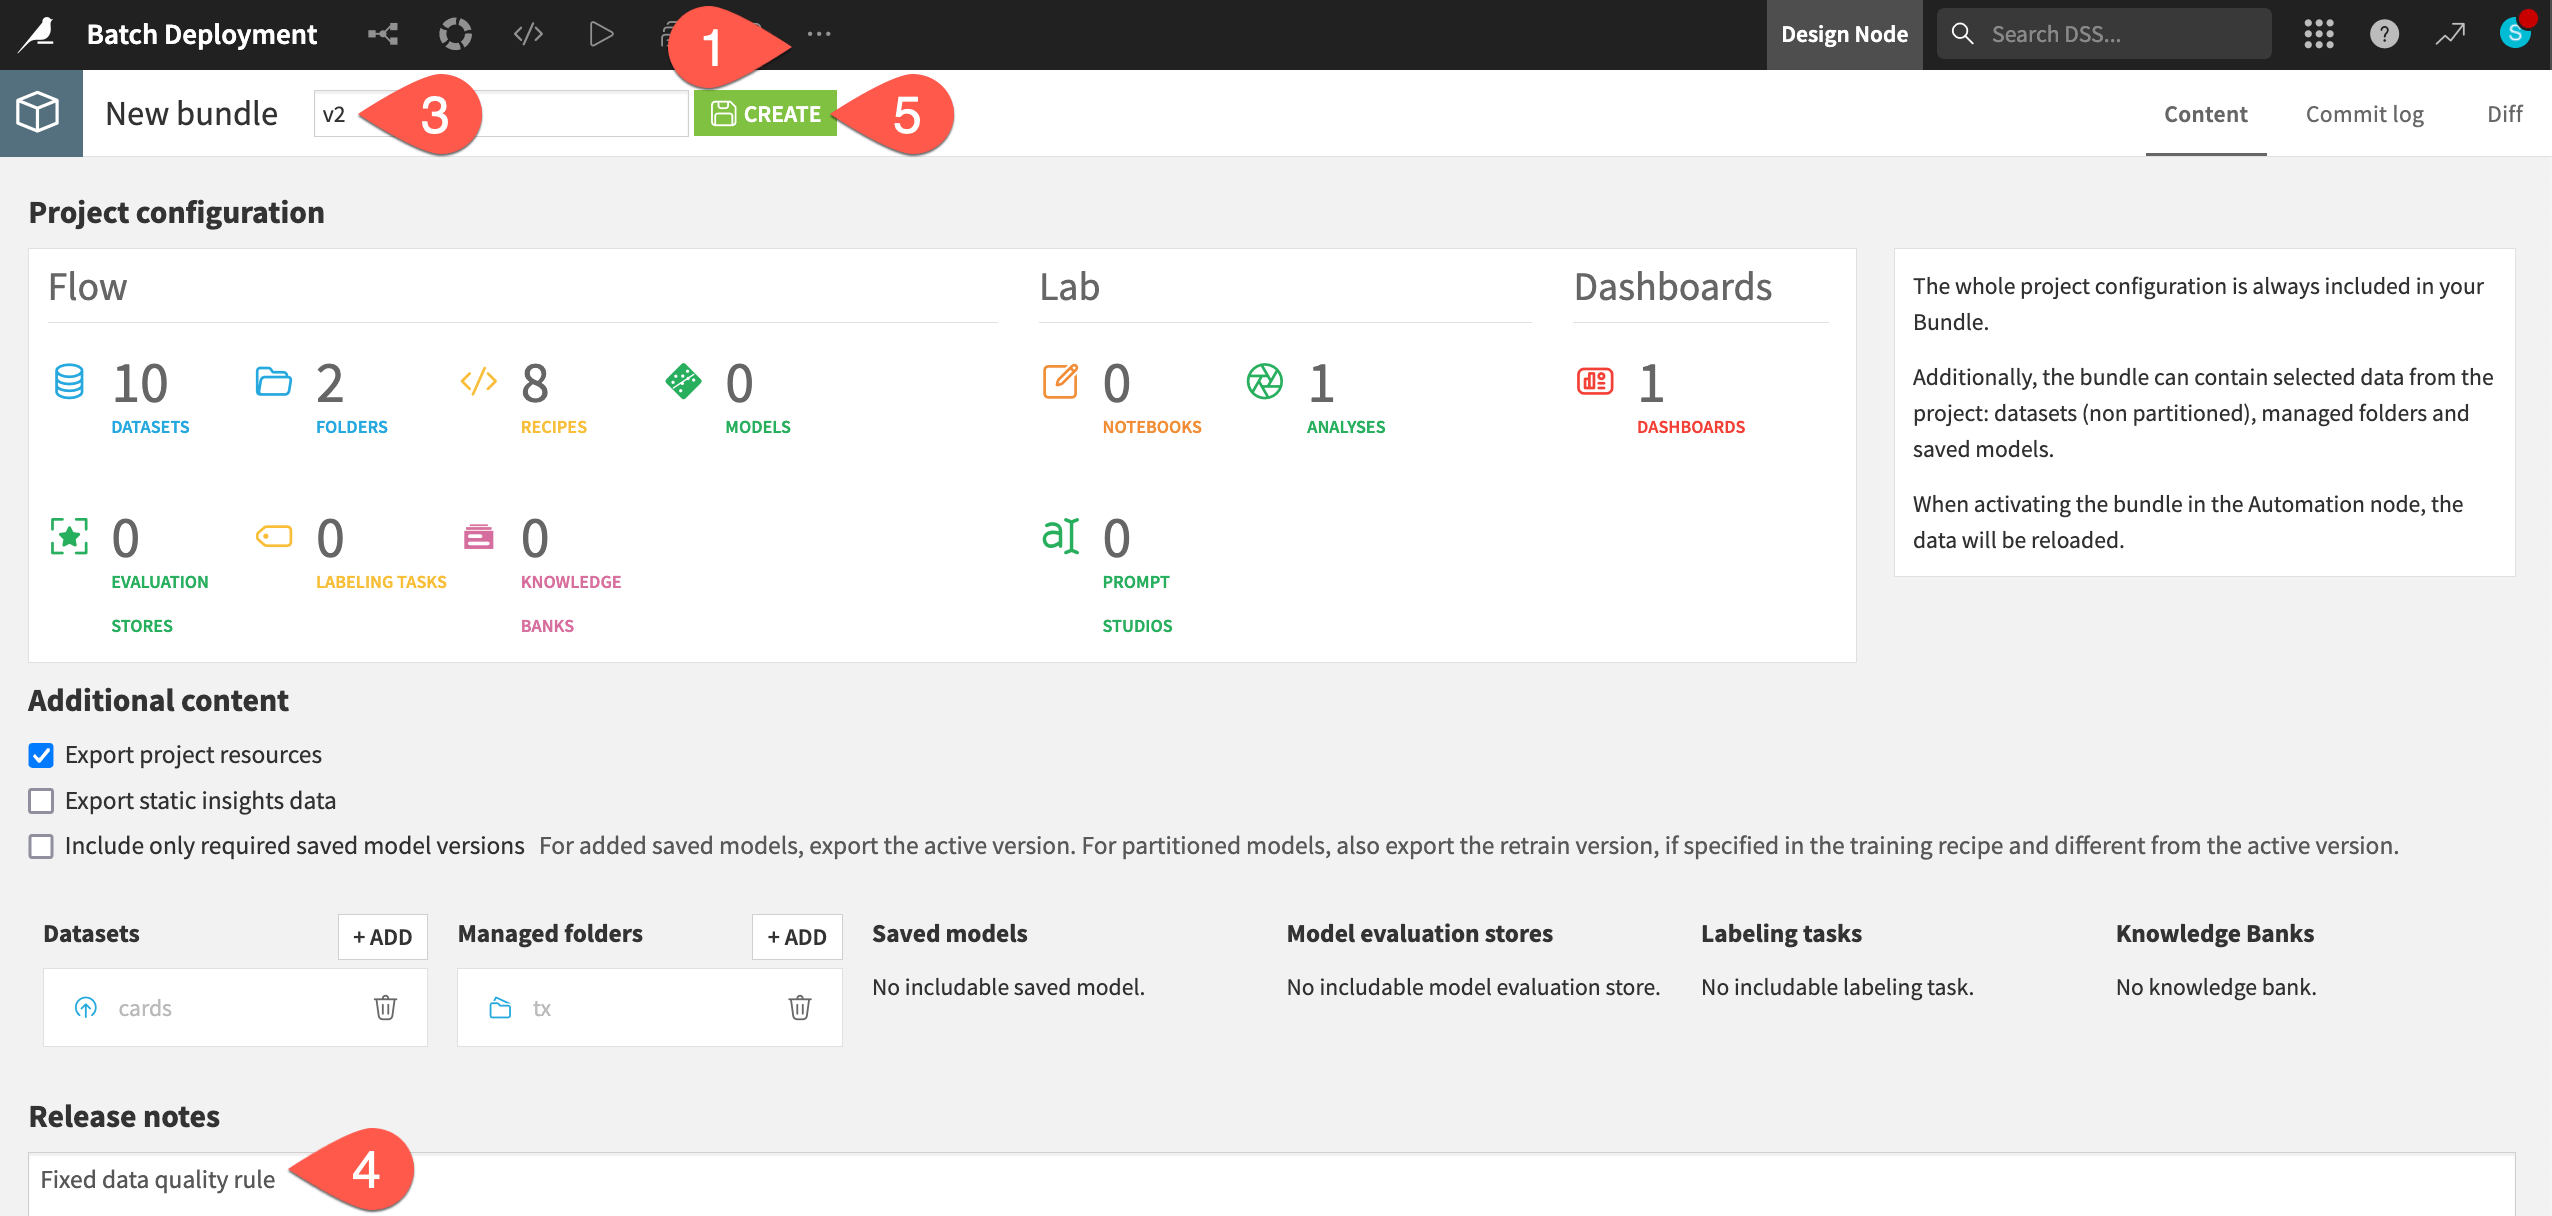
With the scenario’s problem fixed, update the existing deployment with a new bundle.
From the More Options (
) menu of the top navigation bar, select Bundles.Click + New Bundle.
Name it
v2.In the release notes, add
Fixed data quality rule.Click Create.
Tip
Subsequent bundles inherit the configuration of their predecessor. In this case, the second bundle already includes the uploaded dataset and the managed folder.
Deploy the new bundle#
The process for deploying the new bundle is the same as for the first one.
Click on the newly created v2 bundle, and click Publish on Deployer.
Confirm that you indeed want to Publish on Deployer.
Click to Open in Deployer to view the bundle details on the Deployer.
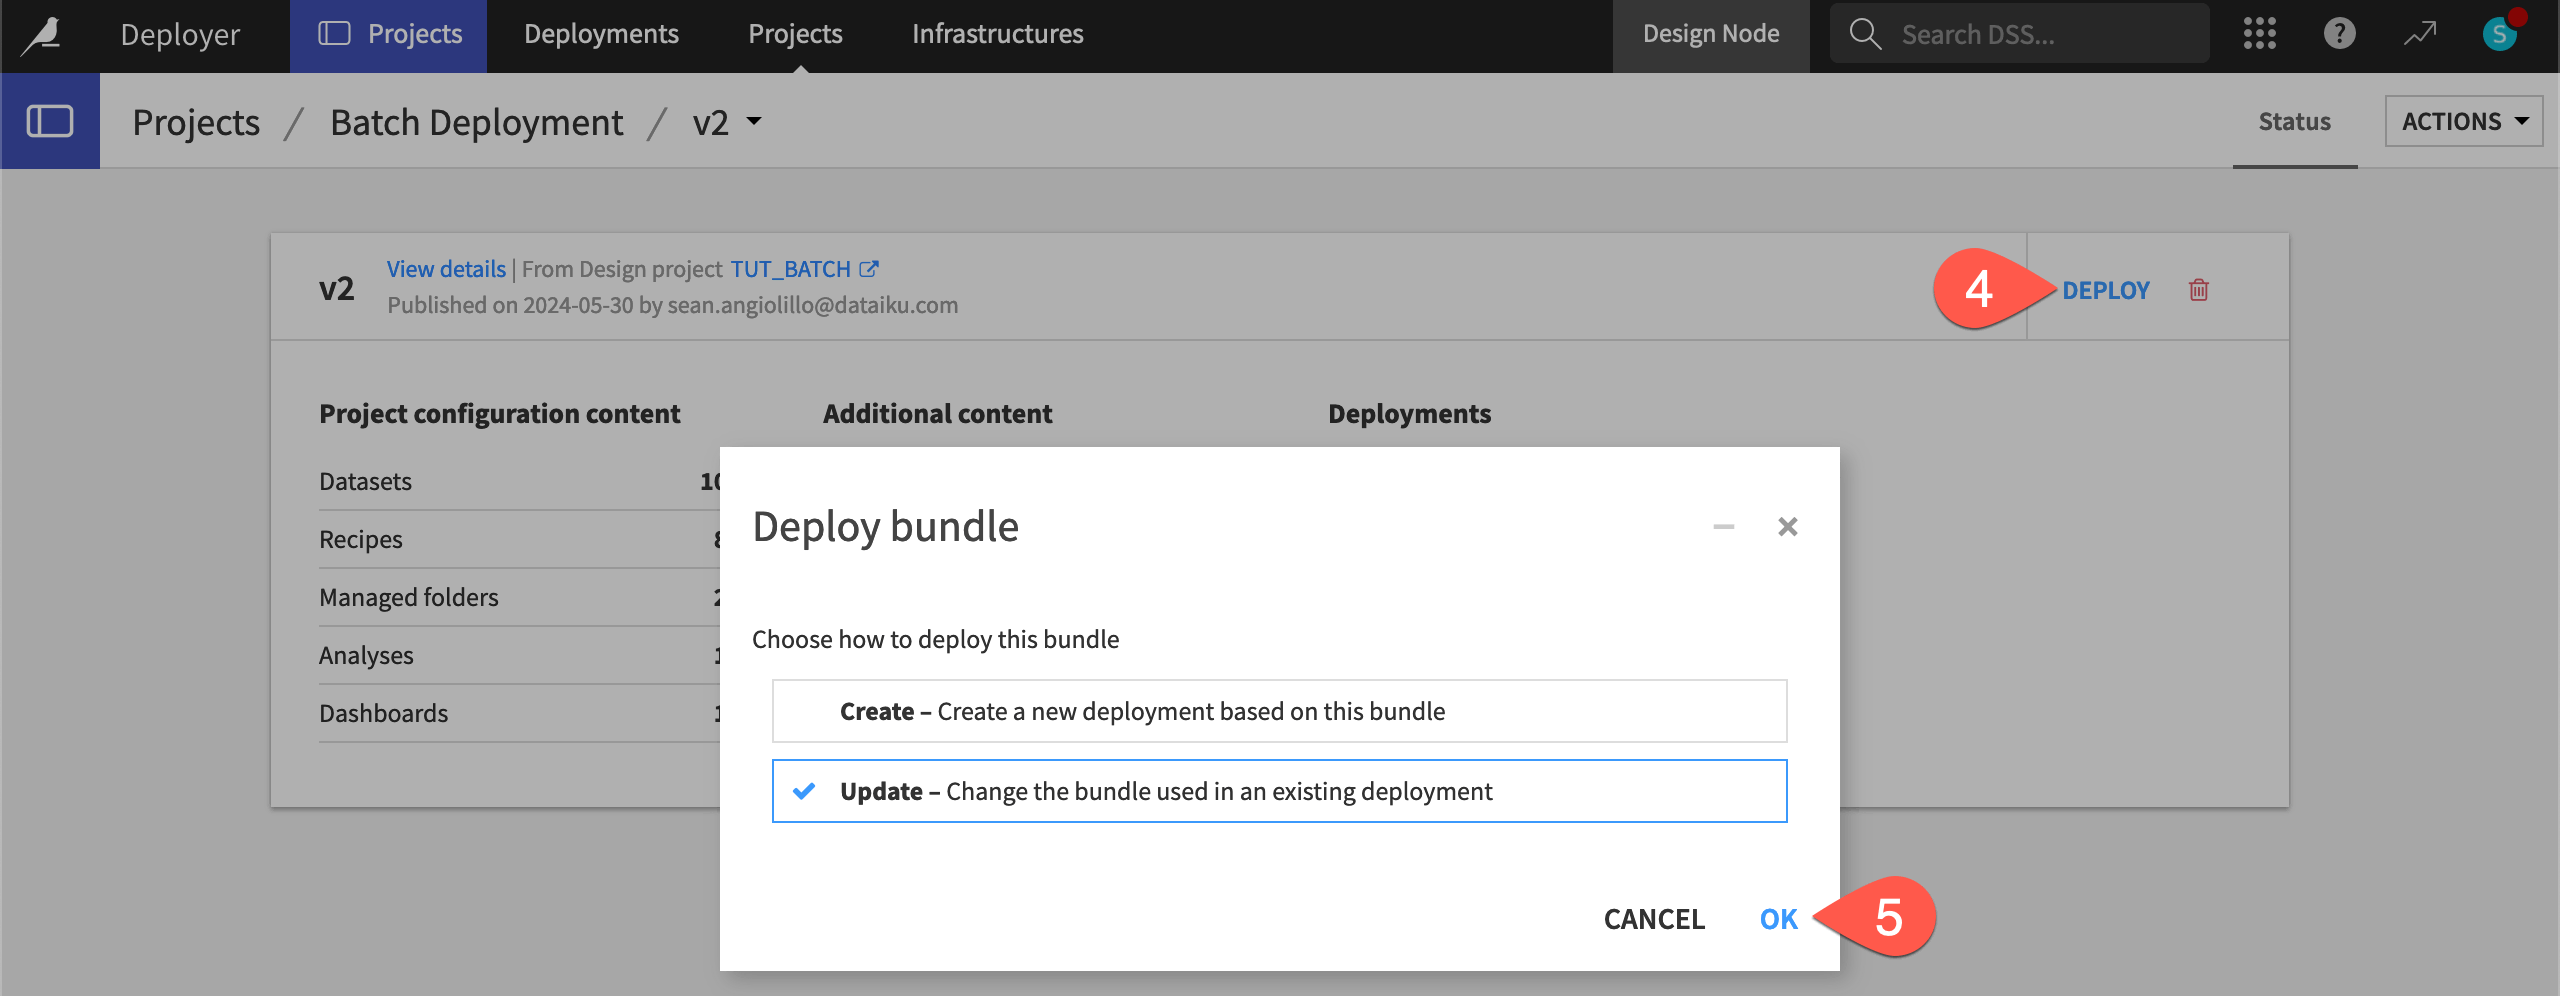
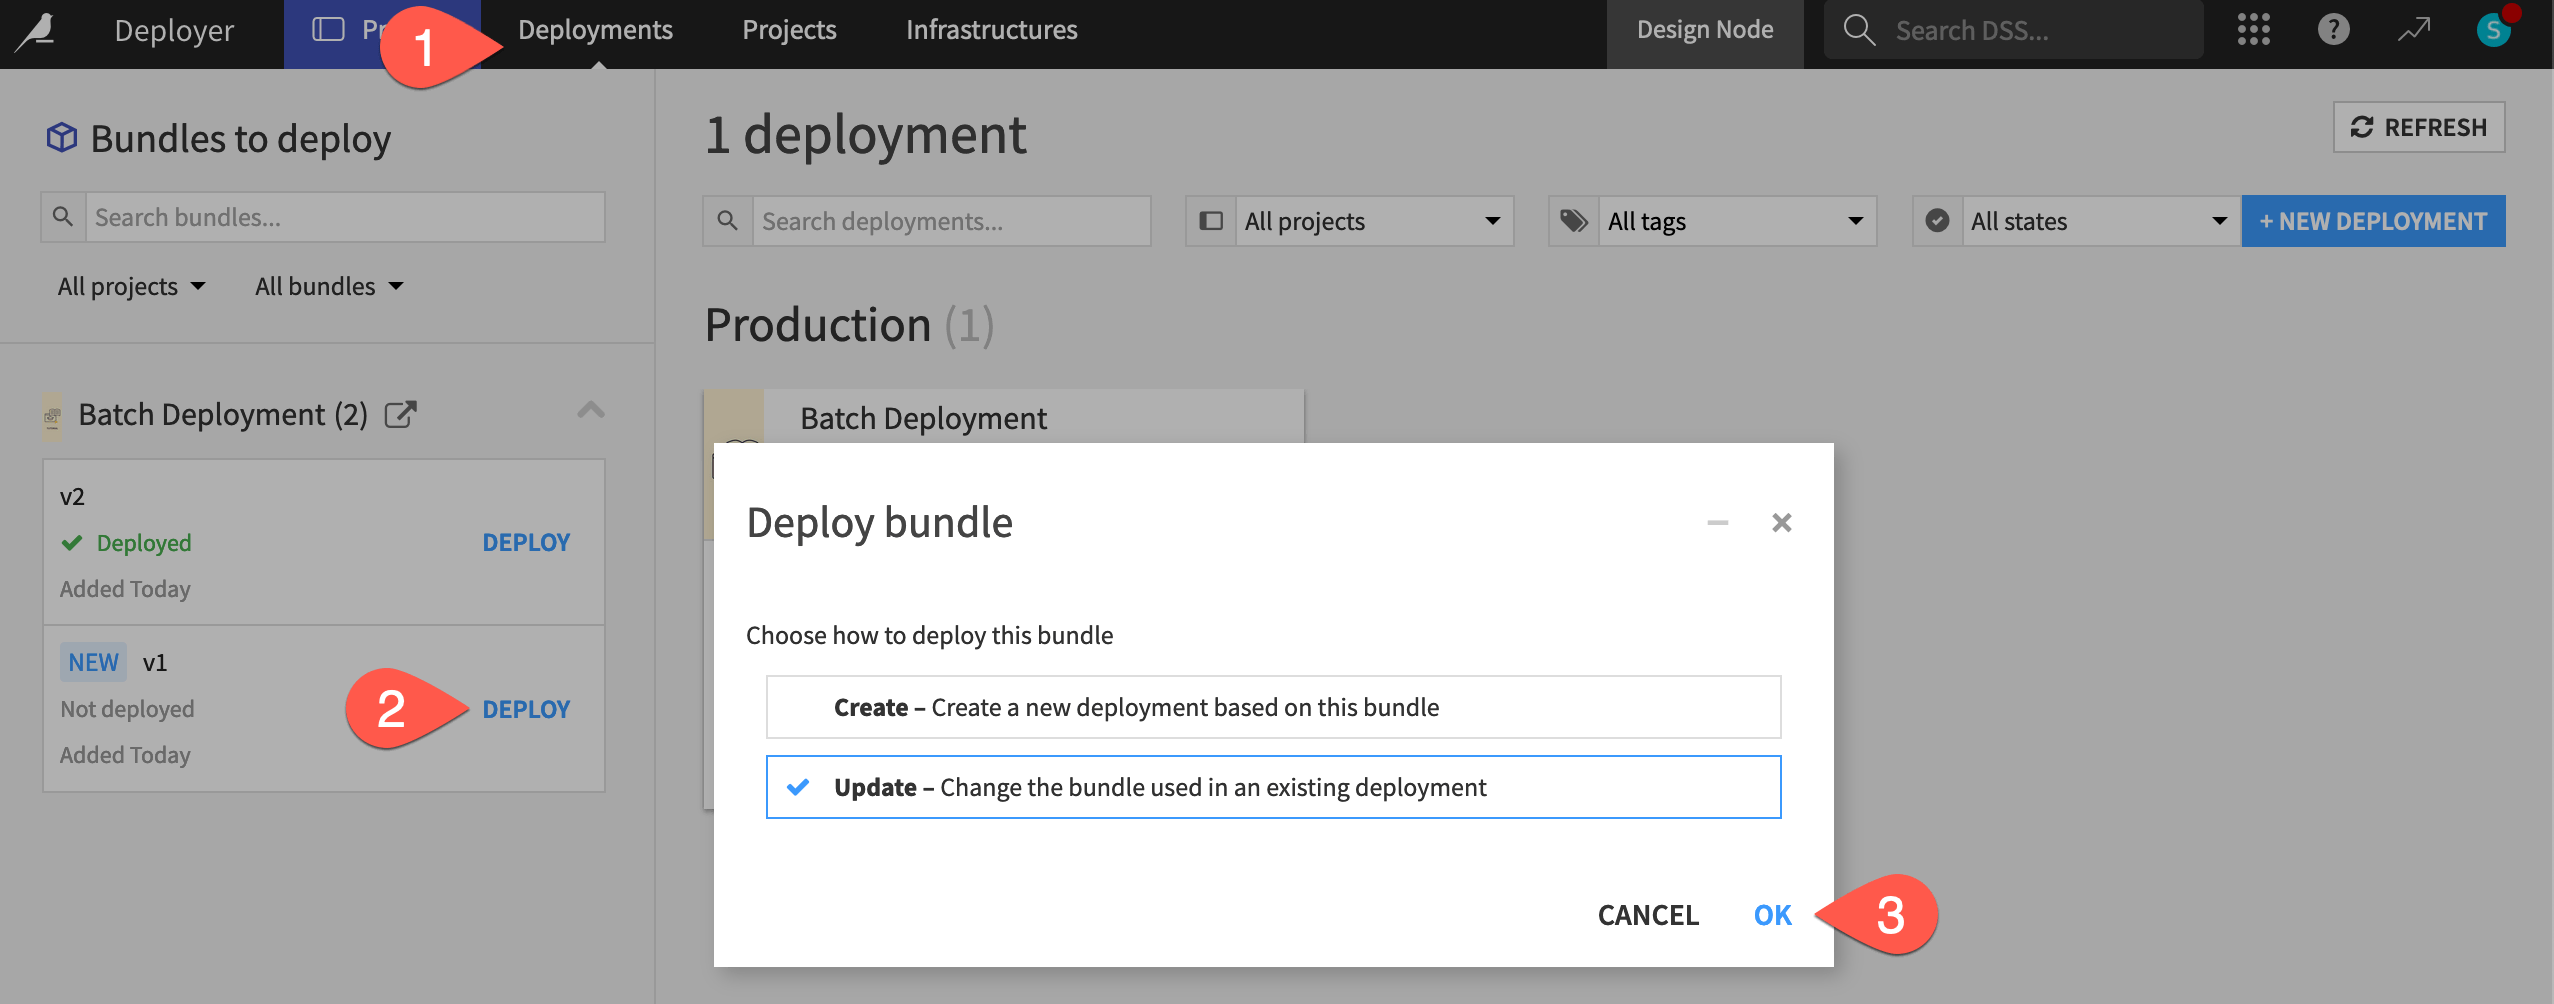
Once on the Deployer, click Deploy on the v2 bundle.
You have the option to create a new deployment or update the existing one.
Since this is a new version of an existing deployment, verify Update is selected, and click OK.
Click OK again to confirm the deployment you want to edit.
You’re not done yet!
Navigate to the Status tab of the deployment, and note how Dataiku warns that the active bundle on the Automation node doesn’t match the configured bundle.
Click the Update button to deploy the new bundle. Then Confirm.
Refresh the page to see v2 as the active bundle in the deployment’s Status tab.
Tip
You can track changes to a deployment in the Last Updates tab. If you’ve followed the tutorial, you’ll see three updates: one for the initial deployment, one for disabling the automatic scenario triggers, and one for deploying the v2 bundle.
Activate a scenario from the Deployer#
Previously you activated the scenario directly from the Automation node project. Now control it from the Project Deployer.
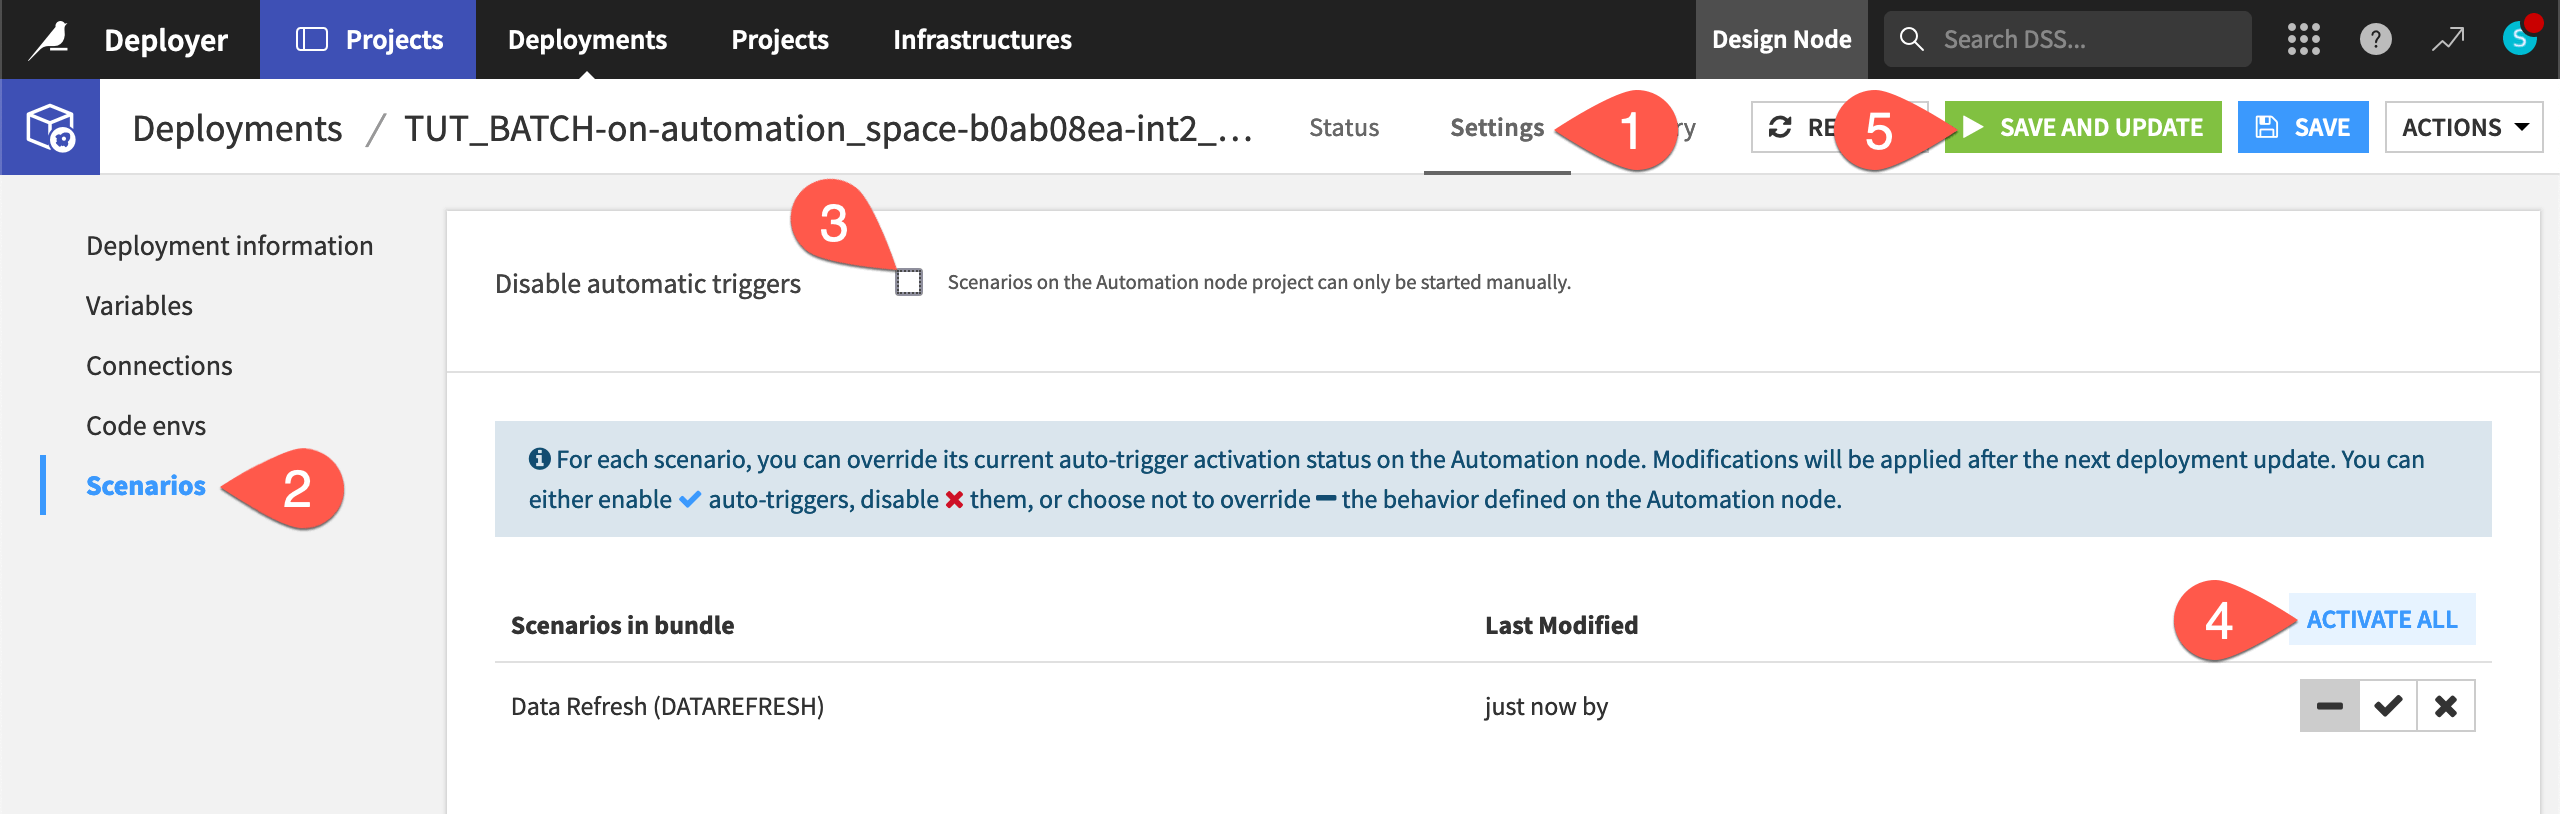
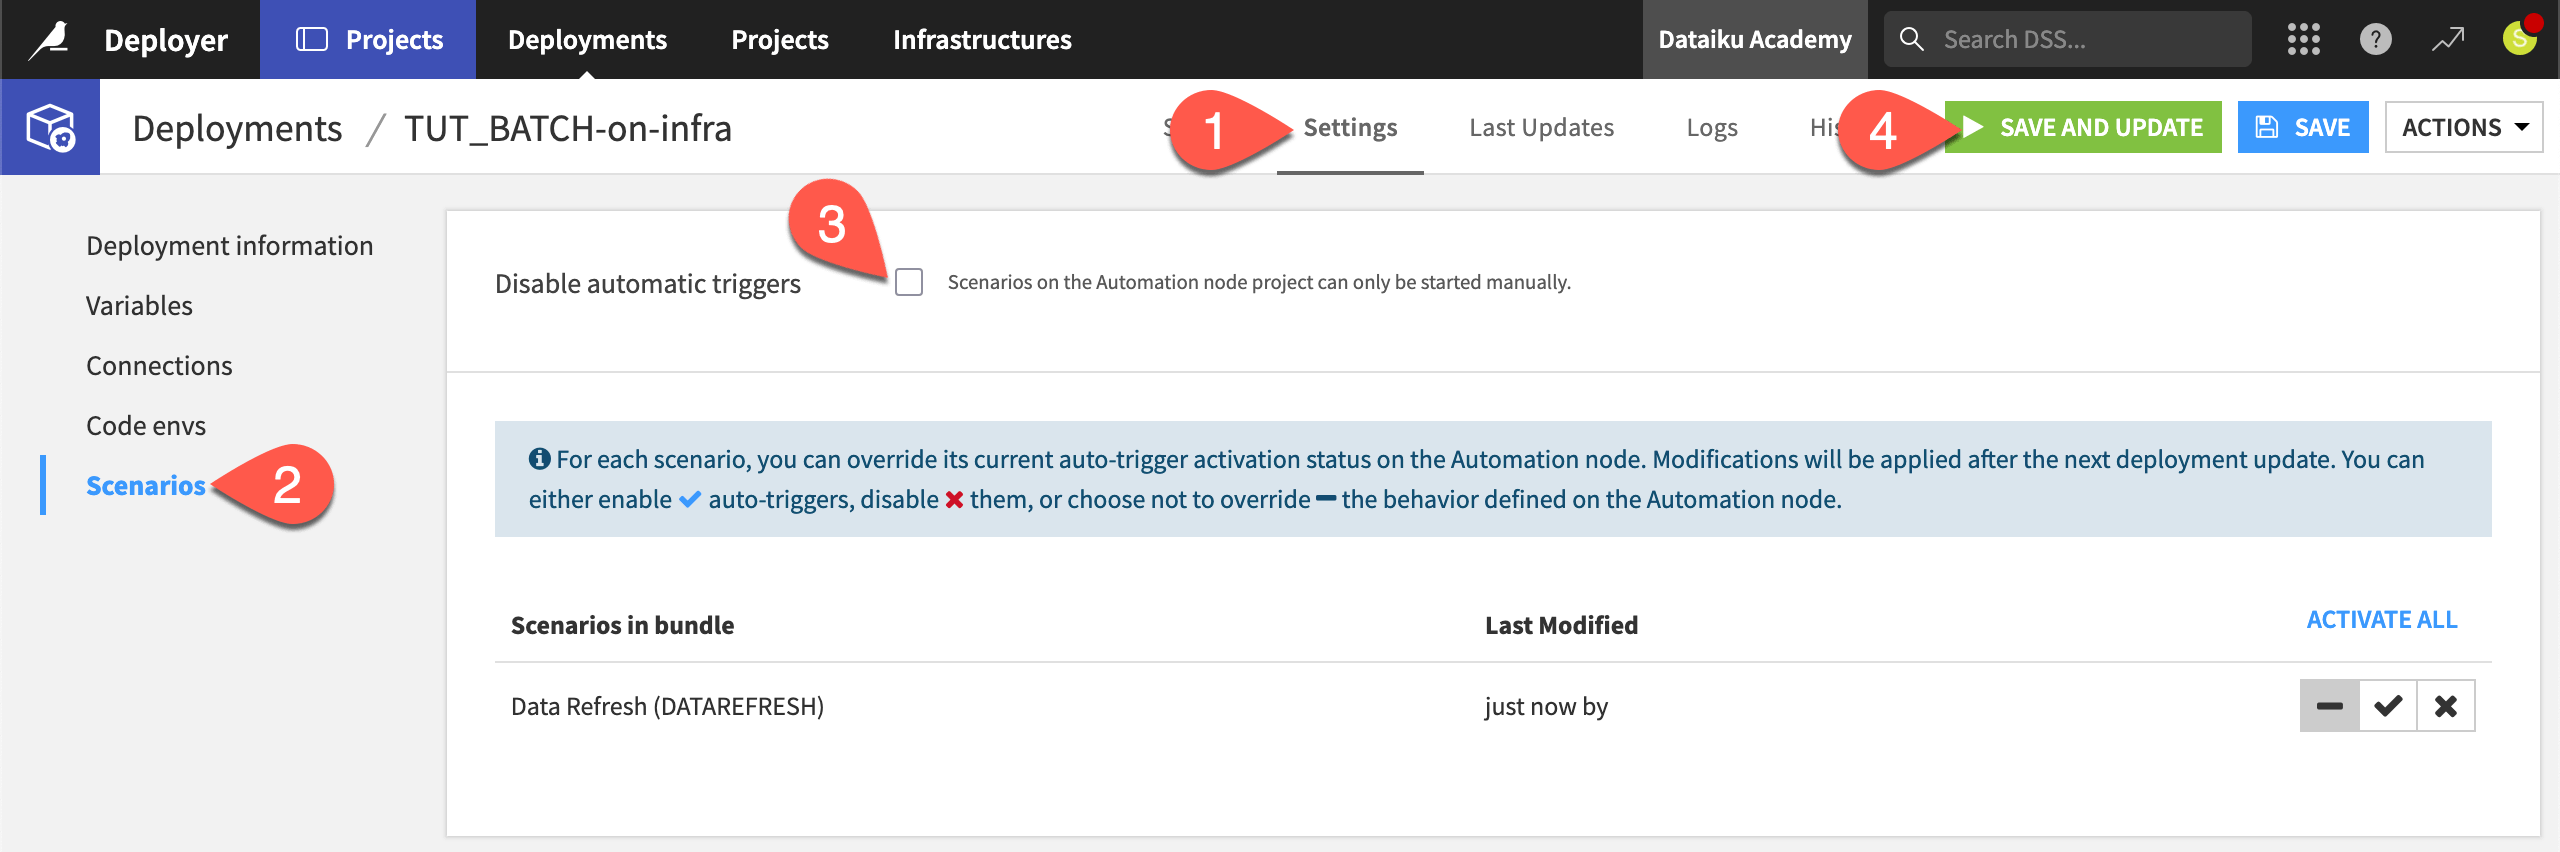
Navigate to the Settings tab of the deployment.
Go to the Scenarios panel.
Uncheck the box for Disable automatic triggers.
Click Activate All to enable the auto-triggers for any scenario.
Click Save and Update and then Confirm.
Tip
Once you’ve done this, verify the scenario in the v2 bundle ran successfully! You can check this on the Automation project or the Project Deployer.
Keeping in mind the synchronization interval, you can also view this on the Unified Monitoring page. Fixing the data quality rule means the data status should be OK. In turn, the successfully running scenario means the execution status should be OK. Therefore, given that the model and governance statuses are empty, the global status should also be OK.
Revert to a previous bundle#
It’s also important to be able to revert to an earlier version, should a new bundle not work as expected.
From the Deployments tab of the Project Deployer, find the project in the left hand panel.
Click Deploy next to the v1 bundle.
With Update selected, click OK, and confirm this is correct.
Now on the Settings tab with v1 as the source bundle, click the Update button, and Confirm the change.
Return to the Status tab of this deployment, or open the project homepage on the Automation node. Confirm that v1 is once again the active bundle running in production.
See also
See the reference documentation to learn more about reverting bundles.
Disable automatic scenario triggers#
Before you finish, don’t forget to turn off any running scenarios!
In the Project Deployer, go to the Settings tab of the active deployment.
Go to the Scenarios panel.
Click Disable automatic triggers.
Click Save and Update, and then Confirm.
Next steps#
Congratulations! To recap, in this tutorial, you:
Created a bundle in a project on the Design node.
Published a bundle to the Automation node via the Deployer.
Activated (and deactivated) a scenario to run on the Automation node.
Saw where to monitor the health of deployments.
Switched bundle versions within a deployment.
Now you have seen the batch processing framework for production. Your next step may be to examine the real-time API scoring method of production presented in the API Deployment course.
See also
For more information on bundle deployment, see the reference documentation on Production deployments and bundles.