Tutorial | Compute isochrones and routes with the Geo Router plugin#
Get started#
Dataiku has a Geo Router plugin for computing isochrones and routes. Let’s see how it works!
Objectives#
In this tutorial, you will:
Use the Compute isochrone recipe from the Geo Router plugin to draw a geometry representing the maximum driving distance around a point.
Use the Geo join recipe to filter for locations contained inside an isochrone.
Use the Compute route between two points recipe also from the Geo Router plugin to map itineraries.
Visualize the results on geometry maps.
Prerequisites#
Dataiku 12.0 or later.
Reverse geocoding / Admin maps plugin (included by default on Dataiku Cloud).
Basic knowledge of Dataiku (Core Designer level or equivalent).
Create the project#
From the Dataiku Design homepage, click + New Project.
Select Learning projects.
Search for and select Geo Router Plugin.
If needed, change the folder into which the project will be installed, and click Create.
From the project homepage, click Go to Flow (or type
g+f).
From the Dataiku Design homepage, click + New Project.
Select DSS tutorials.
Filter by Core Designer.
Select Geo Router Plugin.
From the project homepage, click Go to Flow (or type
g+f).
Note
You can also download the starter project from this website and import it as a ZIP file.
You’ll next want to build the Flow.
Click Flow Actions at the bottom right of the Flow.
Click Build all.
Keep the default settings and click Build.
Important
Allow a few minutes for the Flow (in particular the Geo join recipe) to finish computing.
Use case summary#
The project has three data sources:
tx |
Each row is a unique credit card transaction that has been either been authorized (a score of 1 in the authorized_flag column) or flagged for potential fraud (a score of 0). |
cardholders |
Each row is the latitude and longitude coordinates of a unique credit card holder. |
merchants |
Each row is the latitude and longitude coordinates of a unique merchant, all of which are gas stations. |
The Flow joins a small random sample of these three datasets together so that every record in tx_joined is a unique transaction, enriched with data about the location of credit card holders and merchants for that transaction.
Compute isochrones around merchant locations#
Let’s draw attention to two details of the existing project:
The Prepare recipe computing the merchants dataset creates the column merchant_bubble by drawing a circle with a radius of 10 kilometers around the location of a merchant.
The Geo join recipe in the project matches card holders within 10 kilometers of a merchant.
This 10 kilometer distance around merchant locations is an “as the crow flies” distance. For some use cases however, more important than the true distance may be the duration to make the trip using a common mode of transport — such as a car.
For answering these kinds of questions, computing an isochrone can be a valuable tool. An isochrone is a geometry that represents the area accessible from a point within a certain amount of time.
Note
To walk through creating the merchant_bubble column yourself, begin from Tutorial | Geographic processors.
Create a recipe to compute isochrones#
Instead of perfect circles, let’s compute an isochrone around each merchant location.
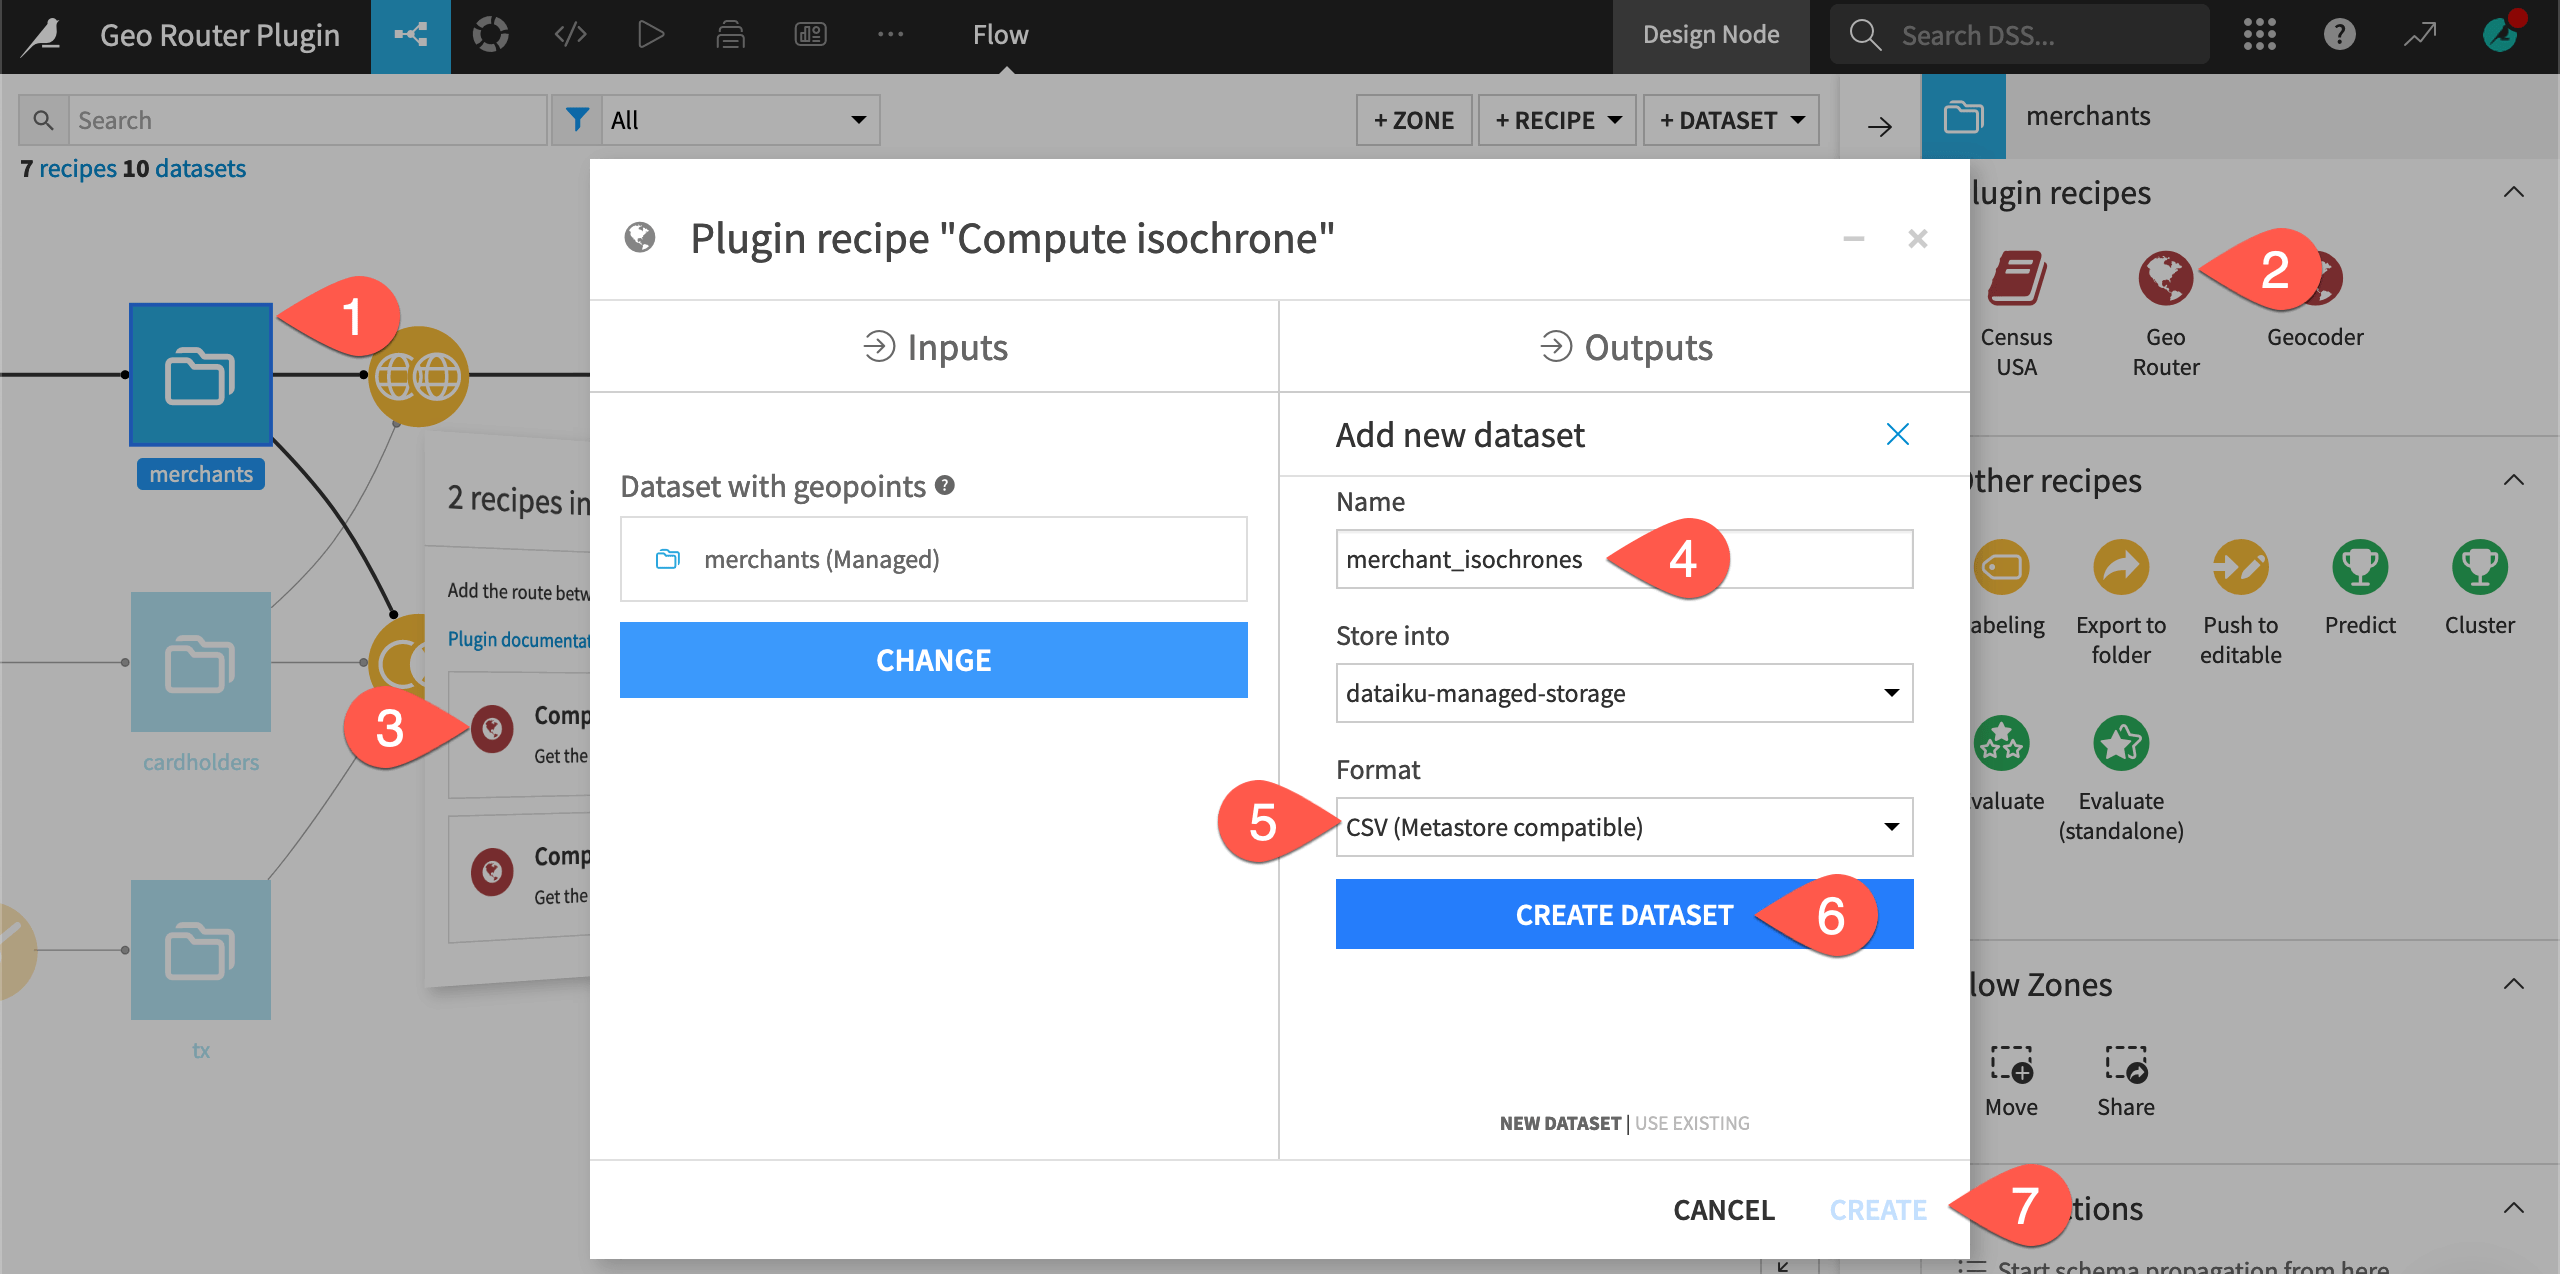
Select the merchants dataset.
From the Actions tab of the right panel, select Geo Router from the menu of plugin recipes.
Select the Compute isochrone recipe.
Click Set, and name the isochrones dataset as
merchant_isochrones.You may have a different default storage location and format depending on your instance settings. If using an S3 storage, choose a format other than parquet, such as CSV (Metastore compatible).
Click Create Dataset.
Click Create to finish the recipe setup.
Define conditions for the isochrones#
Once you have the recipe set up, you can define the conditions for the isochrones.
On the Settings tab of the recipe, provide merchant_geopoint as the geopoint column.
Set the maximum travel time to
30minutes.Click Run.
Open the output dataset after allowing a few minutes for it to compute.

Note
In the output dataset, you’ll likely notice some cases where an isochrone couldn’t be computed because no nearby route was found. To investigate why this may be, right click on a value in the merchant_geopoint column for a failed row, and click Preview to see where it lies on the map.
View isochrones on a map#
The output data has four new columns. In addition to three columns reporting possible errors, you have an isochrone geometry column. Let’s visualize it on a map!
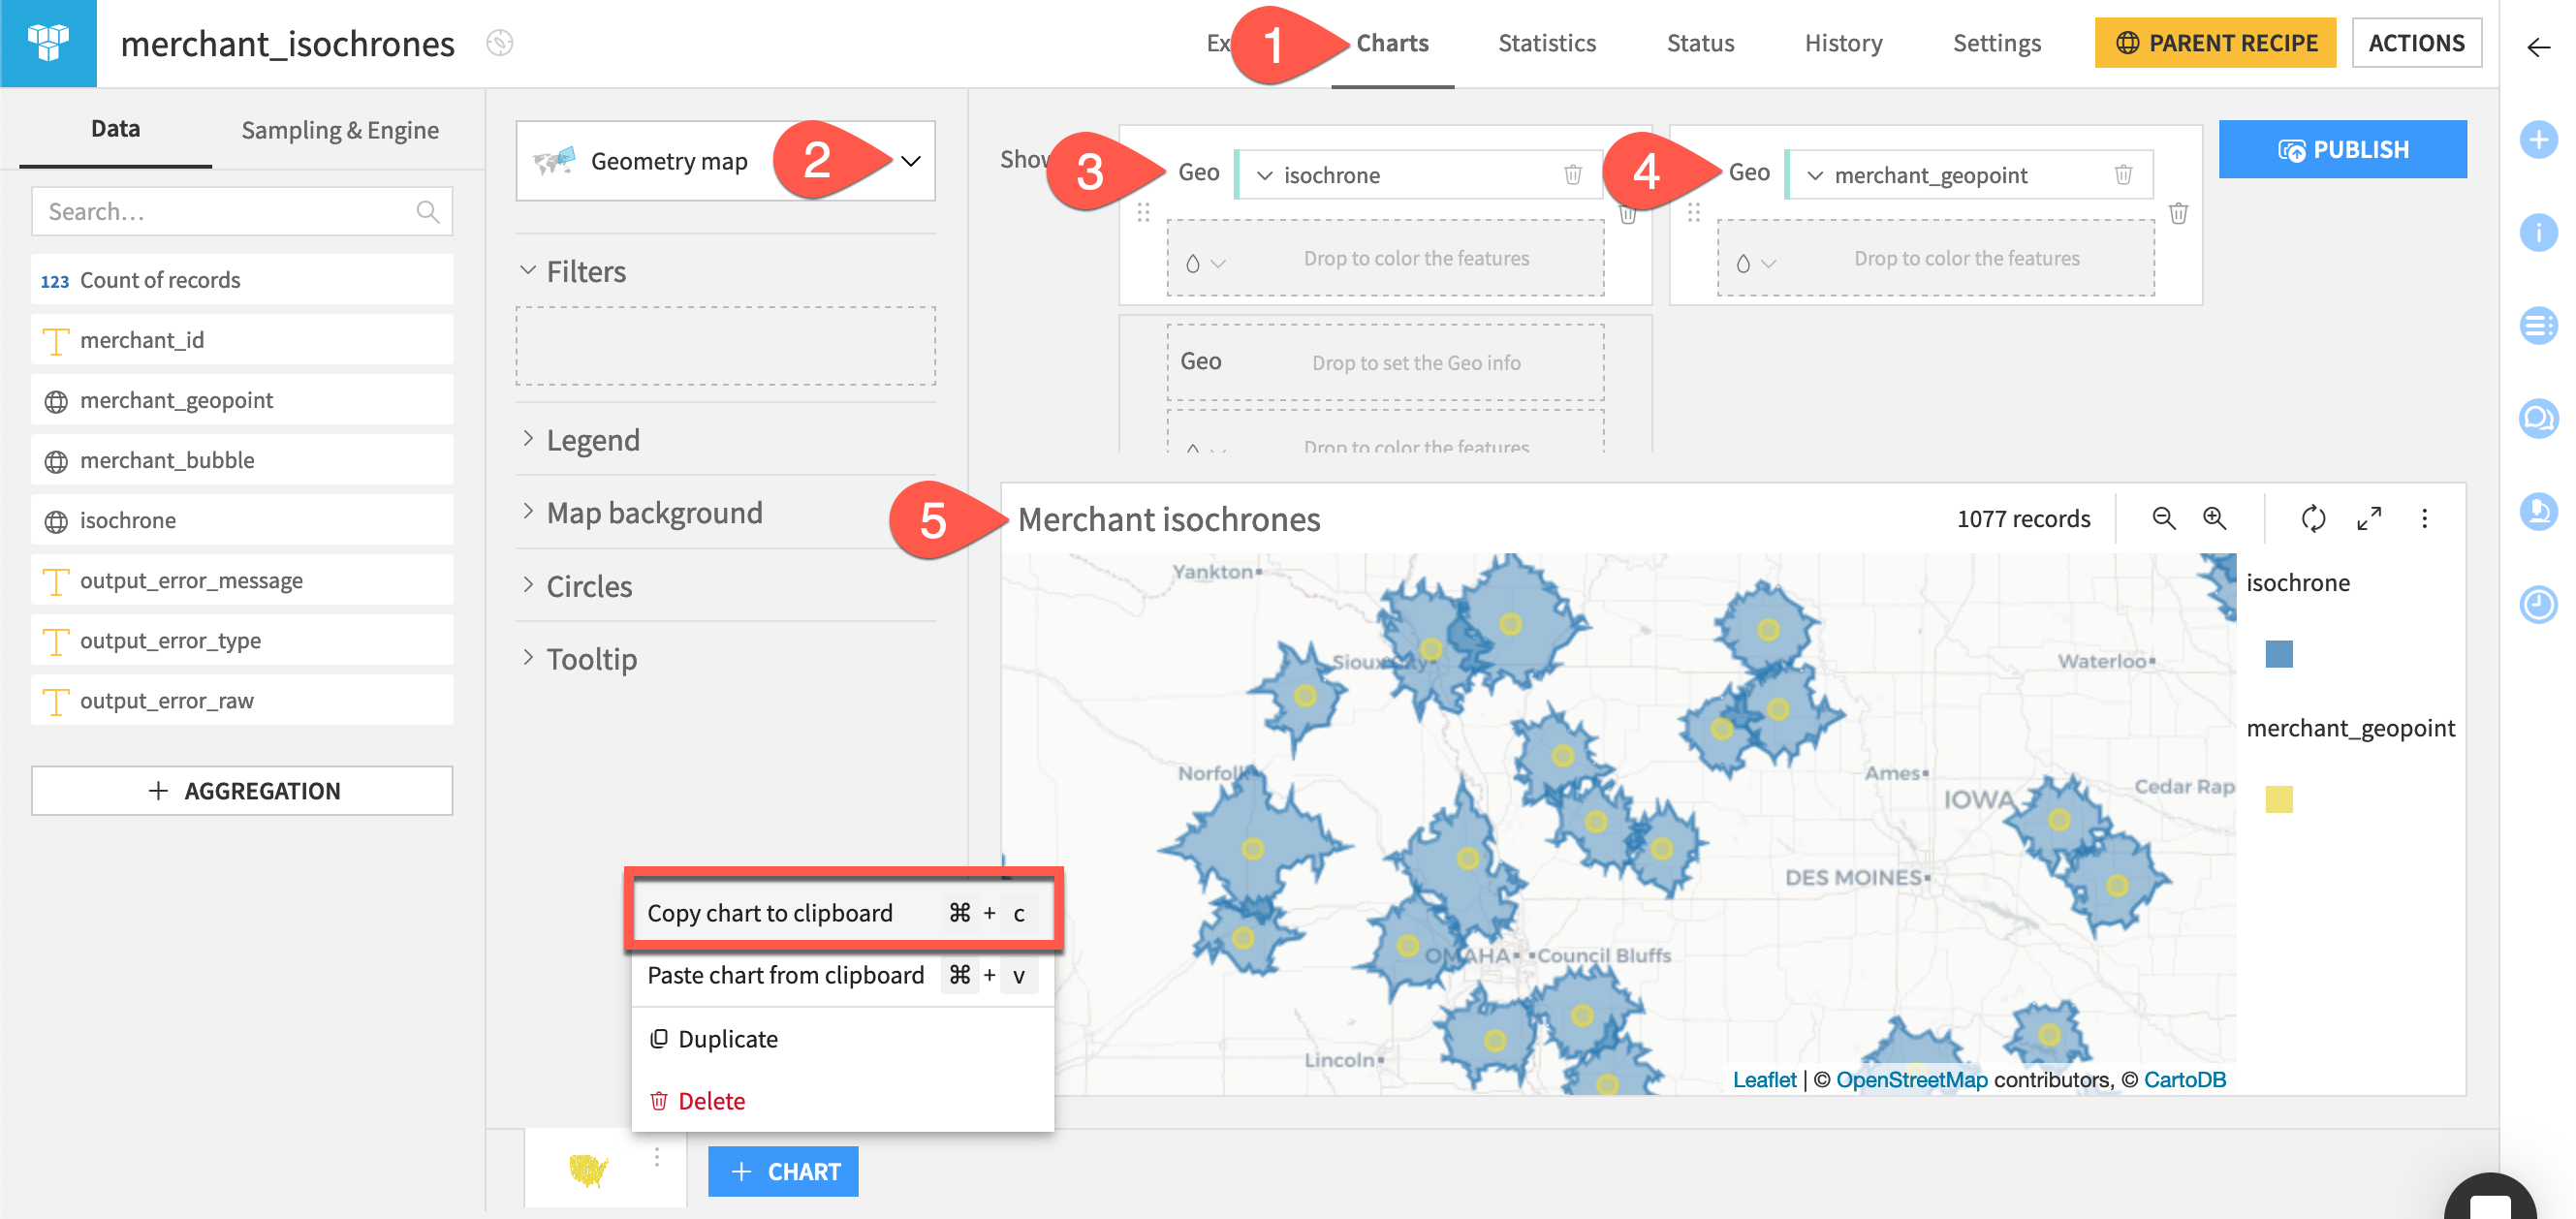
Navigate to the Charts tab of the merchant_isochrones dataset.
From the chart picker, select Geometry map.
Drag the isochrone column to the Geo field.
Drag merchant_geopoint to the next Geo field. Open the color droplet (
) to change the points to yellow.
Rename the chart
Merchant isochrones, and zoom in to explore the results.
Important
Unlike the uniform “as the crow flies” bubbles, isochrones are irregular because they reflect the ground level reality of traveling in any direction. This can vary significantly based on factors like traffic, speed limits, and the terrain.
Tip
If you’re unfamiliar with maps in Dataiku, see Tutorial | No-code maps.
Geo join merchant isochrones and card holder points#
Now that an isochrone representing the reachable distance around a merchant location exists, let’s find all card holders within those areas.
Change schema to geographic storage types#
The Geo join recipe requires join columns to have geopoint or geometry storage types. The cardholders dataset already has the correct storage types, but let’s make this adjustment now for the merchant_isochrones dataset.
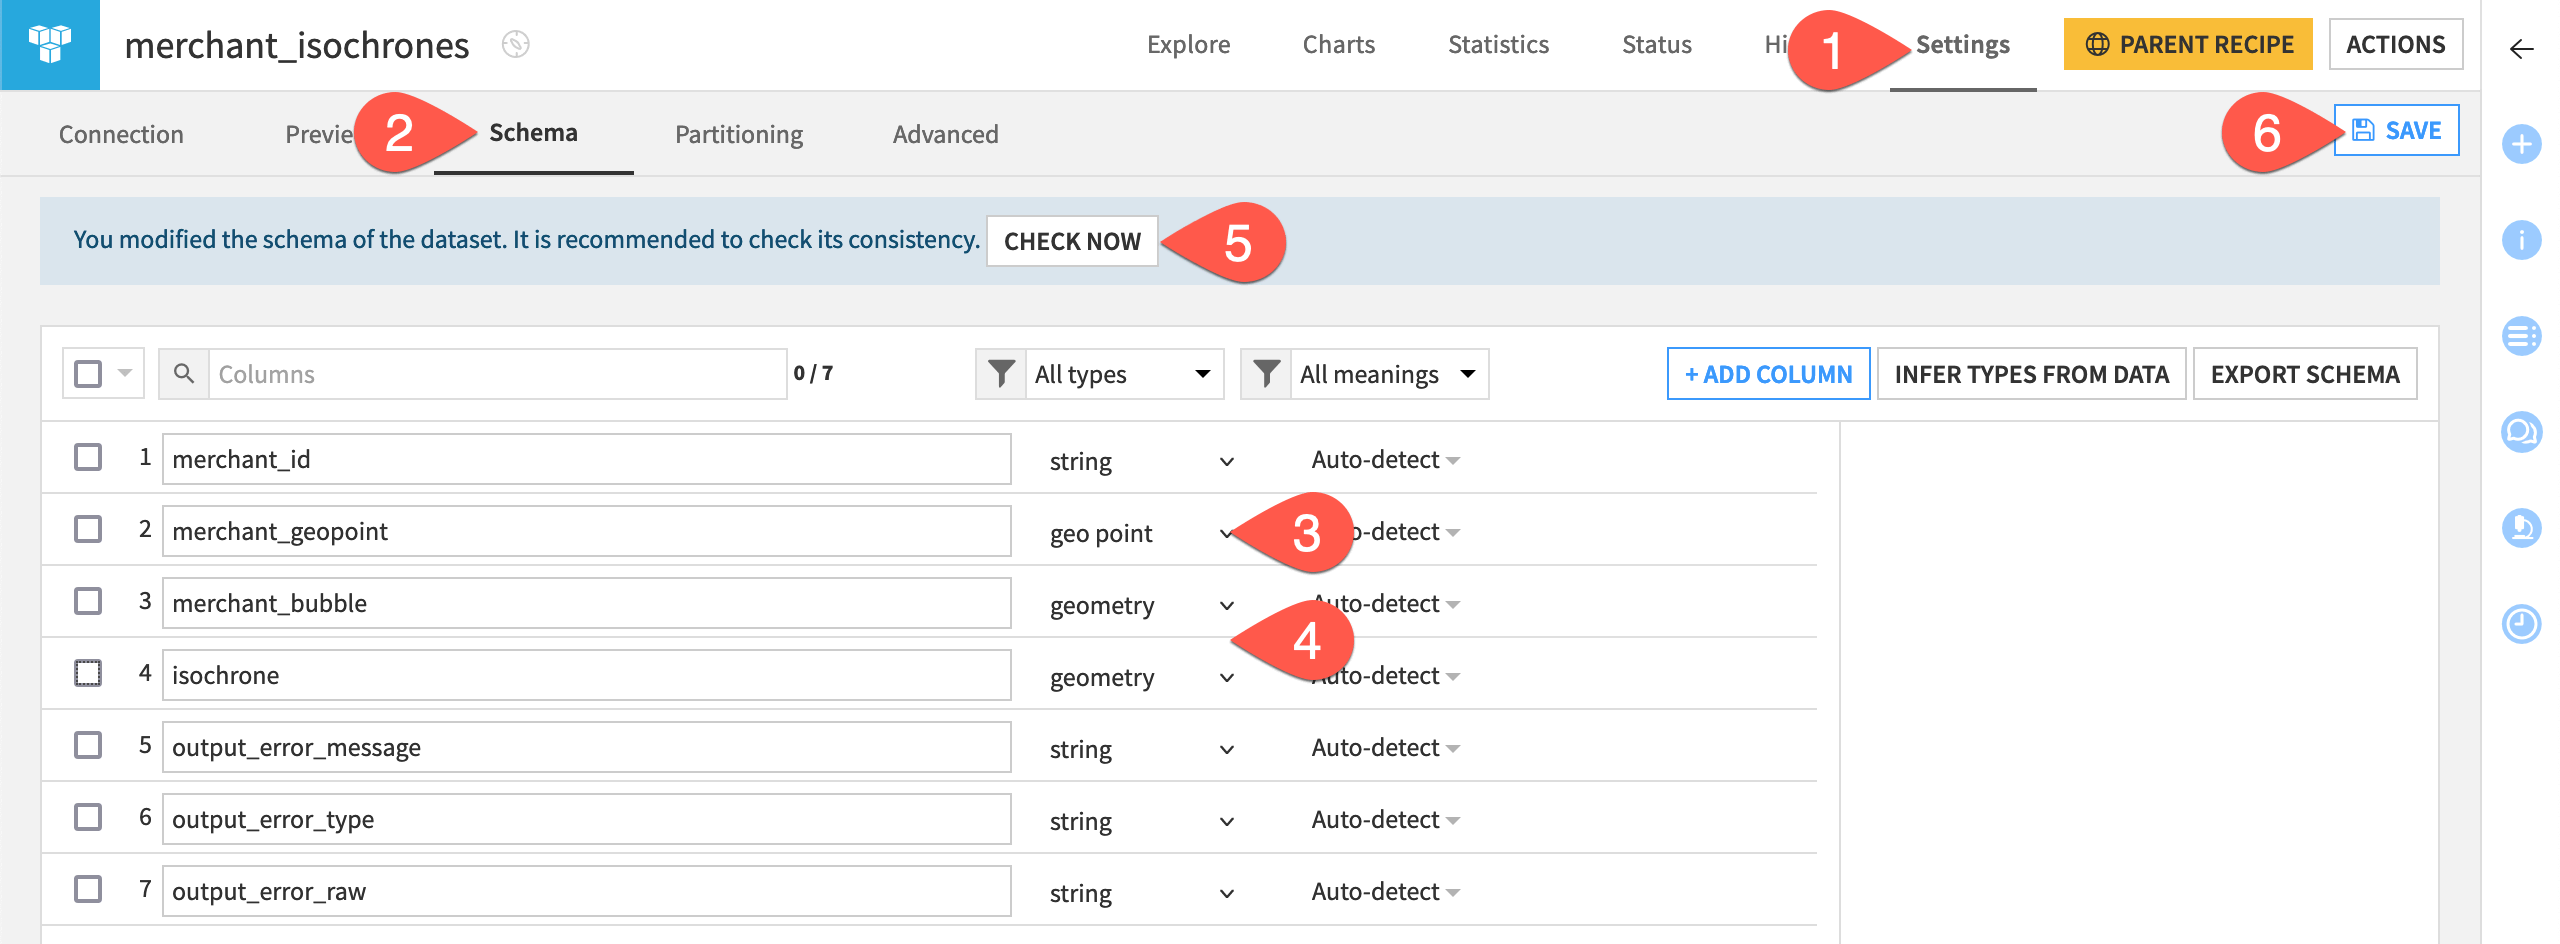
Navigate to the Settings tab of the merchant_isochrones dataset.
Navigate to the Schema subtab.
Change the storage type of merchant_geopoint from string to geo point.
Change merchant_bubble and isochrone to geometry.
Click Check Now.
Click Save.
Create a Geo join recipe#
With the correct storage types, we can proceed with geo joining the merchant and card holder data.
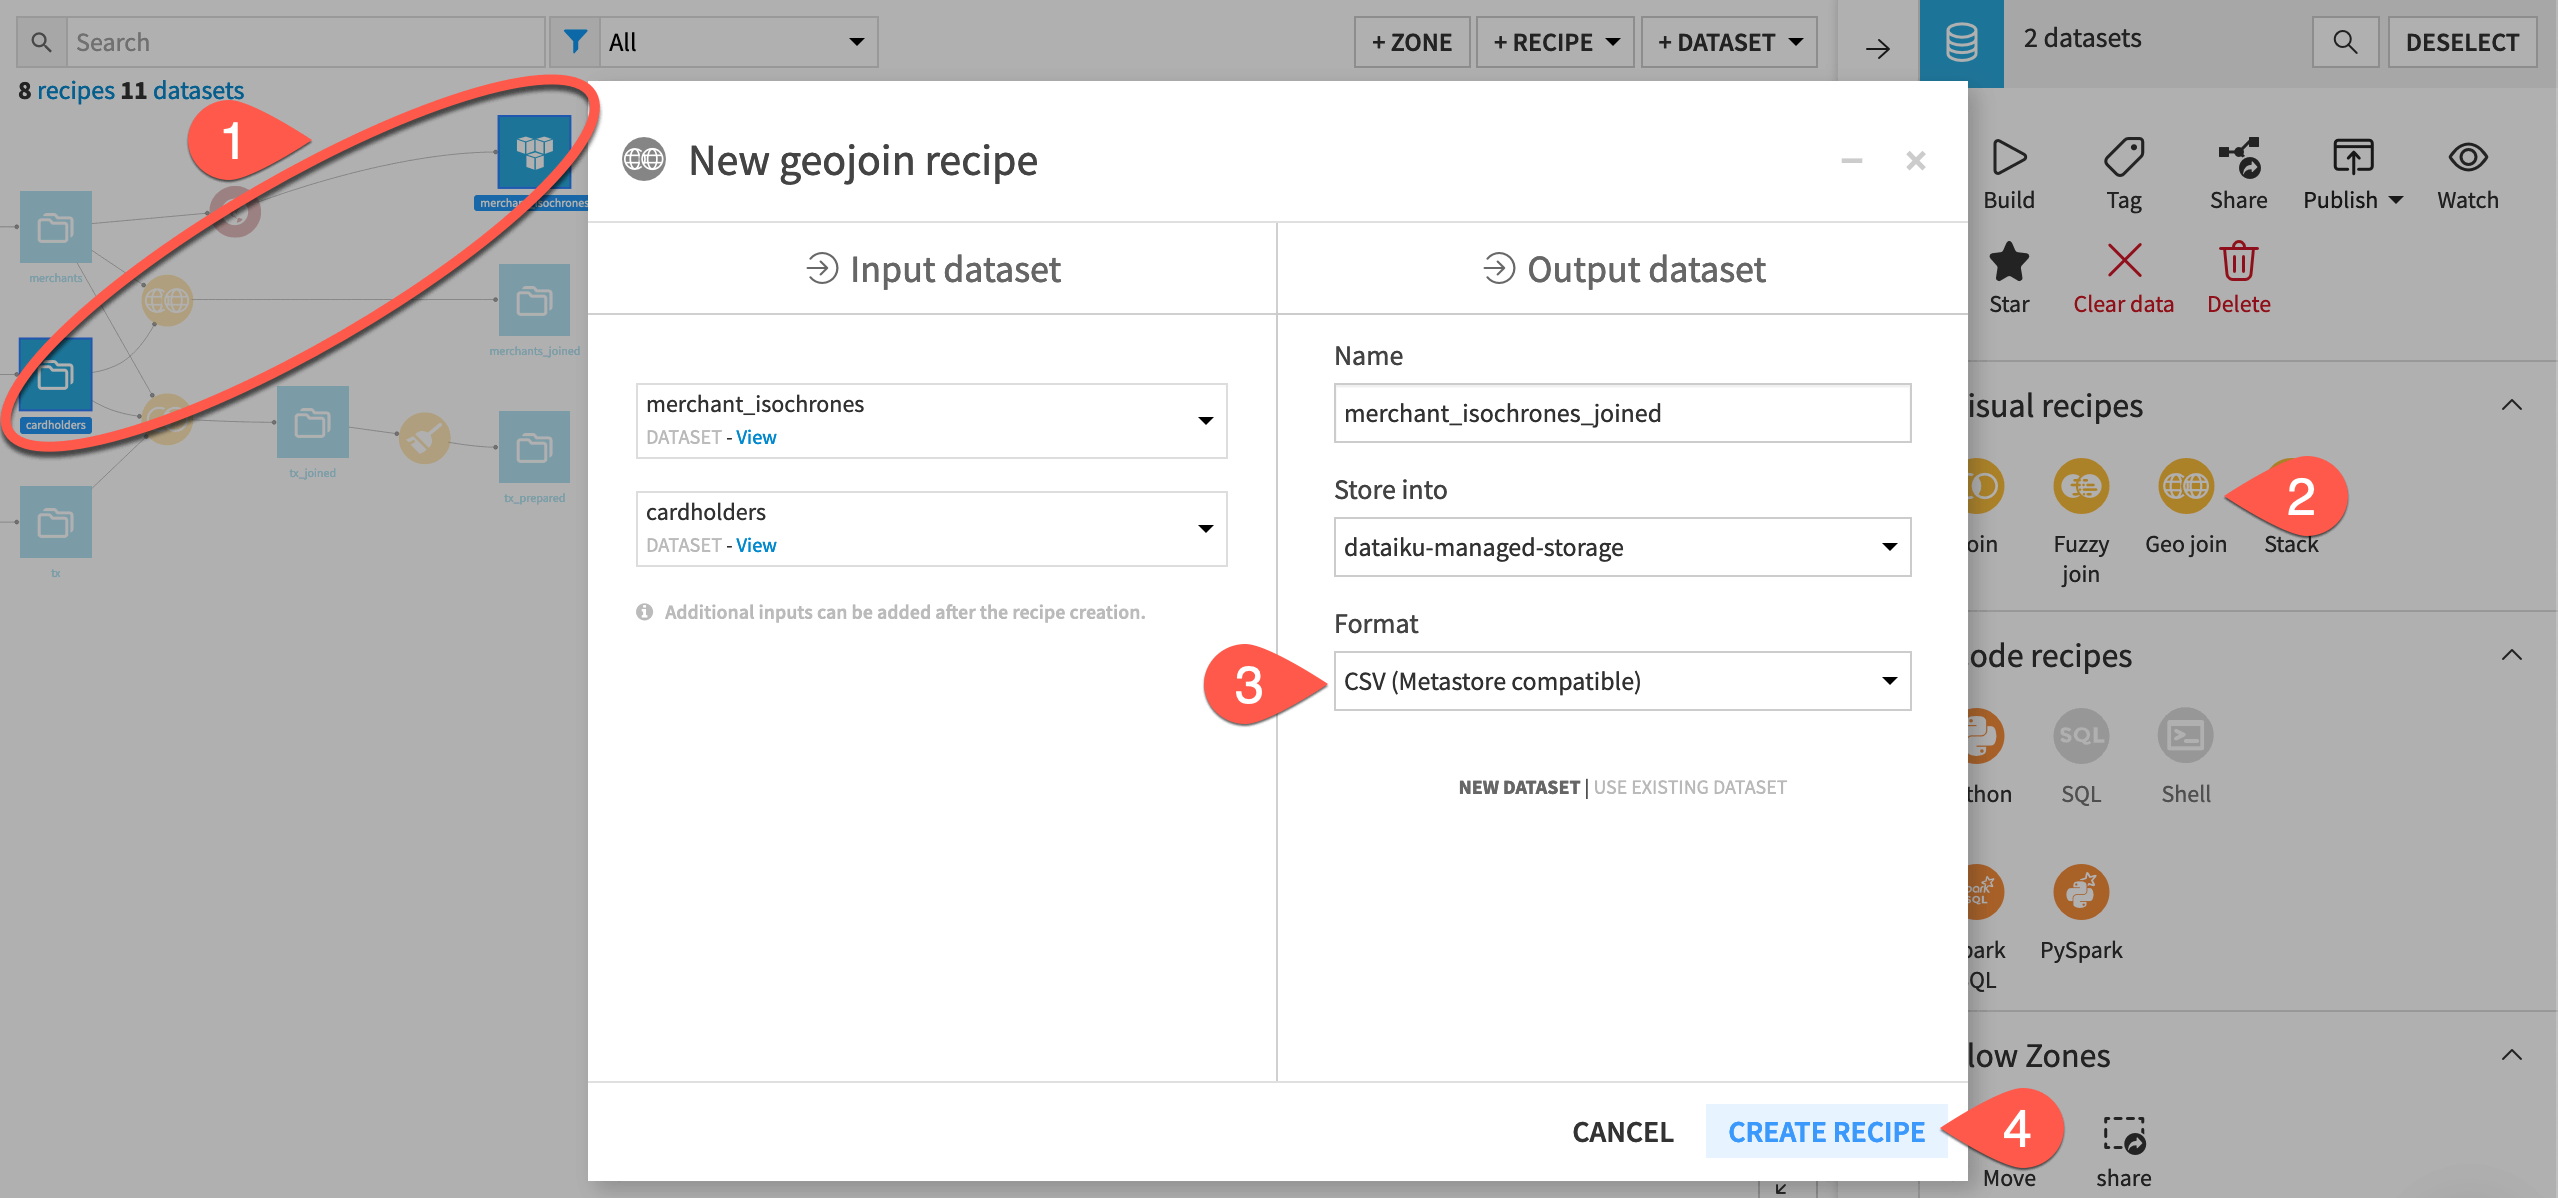
From the Flow, select the merchants_isochrones and cardholders datasets.
Open the Actions tab, and select Geo join from the menu of visual recipes.
Once again, if using an S3 storage, choose a format other than parquet, such as CSV (Metastore compatible).
Click Create Recipe.
Define the Geo join condition#
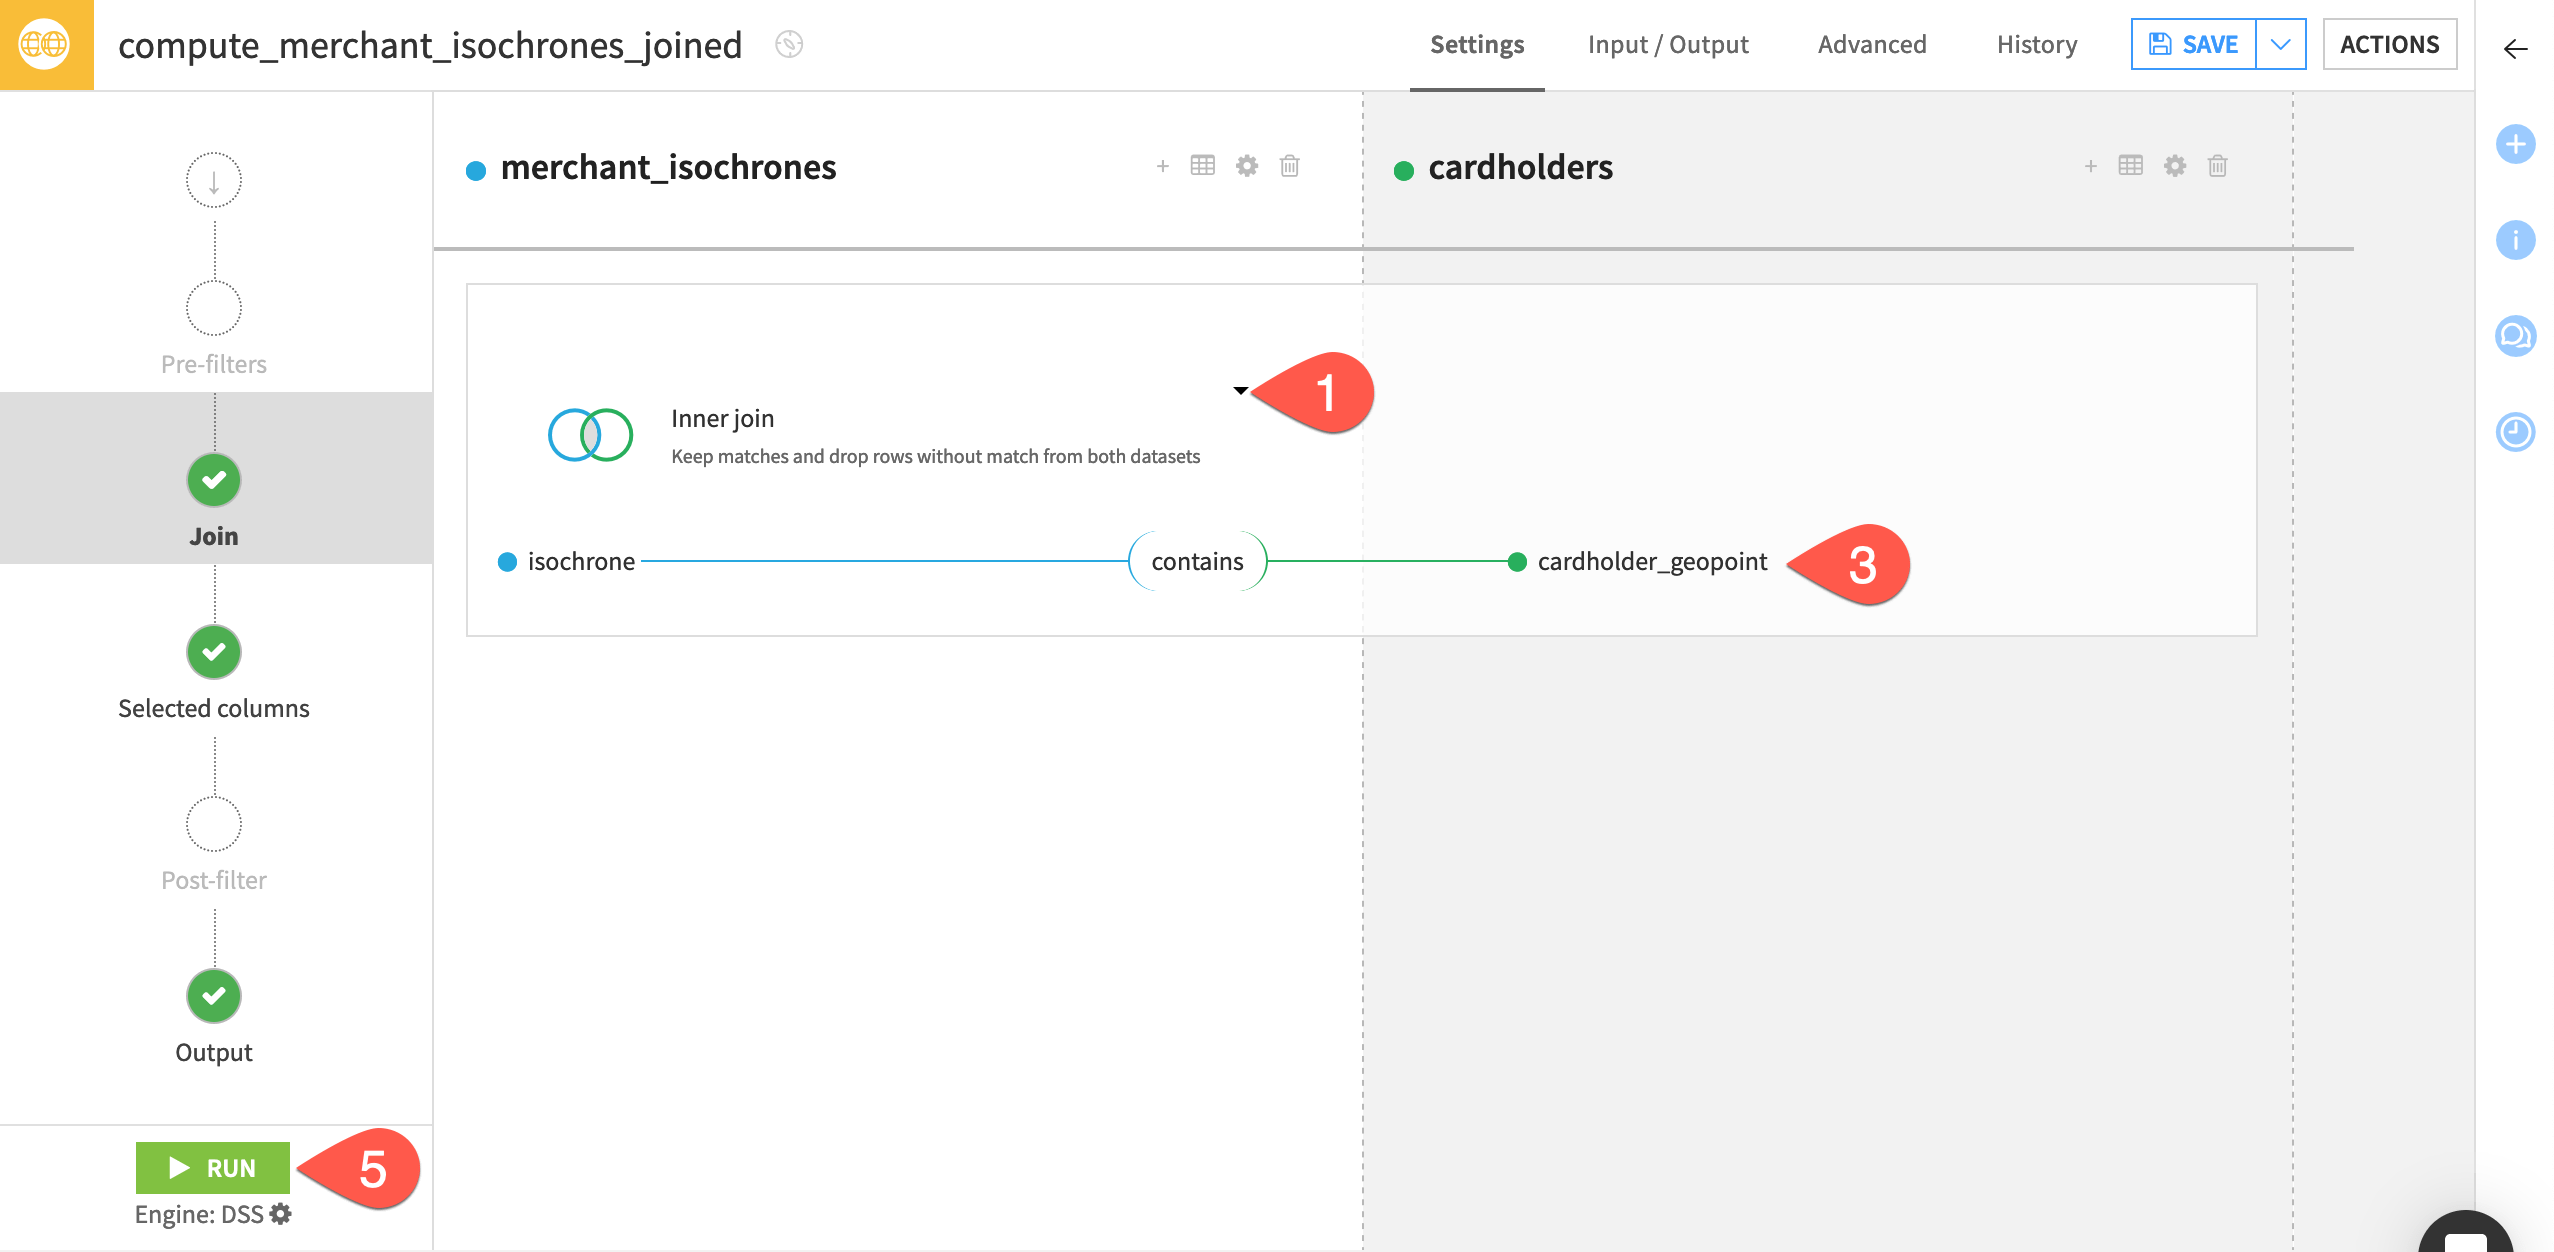
Now you can define the geographic condition on which to join these datasets. Let’s retain only merchants that have at least one card holder within the boundary of their isochrone.
Click Left join to open the dropdown, and switch to an Inner join.
Click on the join condition once to open it, and again to edit it.
Set the join condition so that the isochrone column from the merchant_isochrones dataset Contains the cardholder_geopoint column from the cardholders dataset.
Click OK.
Click Run.
Open the output dataset.
View card holders within isochrones on a map#
In the output, you’ll notice far fewer records. Many merchants don’t meet the condition of the inner join: they don’t have a card holder within their isochrone. On the other hand, some merchants have multiple card holders within their isochrone. They now appear in the dataset multiple times — one merchant record for every qualifying card holder.
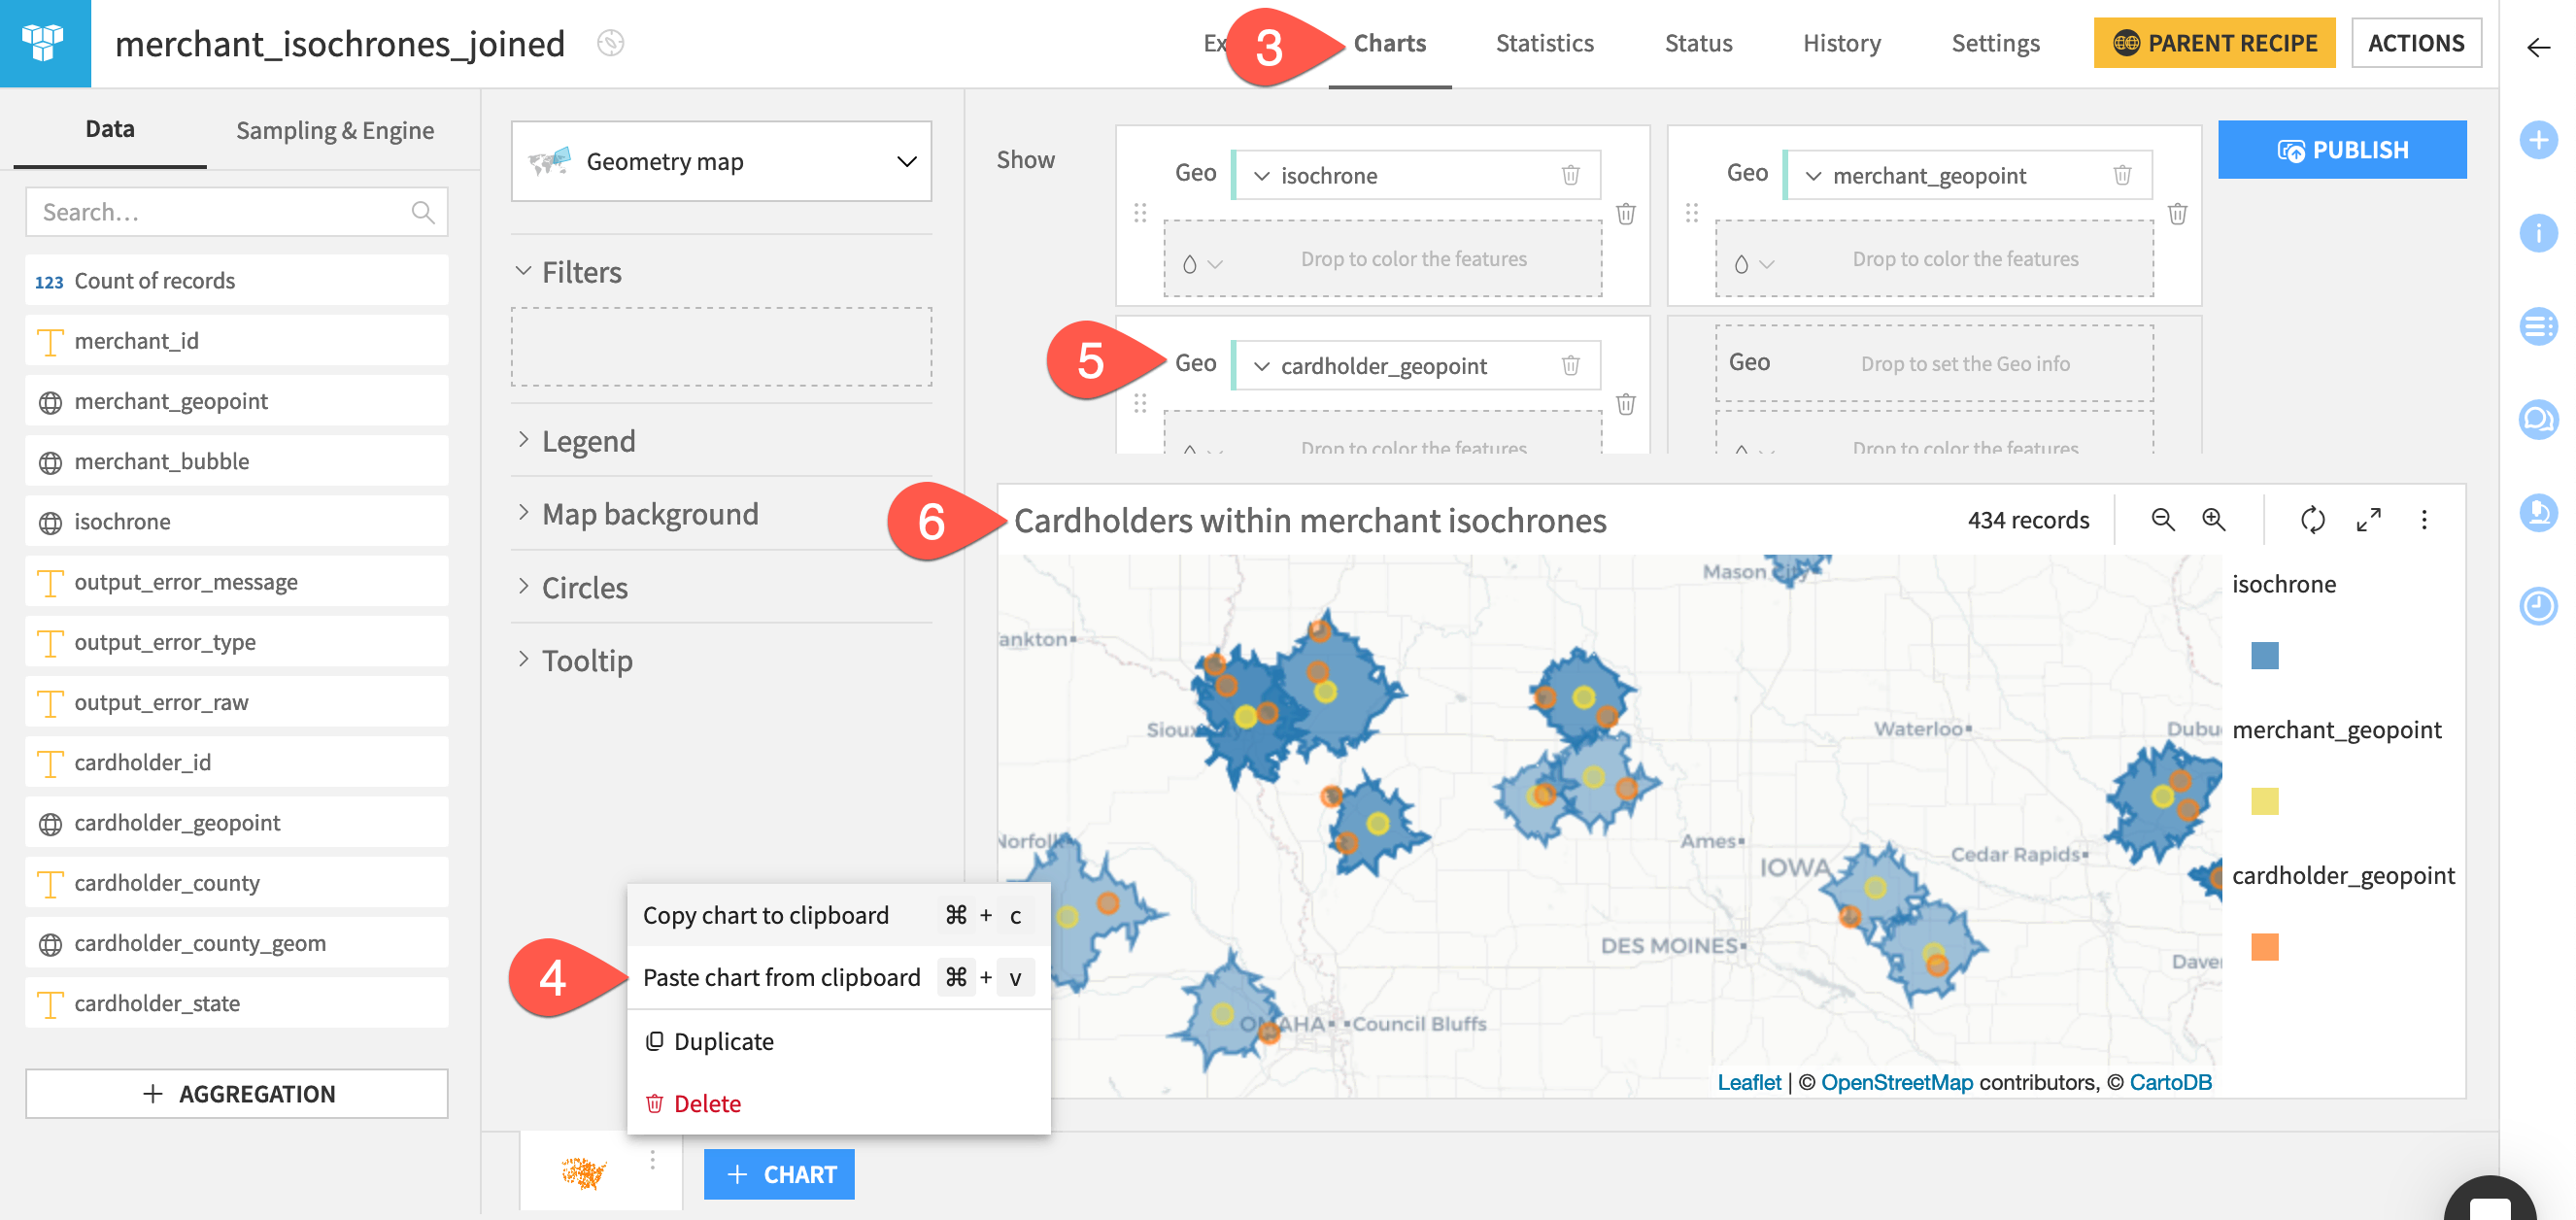
Once again, let’s confirm the results on a geometry map. You can start by copy-pasting the settings of the previous chart.
Return to the previous map. One way to get there via the Flow is through the Details (
) tab of the merchants_isochrones dataset’s right panel.
Open the vertical dots (
) menu at the bottom left, and click Copy chart to clipboard (as shown in the previous map image).
Navigate to the Charts tab of the merchants_isochrones_joined dataset.
Open the vertical dots (
) menu at the chart’s bottom left. Select Paste chart from clipboard. Follow the prompt to Paste and Replace the empty chart.
Drag cardholder_geopoint to the next Geo field.
Rename the chart
Cardholders within merchant isochrones, and zoom in to verify that every remaining card holder lies within a merchant isochrone.
Compute routes between points#
You’ve found the card holders within a certain driving distance from a merchant. Now compute the actual routes the card holders would use to reach the merchants!
Create a recipe to compute routes#
The first step is to set up the recipe.
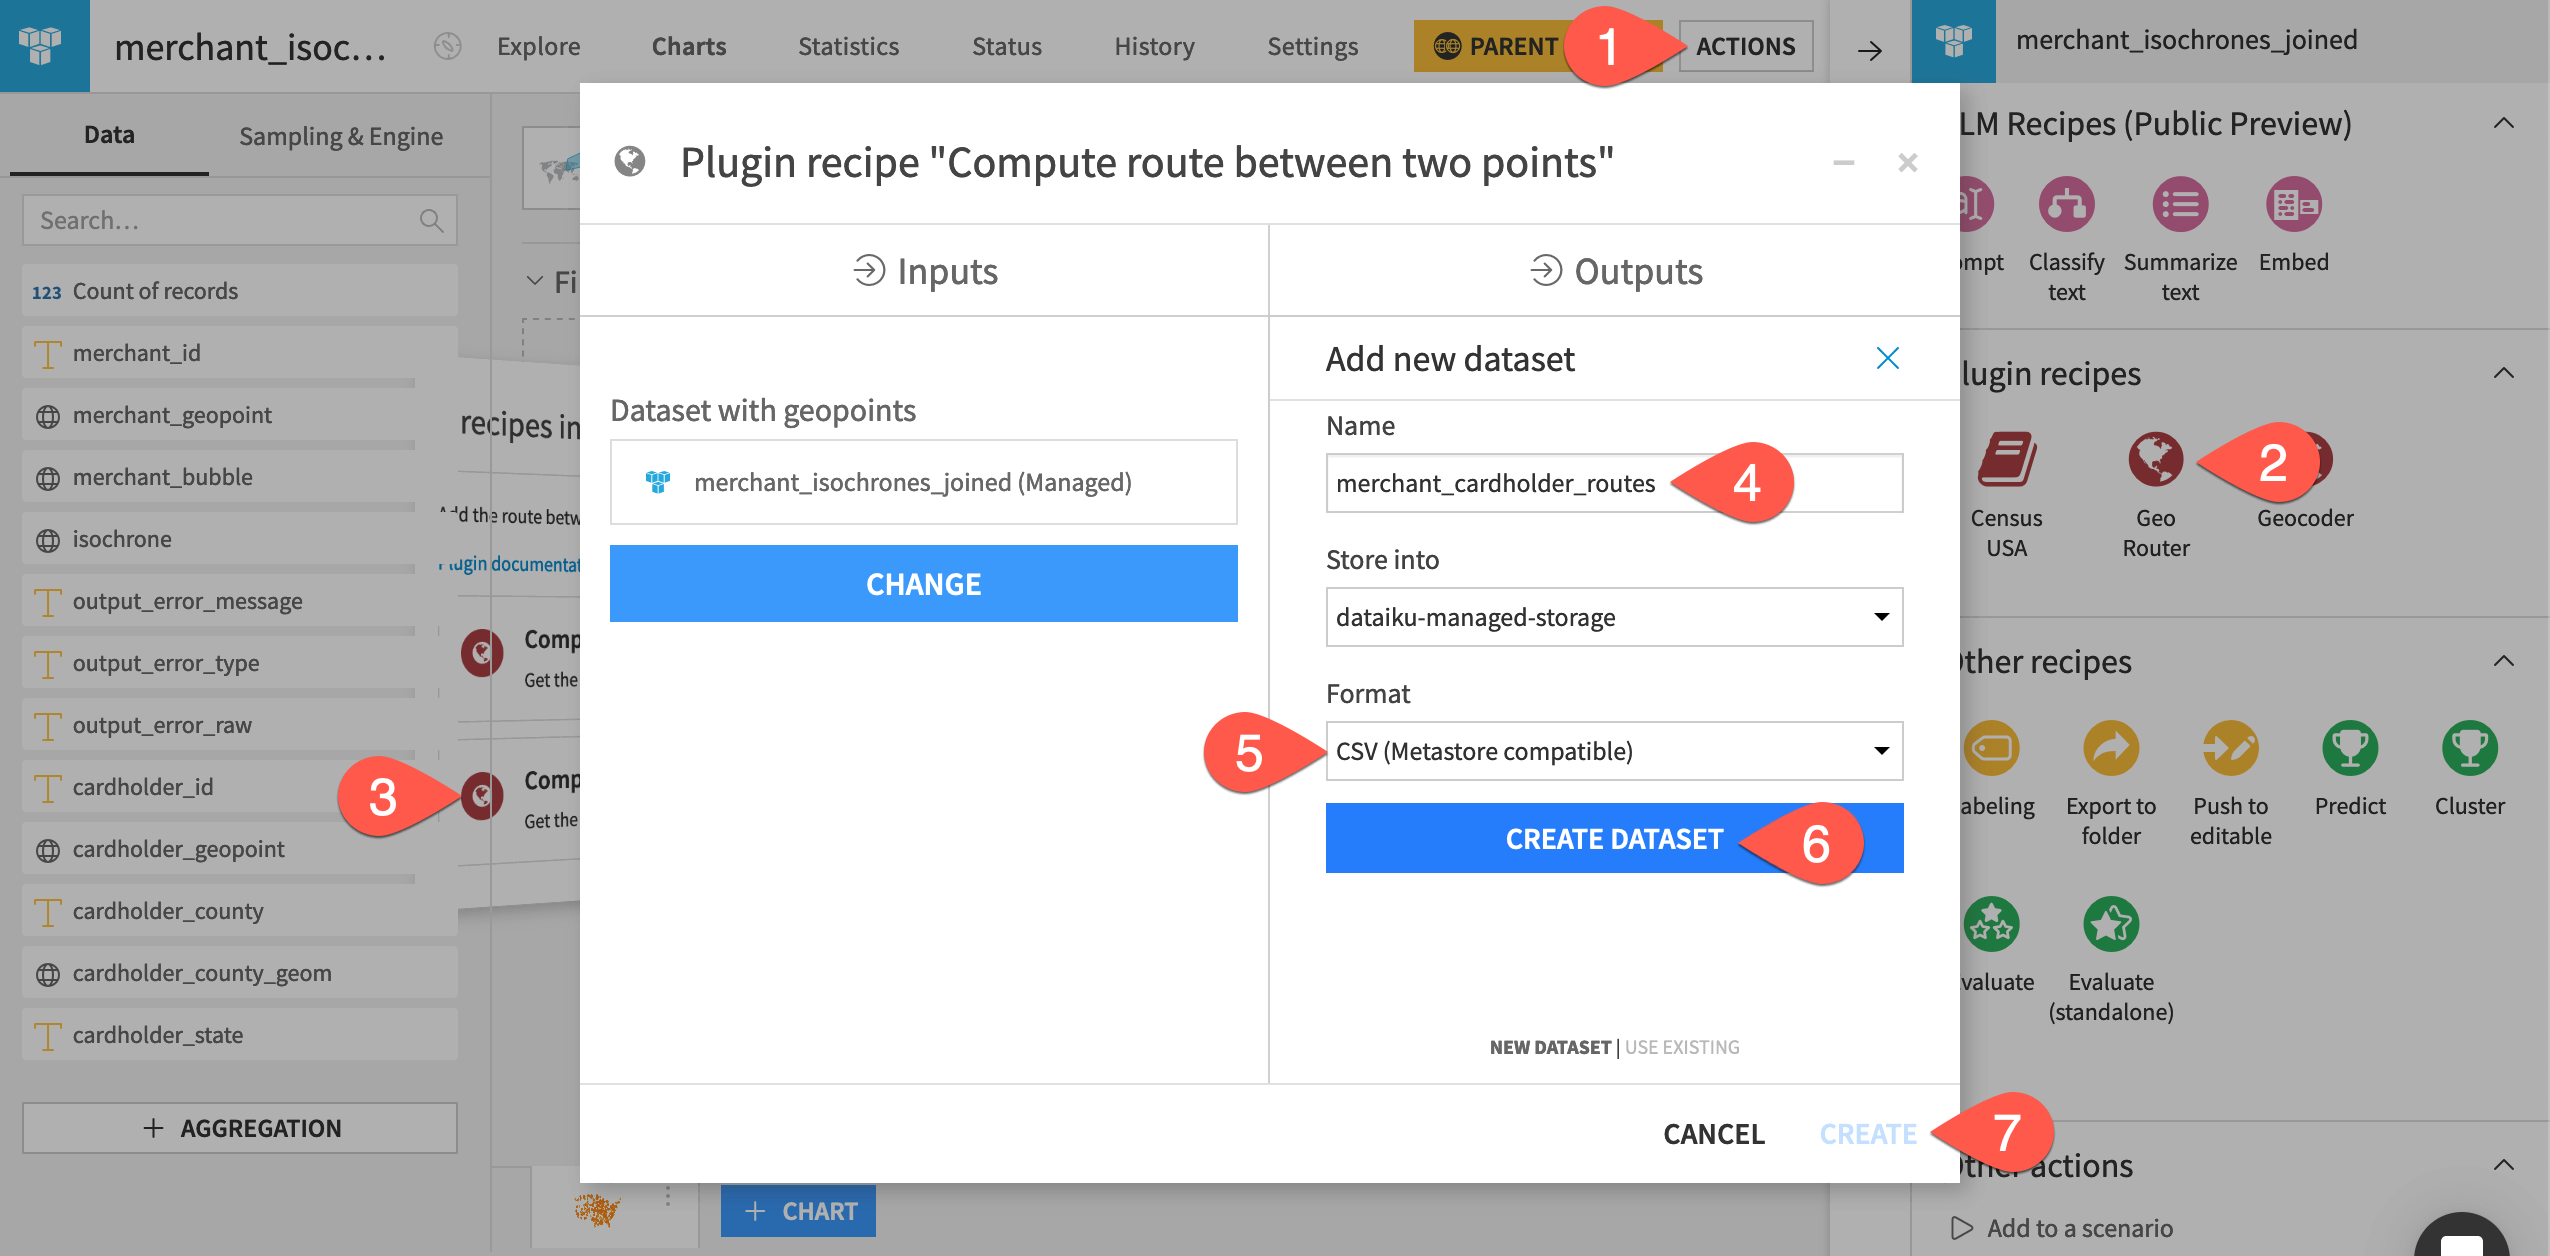
Open the Actions tab of the merchants_isochrones_joined dataset.
Select Geo Router from the menu of plugin recipes.
Select the Compute route between two points recipe.
Set the routes dataset as
merchant_cardholder_routes.As before, avoid using a parquet storage format.
Click Create Dataset.
Create the recipe.
Define route computation settings#
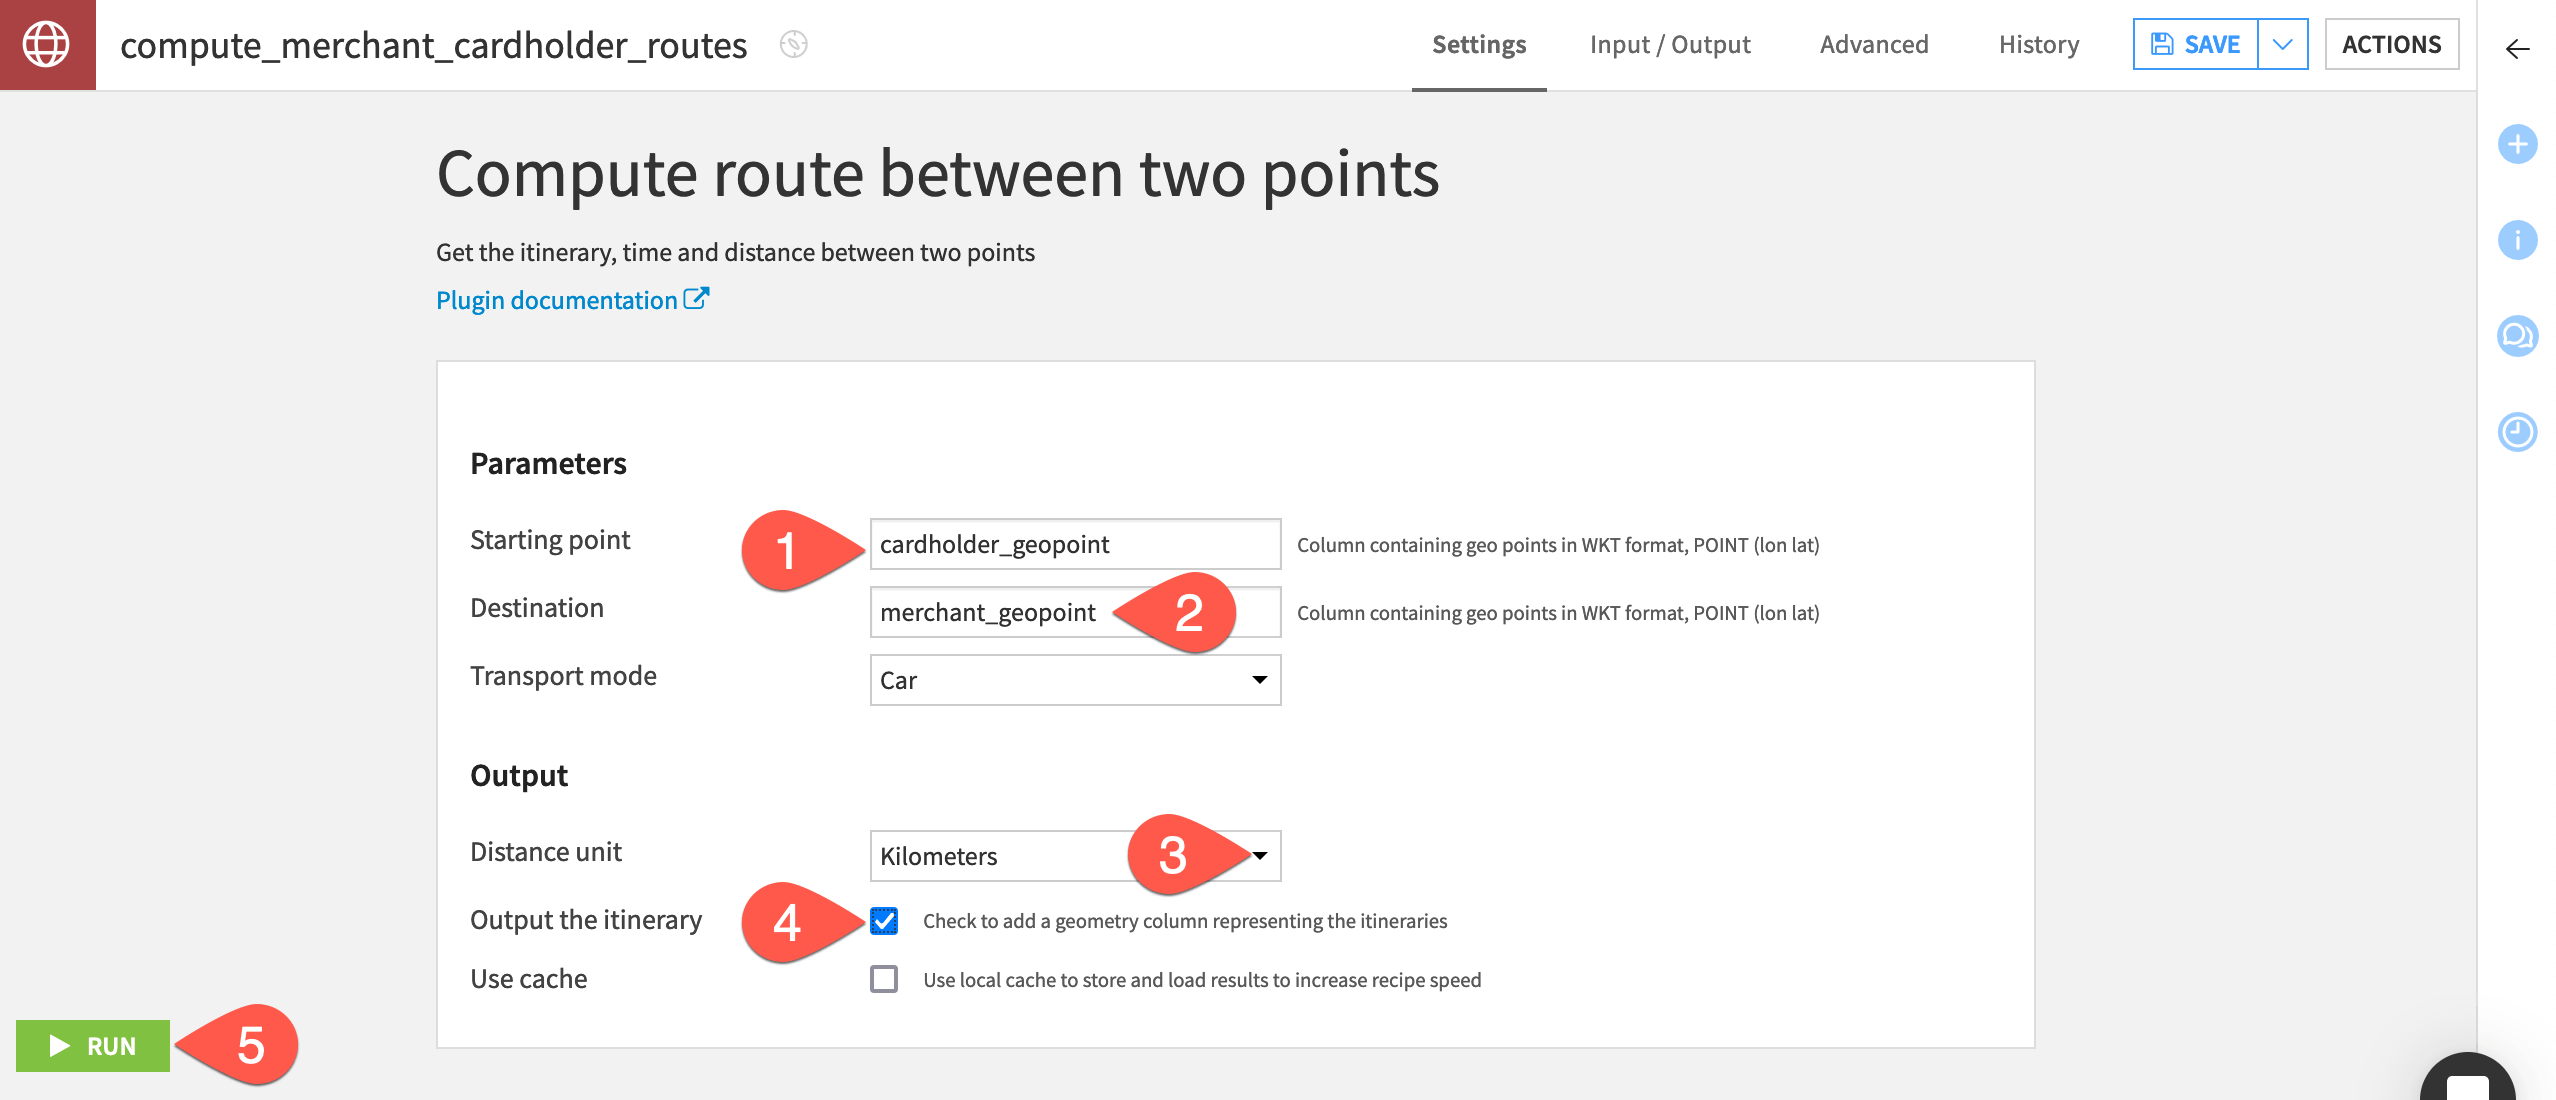
Once that’s in place, define the recipe’s parameters.
On the Settings tab of the recipe, set the starting point as cardholder_geopoint.
Set the destination as merchant_geopoint.
Set the distance unit to Kilometers.
Check the box to Output the itinerary as a geometry column.
Click Run, and open the output dataset when it’s finished.
Map routes between points#
In addition to three more columns for reporting errors, the output contains three new columns:
Column |
Contents |
|---|---|
time |
The estimated driving time between the merchant and card holder points. |
distance |
The length of the route in kilometers (as chosen in the recipe). |
itinerary |
A linestring geometry mapping the route between the points. |
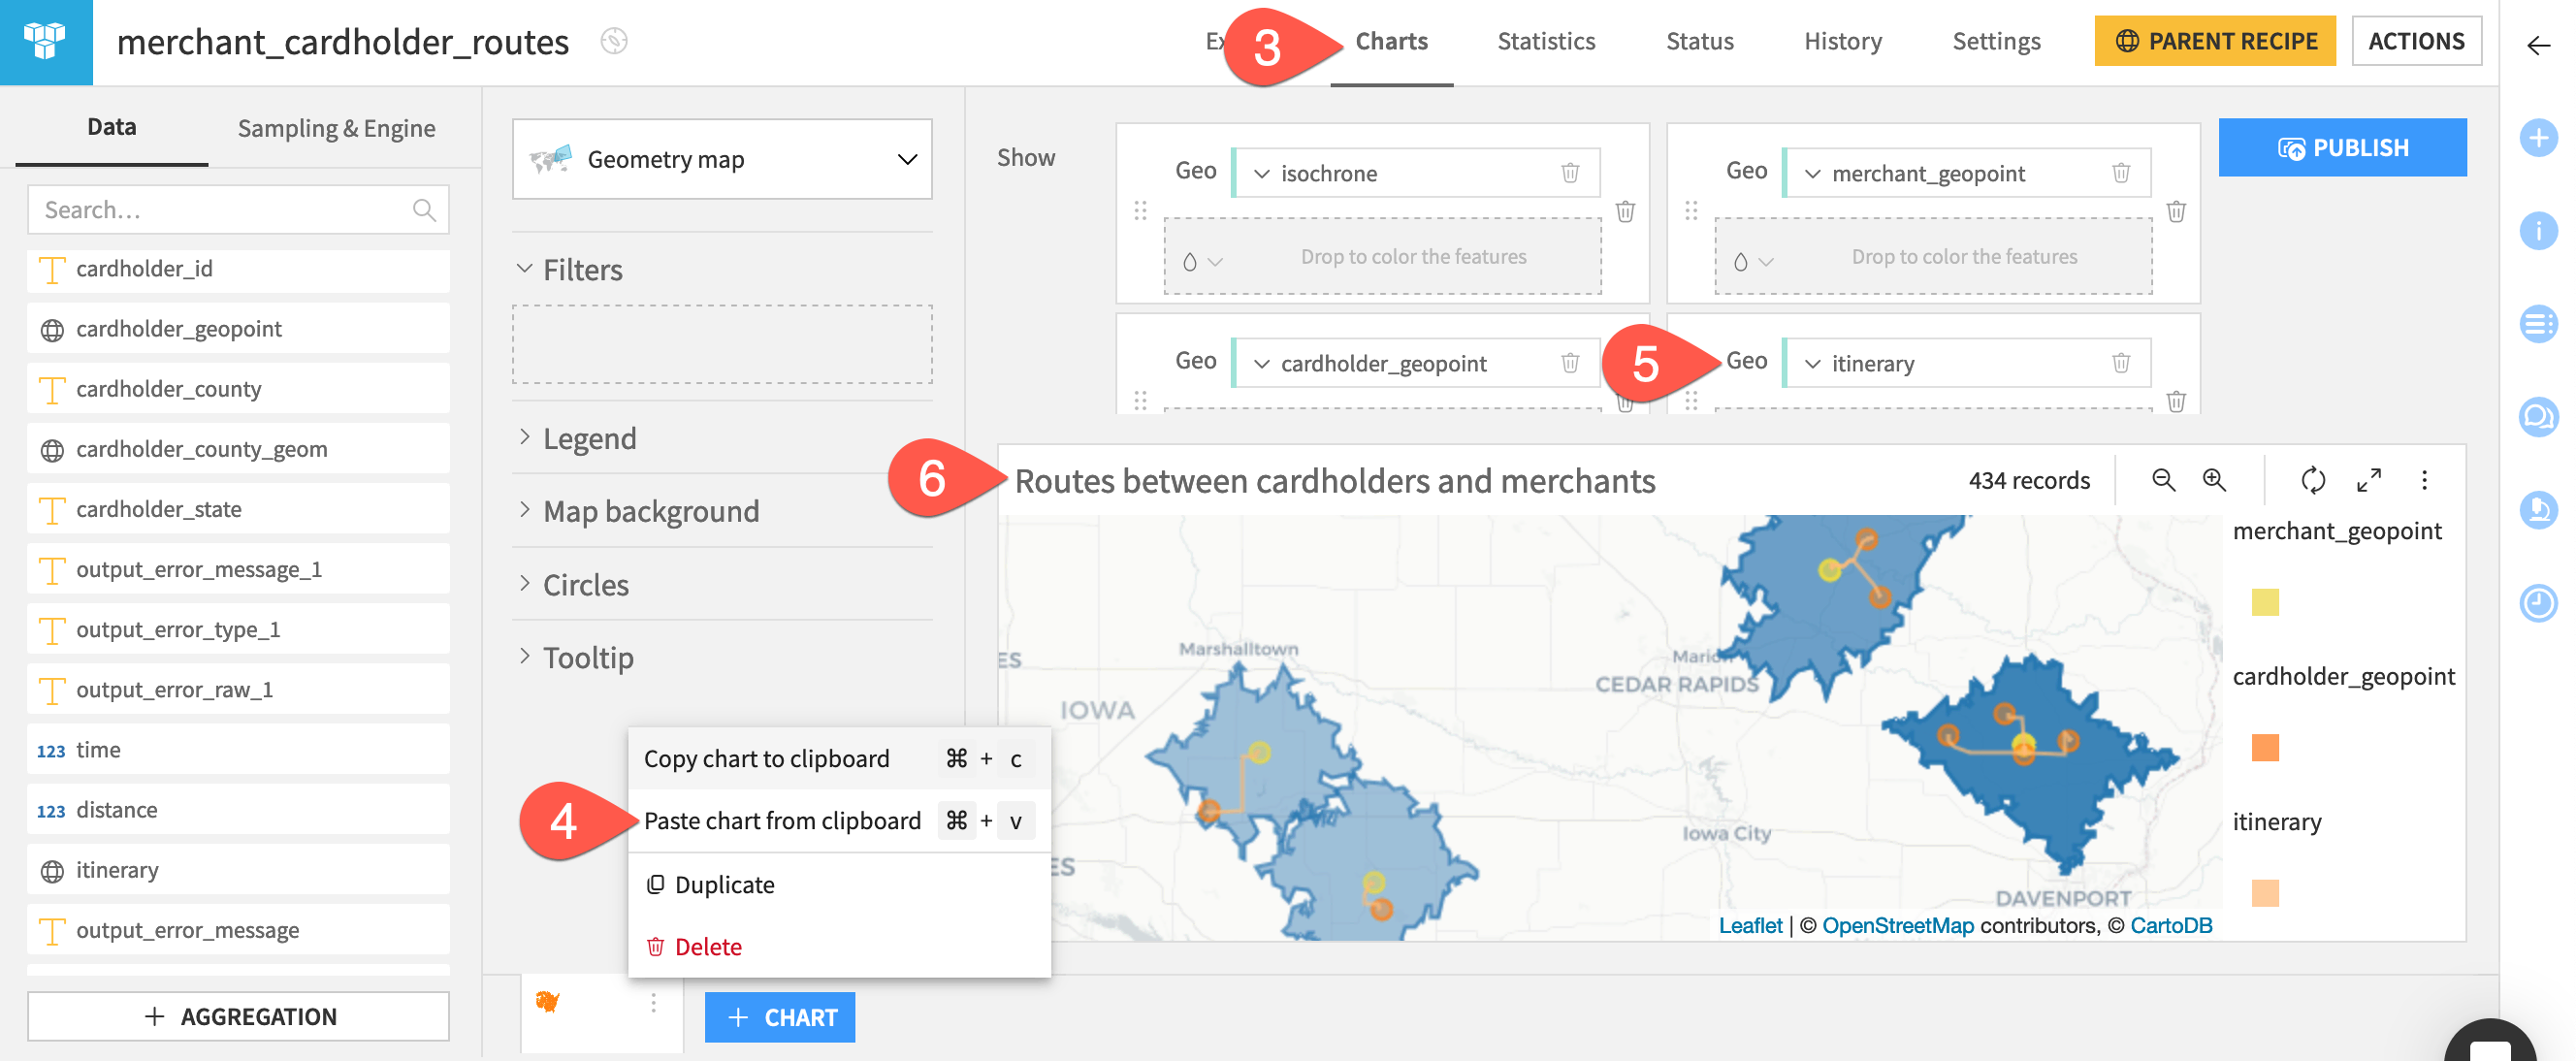
Once more, let’s check the results on a geometry map. Again, copy-paste the previous map as the base for the new map.
Return to the previous map. One way to get there is through the Details tab of the merchants_isochrones_joined dataset in the Flow.
Open the vertical dots (
) menu at the bottom left, and click Copy chart to clipboard.
Navigate to the Charts tab of the merchant_cardholder_routes dataset.
Open the vertical dots (
) menu at the chart’s bottom left. Select Paste chart from clipboard. Follow the prompt to Paste and Replace the empty chart.
Drag itinerary to the fourth Geo field.
Rename the chart
Routes between cardholders and merchants, and zoom in to verify that every remaining card holder lies within a merchant isochrone.
Next steps#
Congratulations! You’ve computed isochrones around a location and routes between two points. These can be especially useful techniques when the “as the crow flies” distance isn’t as relevant as real-world travel conditions.
See also
For more information, see the reference documentation on Georouting and isochrones or the Geo Router plugin page.
You can also find an example gallery project demonstrating many of Dataiku’s geographic features.
Once you are comfortable working with geographic data in Dataiku, you may wish to explore additional geographic functionality offered through other plugins. For an example, try Tutorial | Working with shapefiles and US census data or explore the OpenStreetMap Enrichment plugin!
Tip
You can find this content (and more) by registering for the Dataiku Academy course, Geospatial Analytics. When ready, challenge yourself to earn a certification!

