
Tutorial | Explore the Flow#
The Flow is the visual representation of your project pipeline.
In this tutorial, we’ll use a project that contains a few datasets and visual recipes (Prepare, Group and Join), so we can review the Flow.
Get started#
Objectives#
In this tutorial, you will:
Learn about features for understanding a Flow.
Understand Dataiku’s visual grammar.
Create the project#
From the Dataiku Design homepage, click + New Project.
Select Learning projects.
Search for and select Explore the Flow.
If needed, change the folder into which the project will be installed, and click Create.
From the project homepage, click Go to Flow (or type
g+f).
Note
You can also download the starter project from this website and import it as a ZIP file.
Navigate the Flow#
There are several ways to navigate to the Flow. You can do it by:
Clicking the Go to Flow button on the project homepage.
Selecting the first menu to the right of the project title in the top navigation bar.
Using the keyboard shortcut
g+f.
See also
See Accessibility in the reference documentation for a full list of keyboard shortcuts.
In this tutorial, let’s follow this procedure:
Click on the Flow icon next to the project name in the top navigation bar to go to the project Flow.
Explore it.
As you can see, the Flow here is quite basic, but it can be helpful to be aware of a few features for navigating more advanced Flows:
Flow zones (1) for separating stages of a project.
The search box and filter icon (2) to find objects.
The Flow views menu (3) for many different thematic visualizations of your project.
The Preview menu (4) that allows previewing a dataset when you select one of them.
The Flow actions menu (5) for building and exporting the Flow.
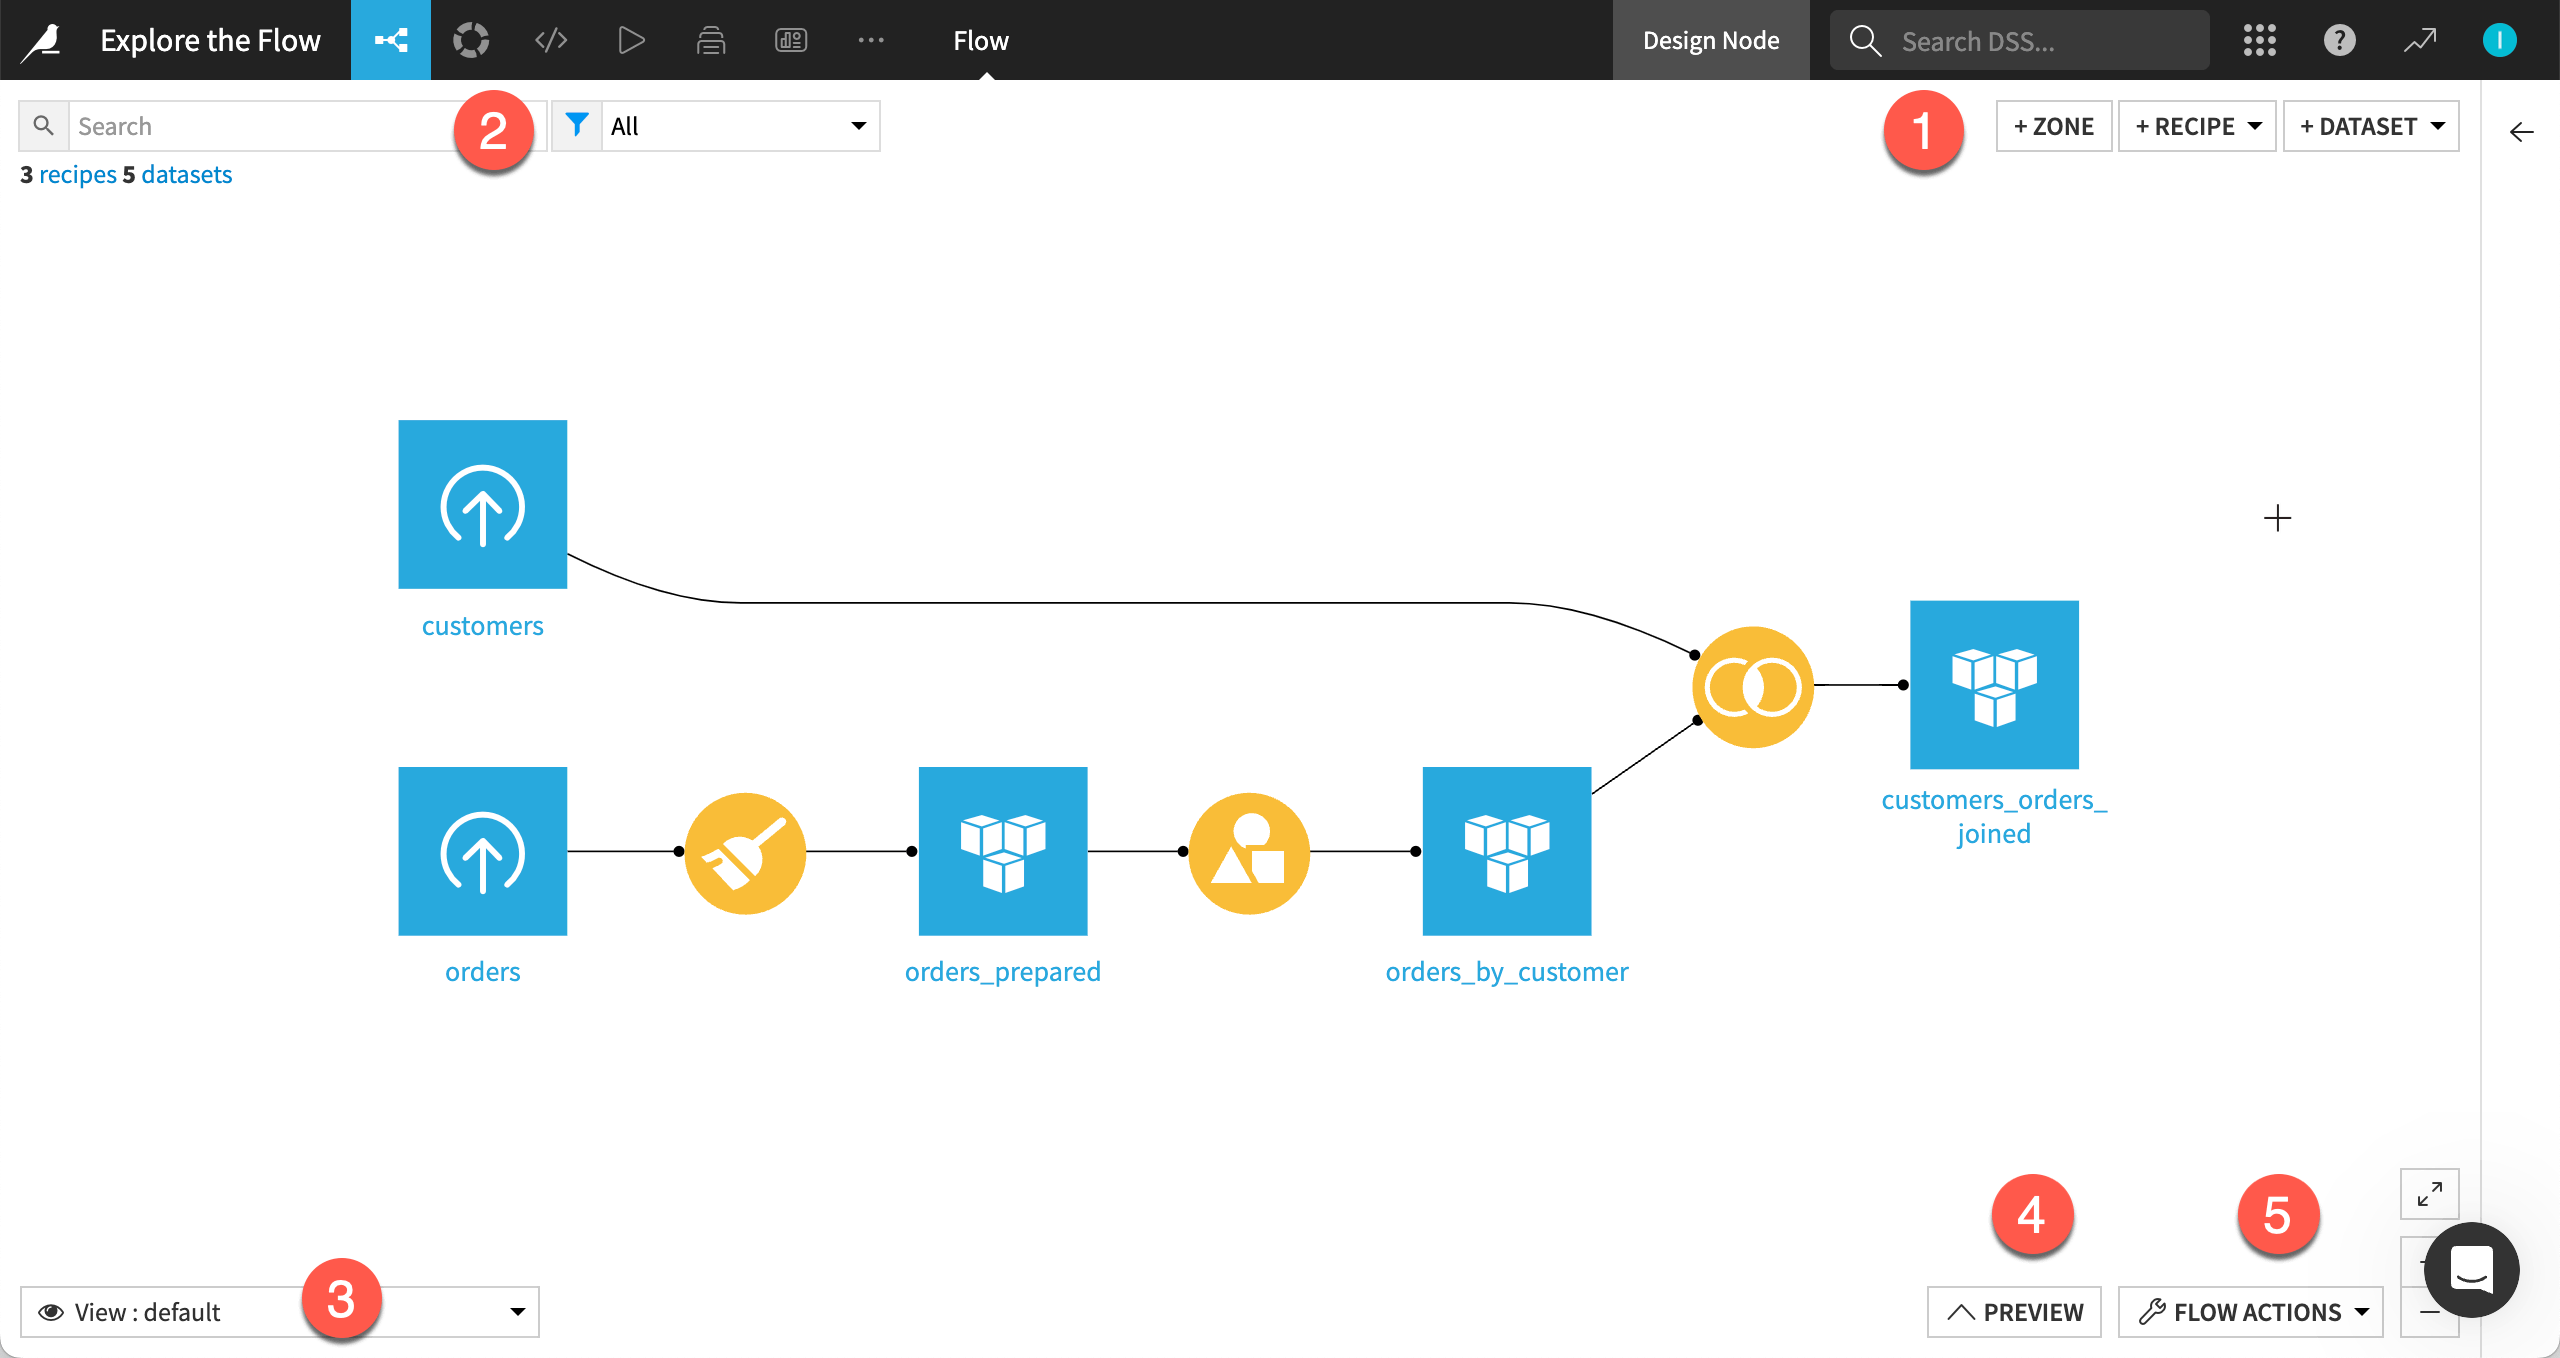
Explore Dataiku’s visual grammar#
Take some time to study the Flow. You’ll notice that shapes and colors have specific meanings in Dataiku.
A blue square represents a dataset.
A yellow circle represents a visual recipe.
The icons on the objects indicate the type of dataset or recipe.
Note
As you build more advanced projects, you’ll see more of this visual grammar on display:
A diamond shape for machine learning models.
The color green for all machine learning elements.
Orange circles for code recipes and (often) red for plugin recipes.
Black squares for datasets shared from other projects.
Next steps#
Continue to Tutorial | Flow management and views to learn more about how to use zones to improve the readability of your Flow.