Concept | Data lineage#
Watch the featurette

The Data Lineage view allows you to track where data originated, how and where it changed over time, and its journey through your data pipeline.
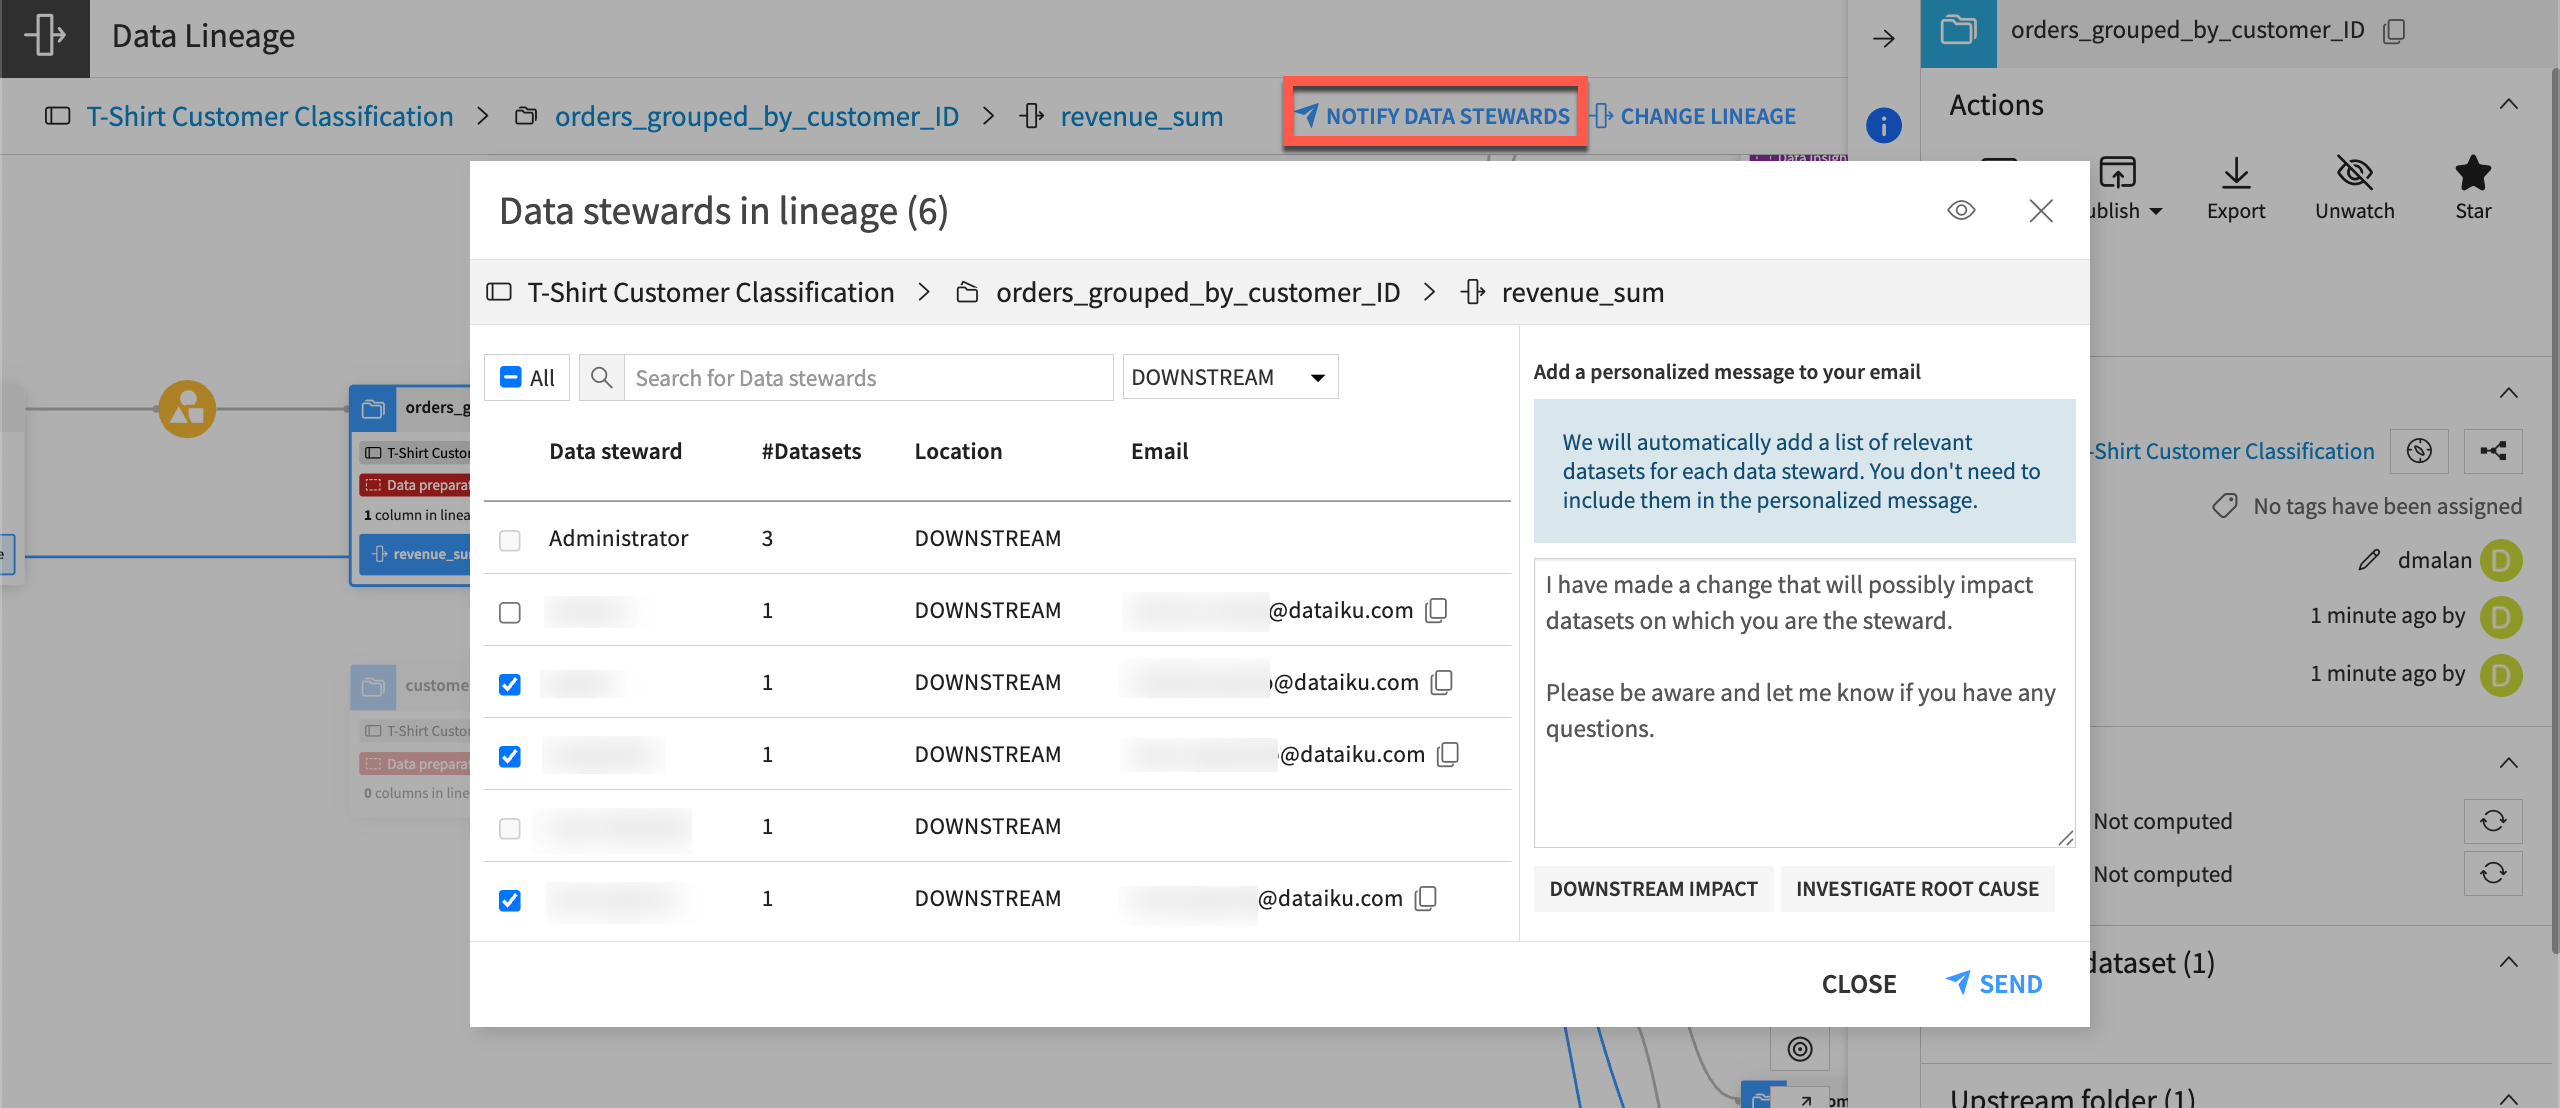
Data Lineage can help you investigate the root cause of a data issue by tracking the changes made to a column upstream. It can also identify downstream impacts of changes you’d like to make to a dataset and notify impacted users.
Data Lineage view#
The Data Lineage view is a chart showing a selected column and its transformations, from data ingestion to the end of a data pipeline, including across projects. You can see how a column was created and used in a pipeline by following the connecting lines in the chart.
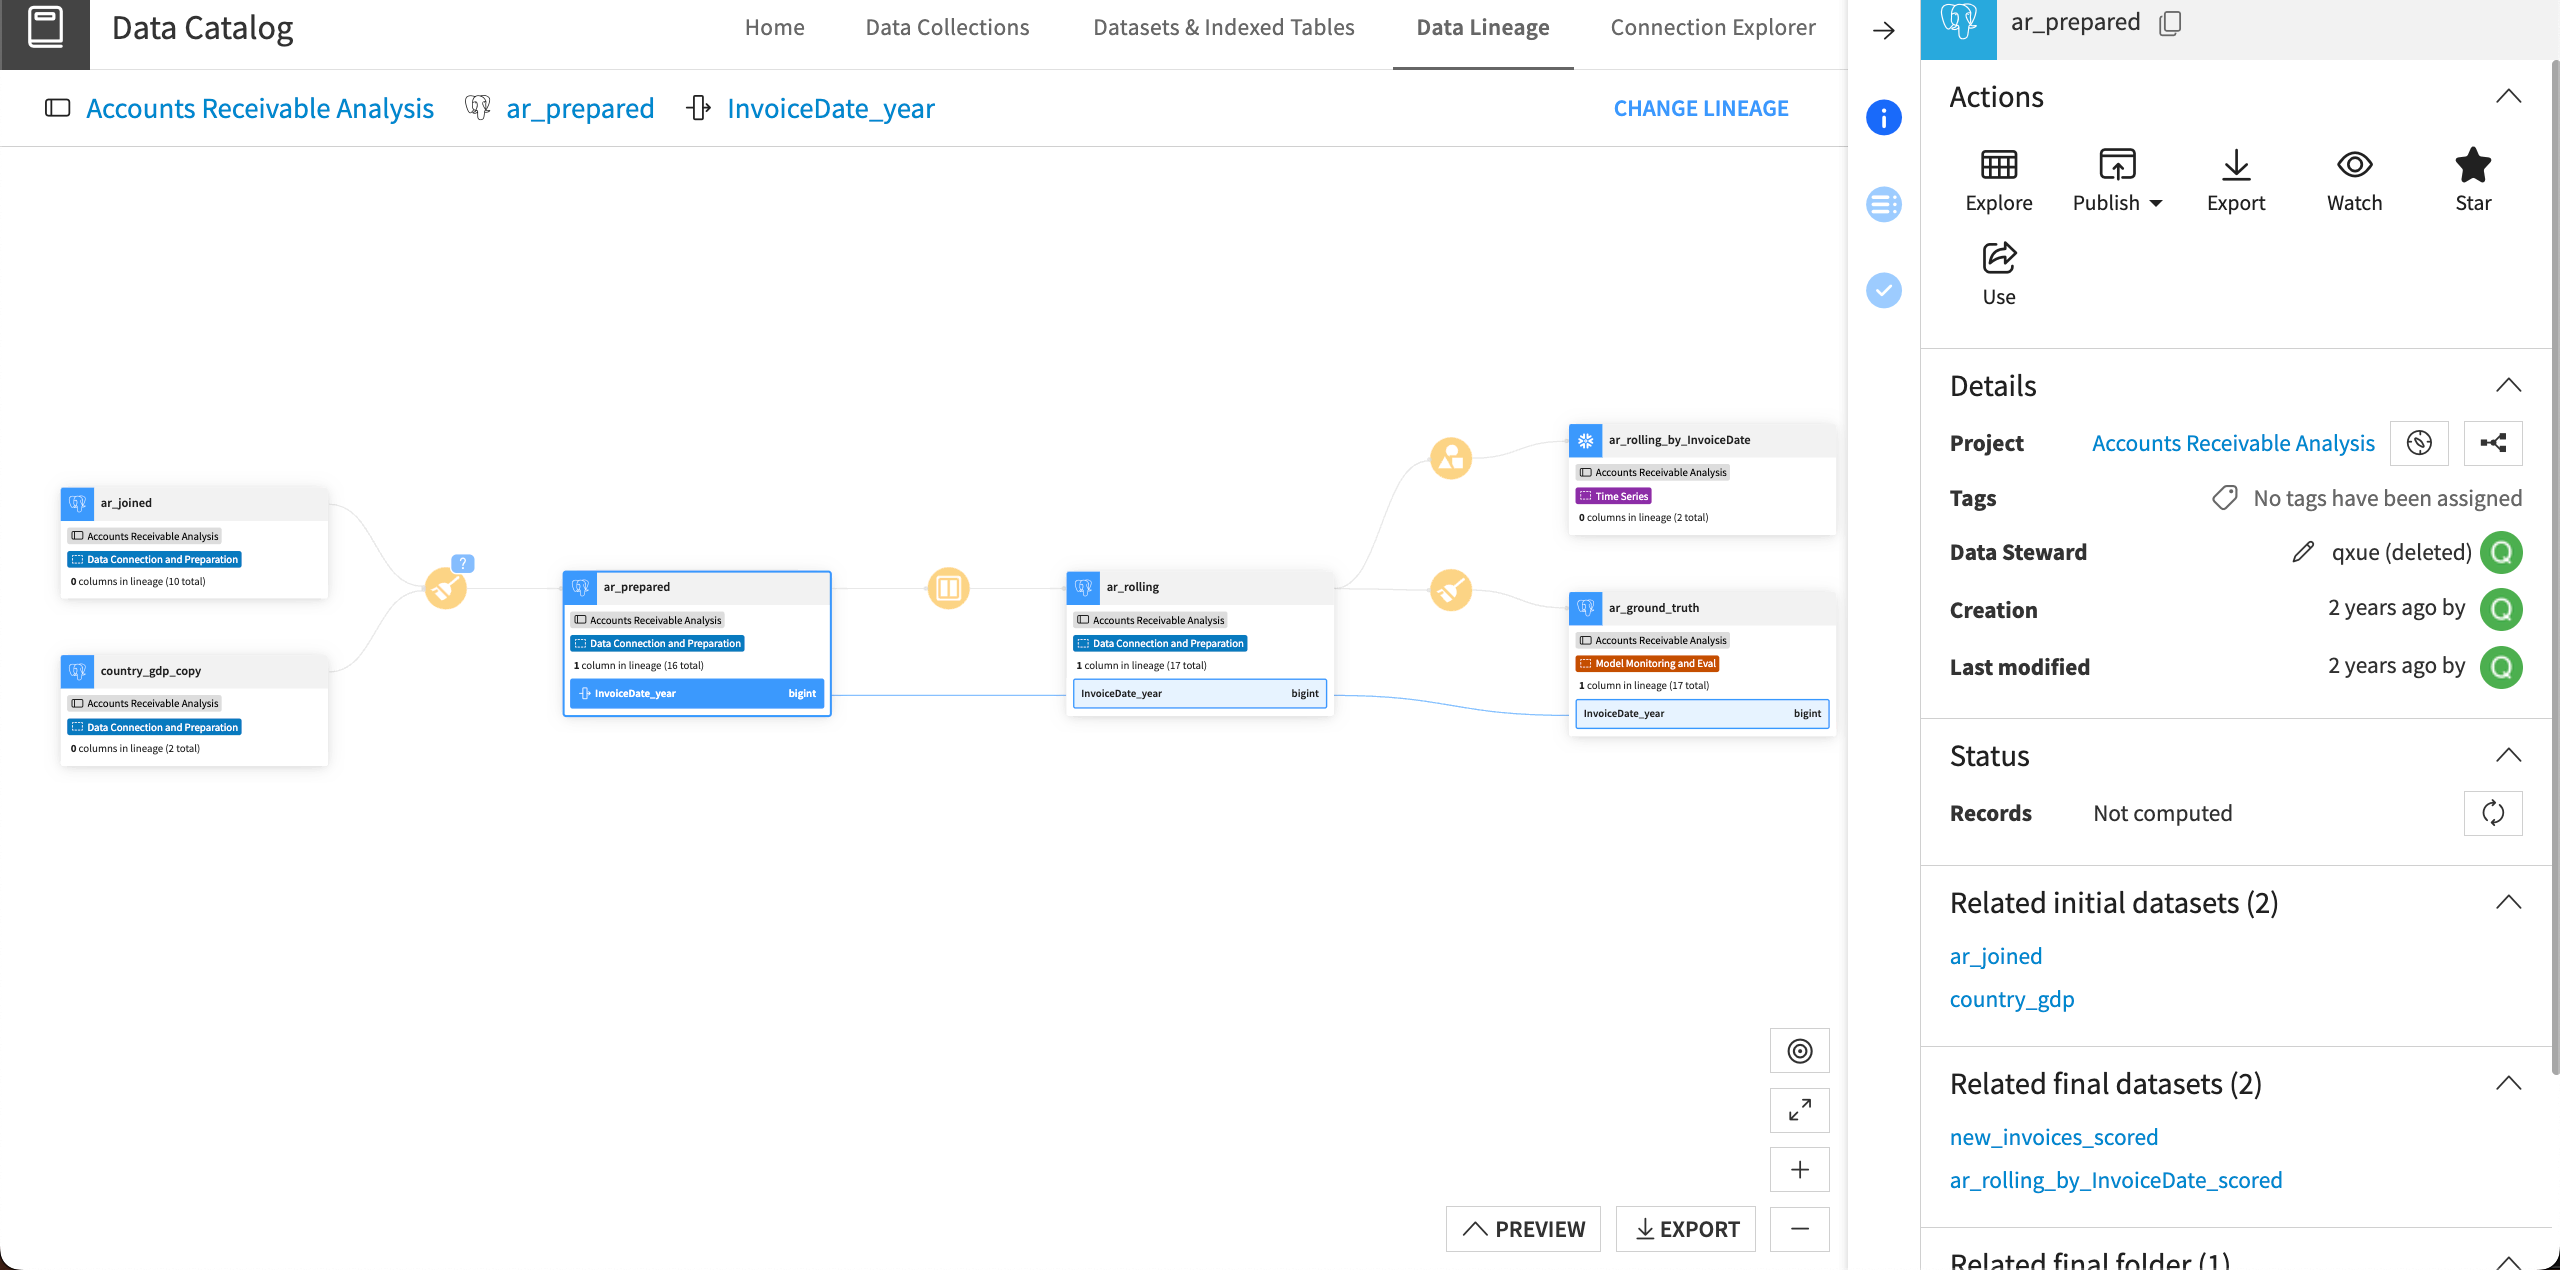
Chart elements#
The chart includes several important elements.
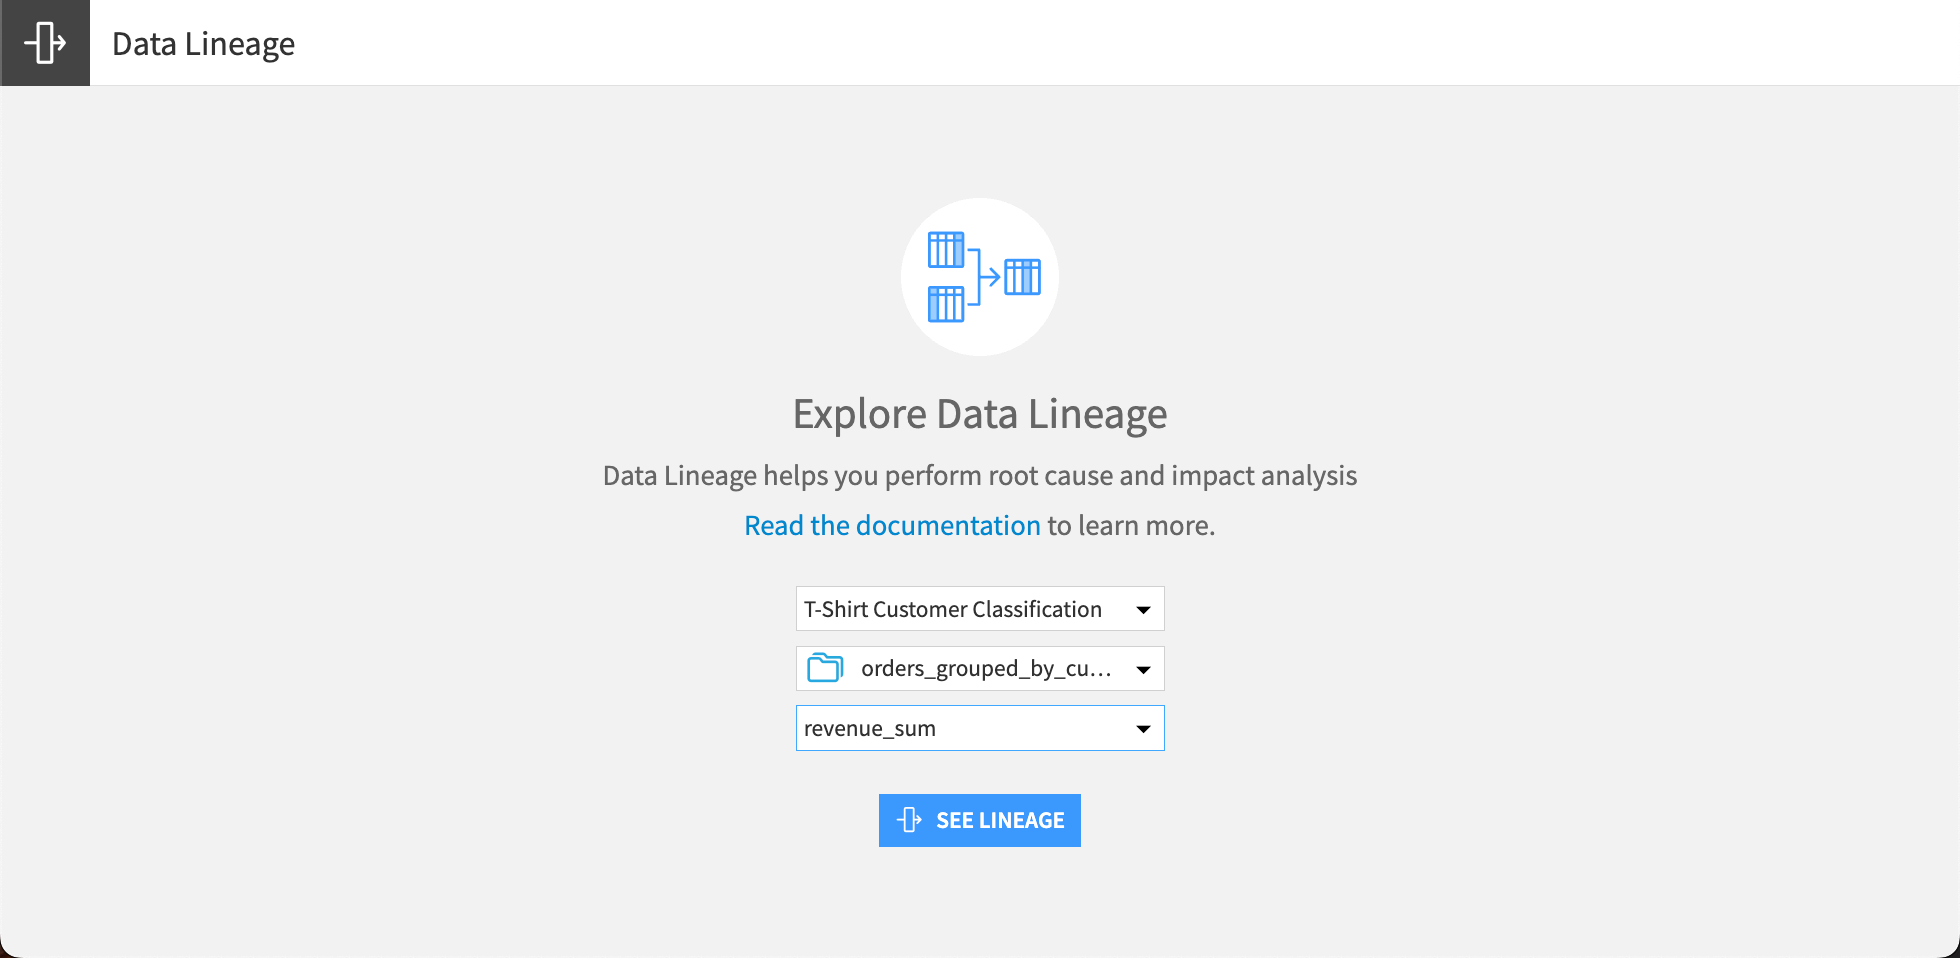
The top bar shows the base project, dataset, and column that the lineage originated from. Click on any of them to navigate to that element, or use the Change Lineage button to choose another project, dataset, or column to view.

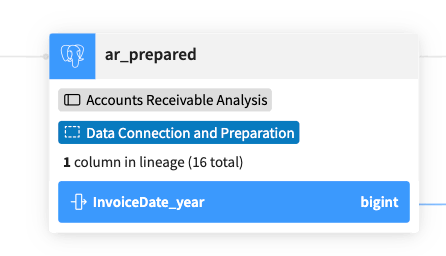
The lineage chart includes boxes for all the datasets in the column’s lineage. These boxes include:
The dataset name at the top.
The project name (in gray for the base project and randomly assigned colors for other projects).
The Flow zone the dataset is in, if applicable.
The base column for the lineage, highlighted in blue.
Double-click on the dataset name, project name, zone name, or recipe icon to open them in another tab.
To denote the lineage of a column, two different kinds of lines connect the dataset boxes:
Gray lines that connect datasets, with recipes shown in the middle.
Blue lines that connect columns in the lineage.

Defining lineage#
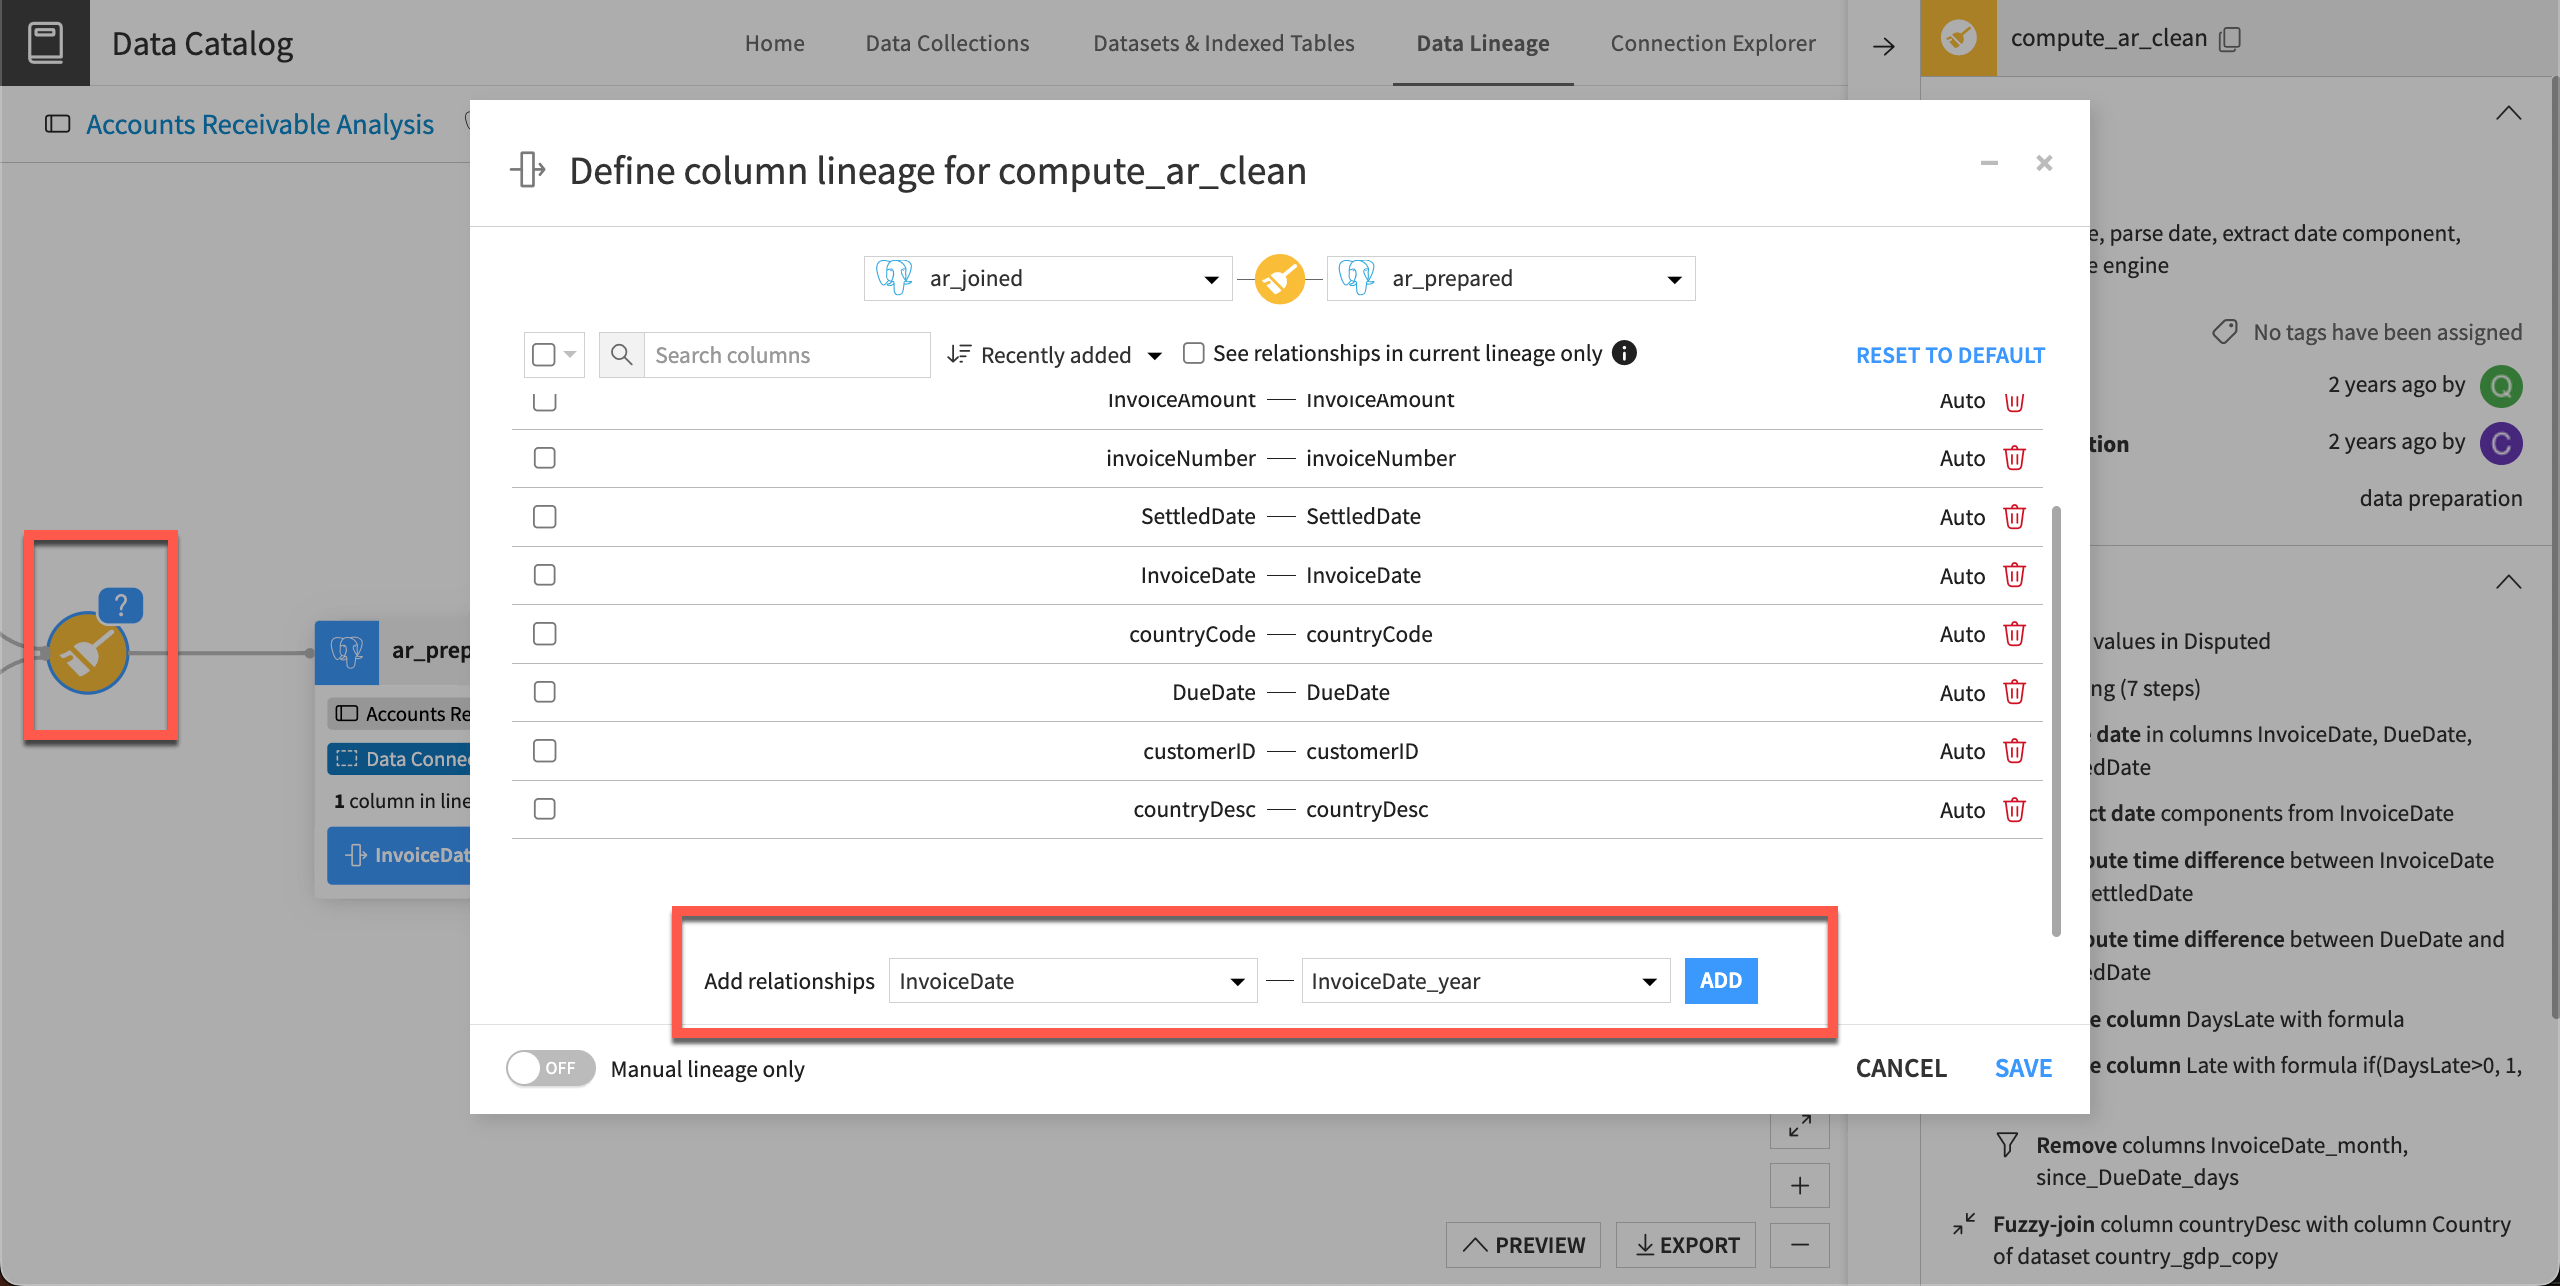
Some recipes have blue question mark buttons in the top right corner. This means the lineage couldn’t be automatically computed with certainty and is based on simple name-based matching.
You can review and update the lineage by clicking on the blue button and adding or removing column relationships as necessary.
Right panel#
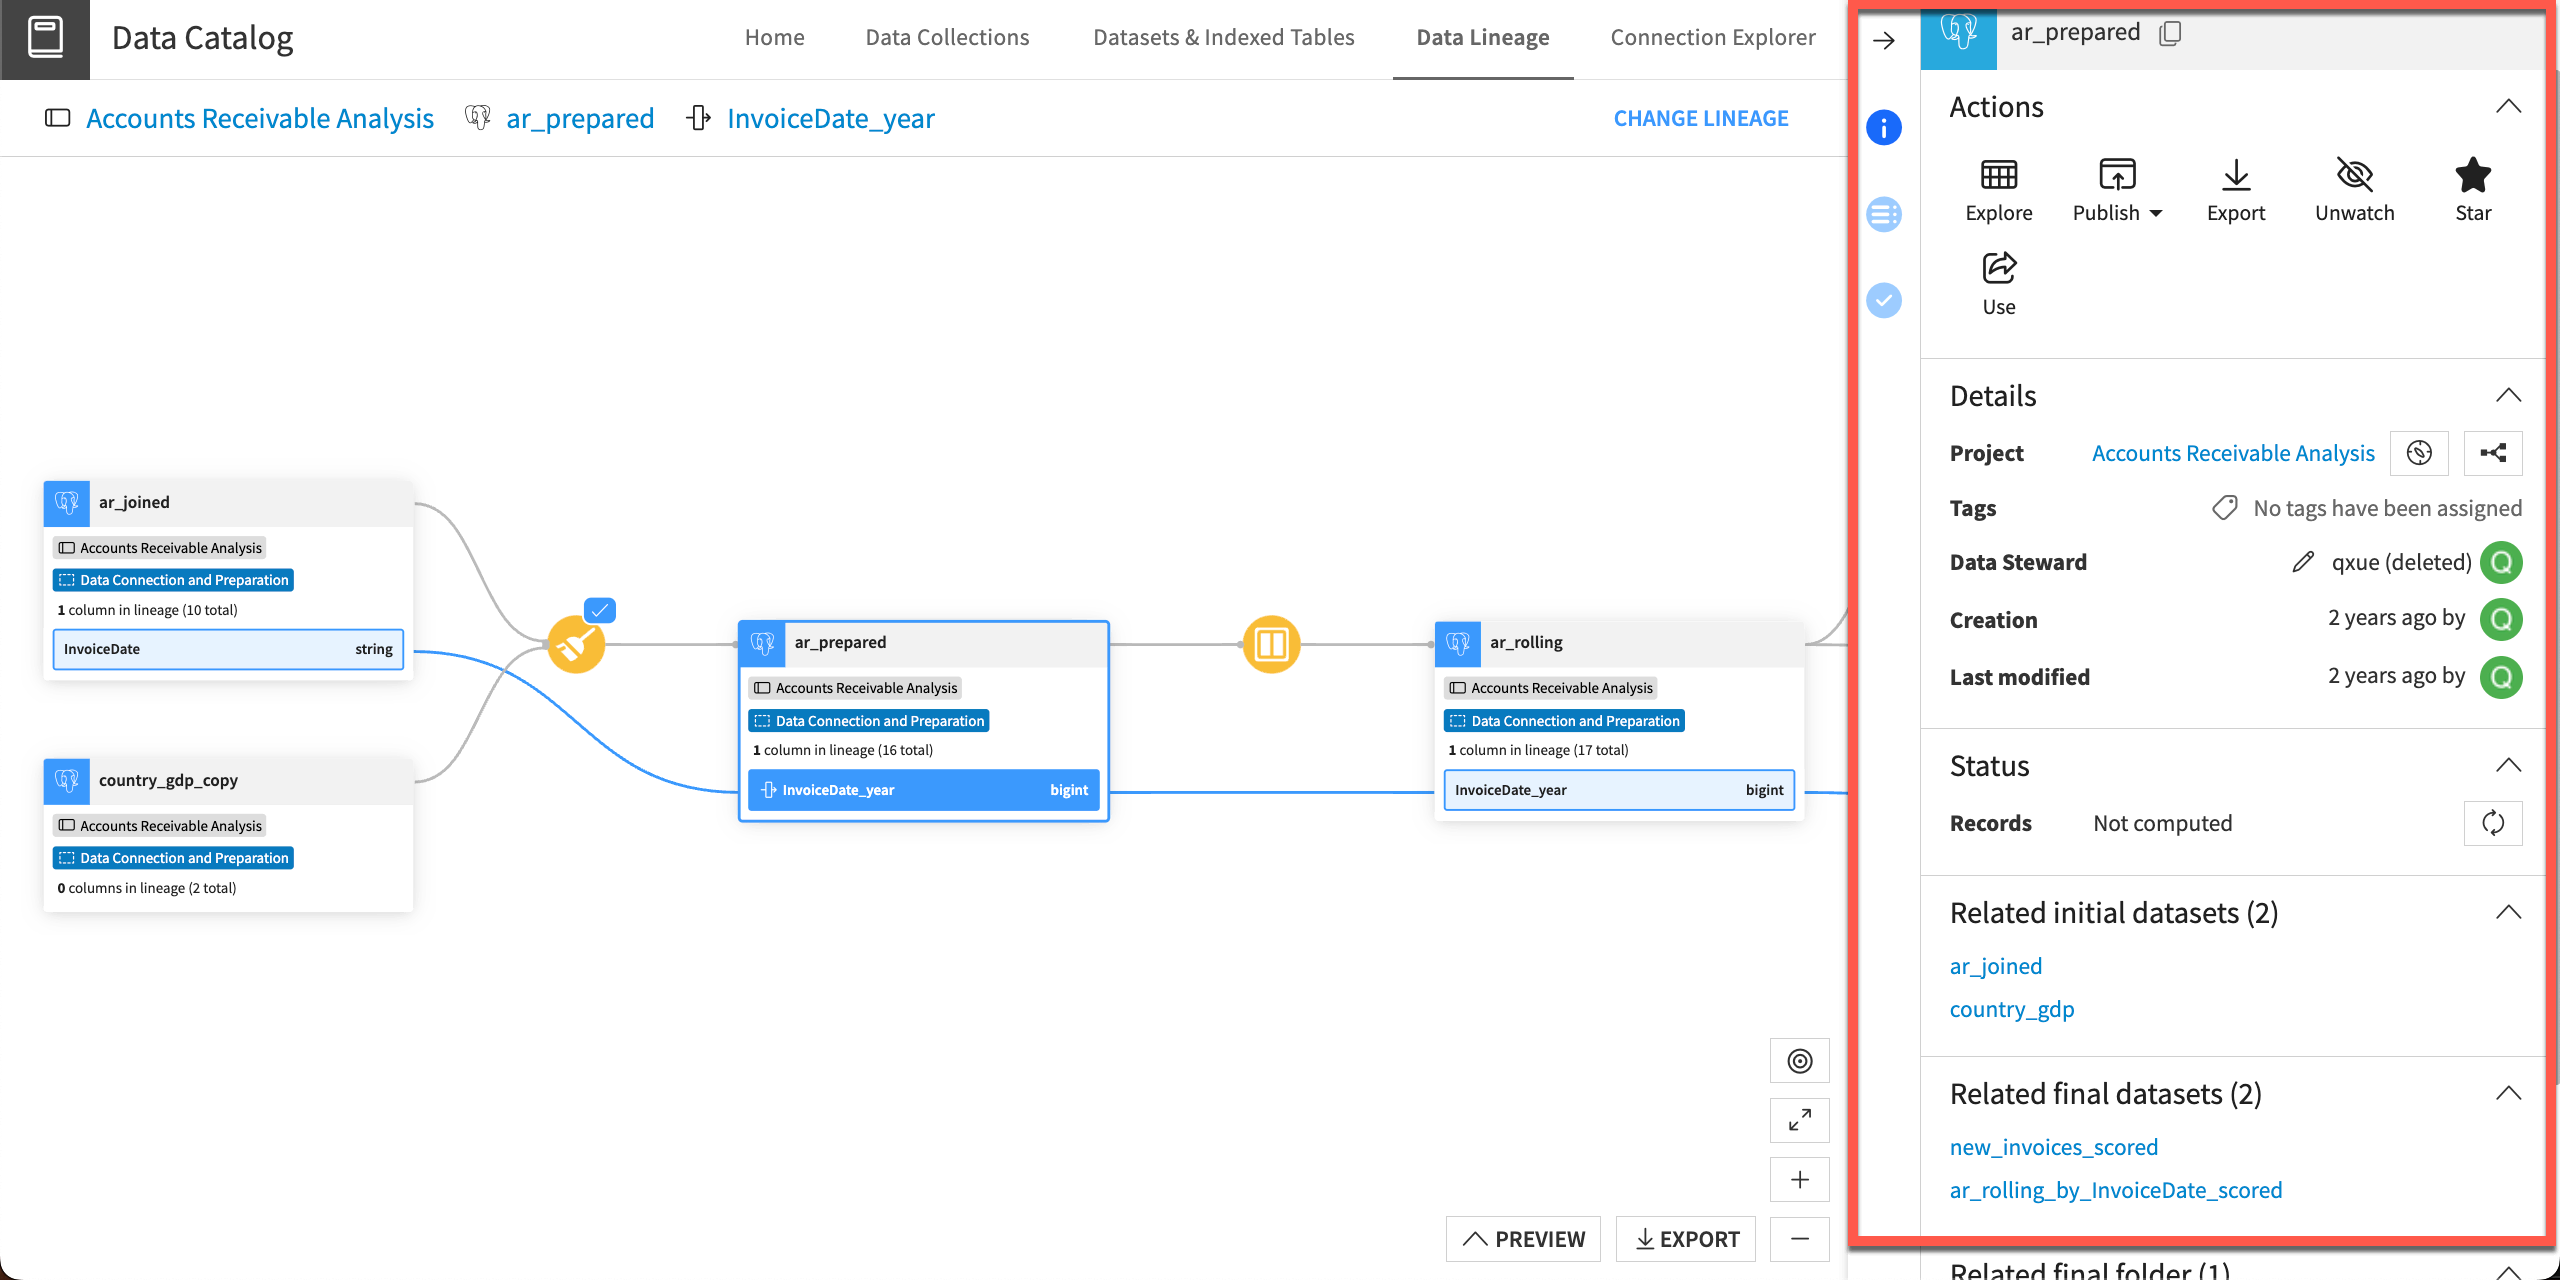
Select a dataset box in the chart to view the right panel. This panel includes three tabs:
Details, which includes several actions, information about the project, and related Flow elements.
Schema, with buttons to change the lineage base column.
Data quality, with data quality rules and statuses, if they have been set up.
Exporting the chart#
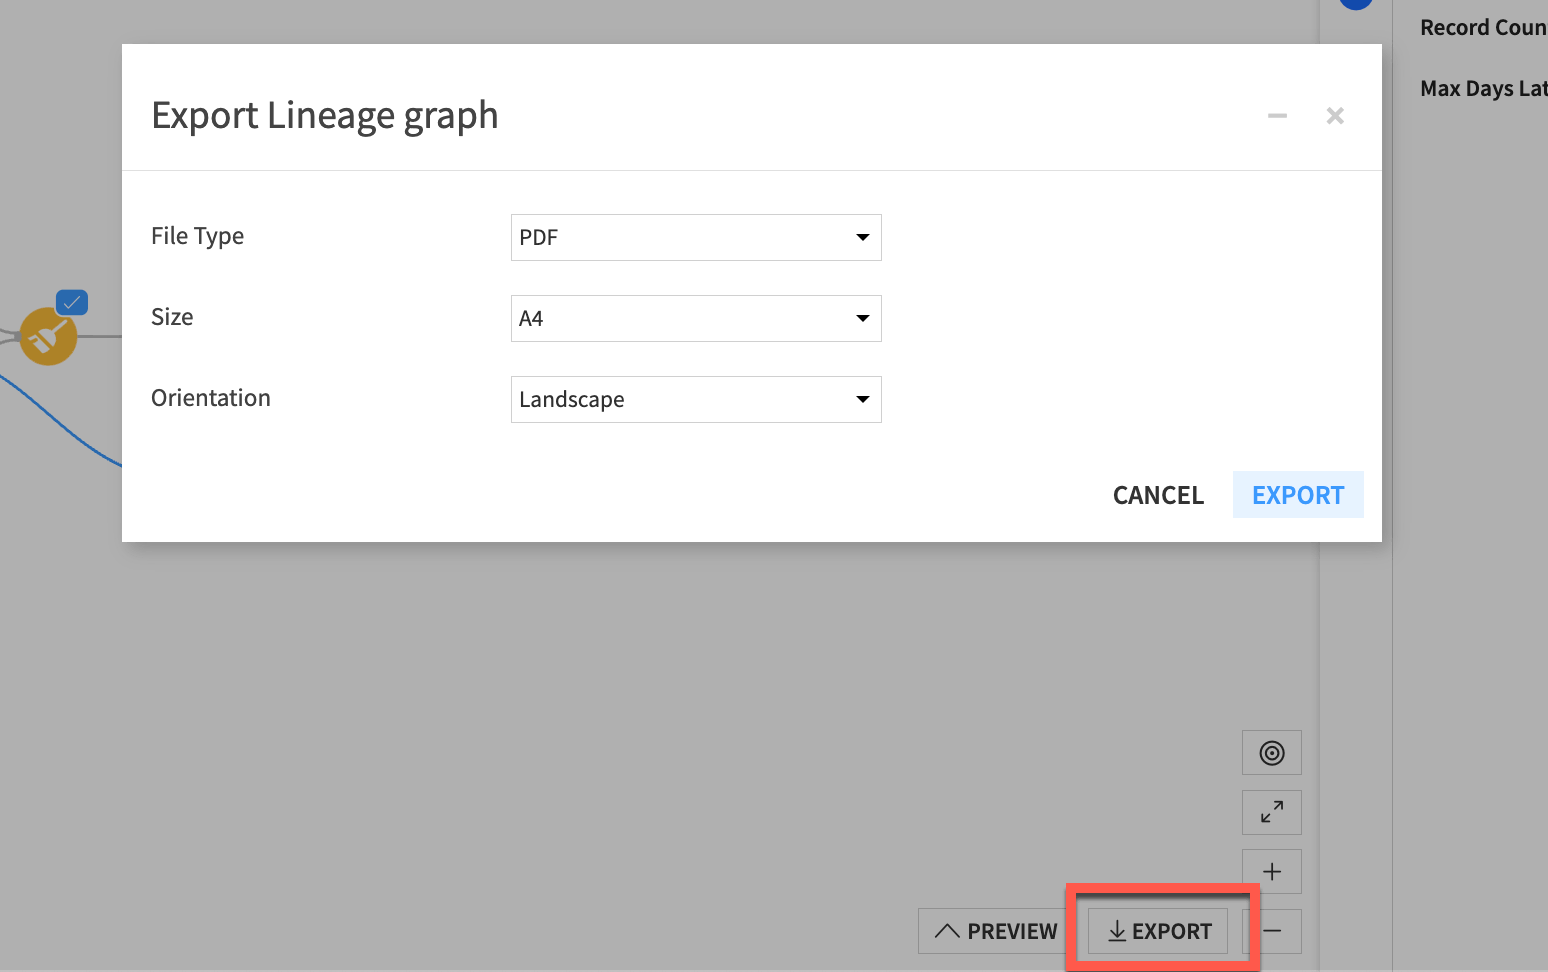
You can export the data lineage chart as a PDF or image using the Export button in the bottom right.
Accessing the view#
You can access the Data Lineage view in several ways:
Starting point |
User action |
|---|---|
A dataset’s Explore tab or Prepare recipe settings |
Right-click on a column name, and select See column lineage. |
A dataset’s right panel |
Go to the Schema ( |
The waffle menu |
Go to the waffle ( |
