
Concept | From Excel to Dataiku#
Dataiku — a collaborative, end-to-end data platform — helps you realize the full potential of your data and move beyond the limitations of spreadsheets.
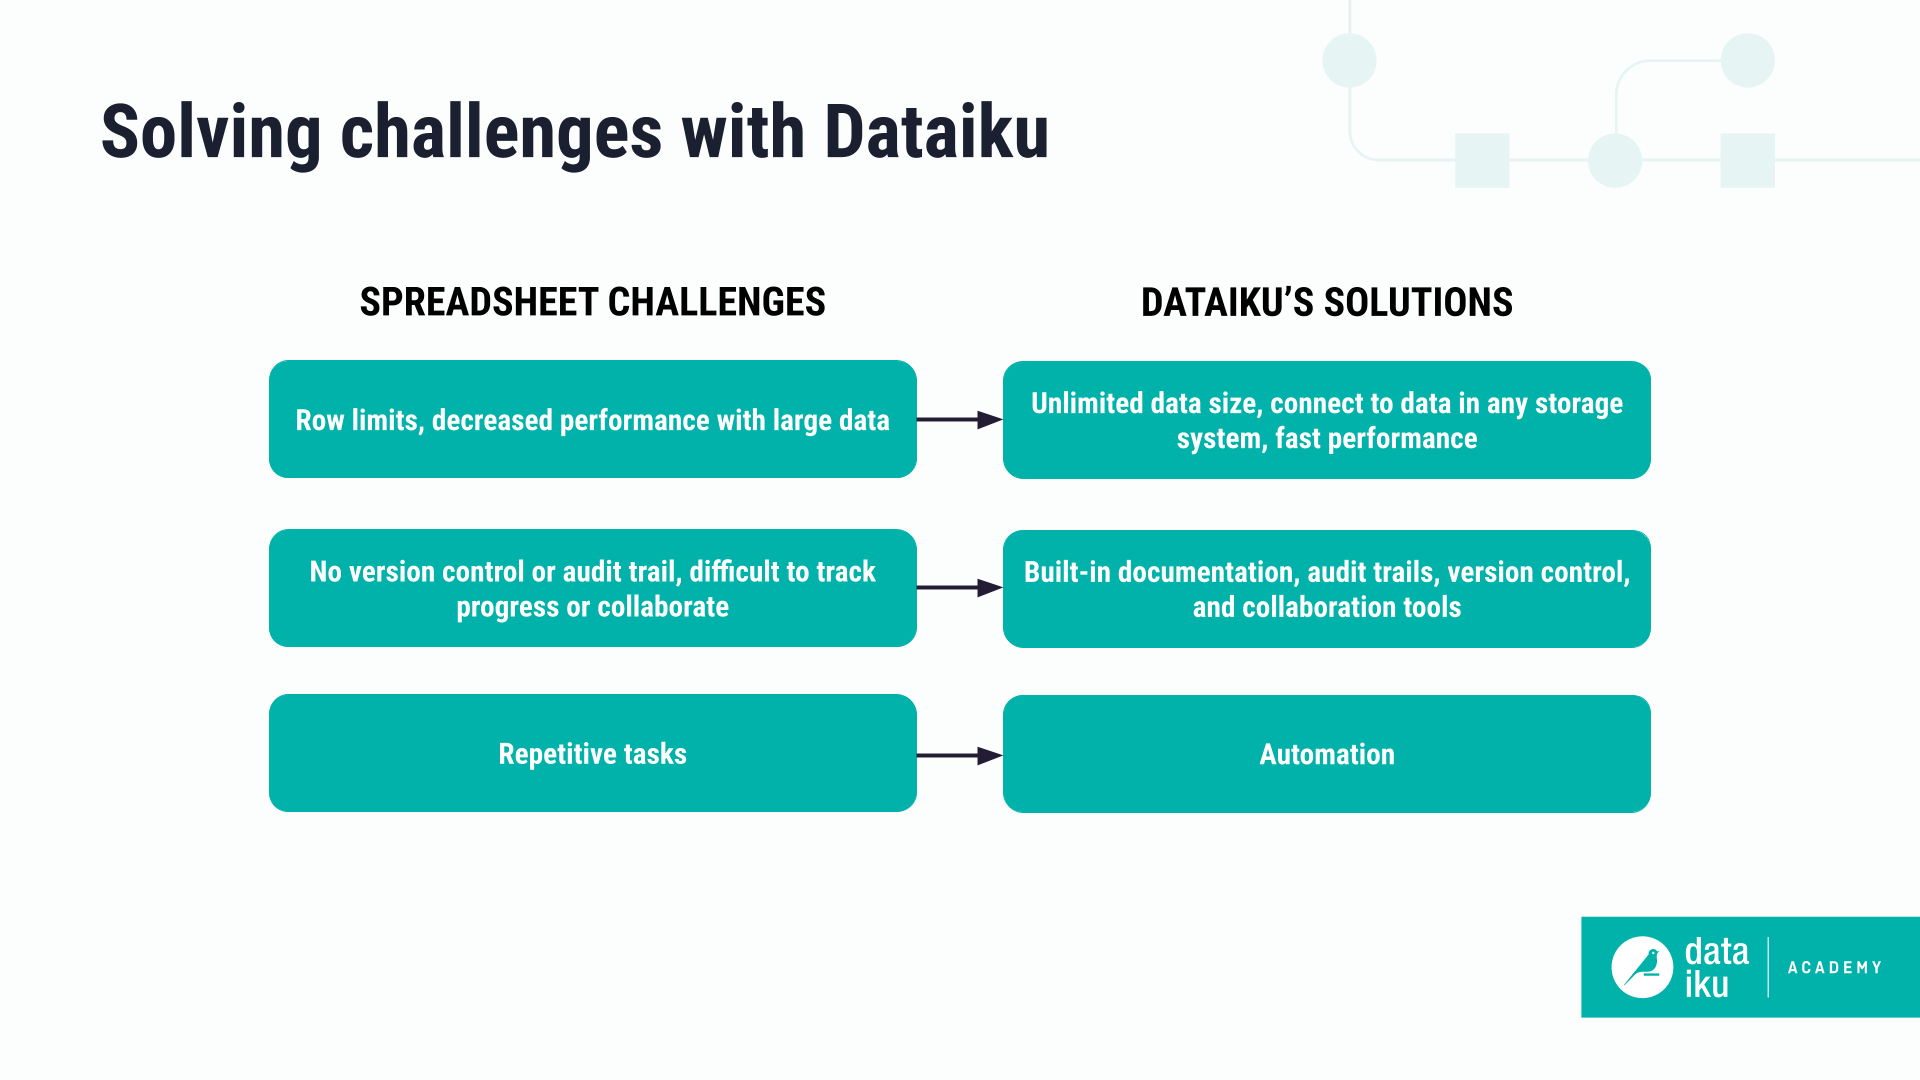
For users migrating from Excel to Dataiku, you can perform the same functions as you do in Excel today, but also do so much more:
Handle much larger datasets, including retrieving data from databases and applications, and then perform tasks more quickly and efficiently.
Track every data transformation with built-in documentation for better auditing, version control, and editing of data pipelines.
Automate repetitive tasks to make your entire team more efficient.
Collaborate in one platform for easier sharing of processes and datasets among team members and stakeholders.
Additional functions such as joining datasets, working with geographic data, one-click analysis of every column, quick stats, dashboards, no-code machine learning models — and more!
To make the most of Dataiku, it’s important to learn a few key ways in which the Dataiku experience differs from spreadsheets.
Shifting from cells to columns#
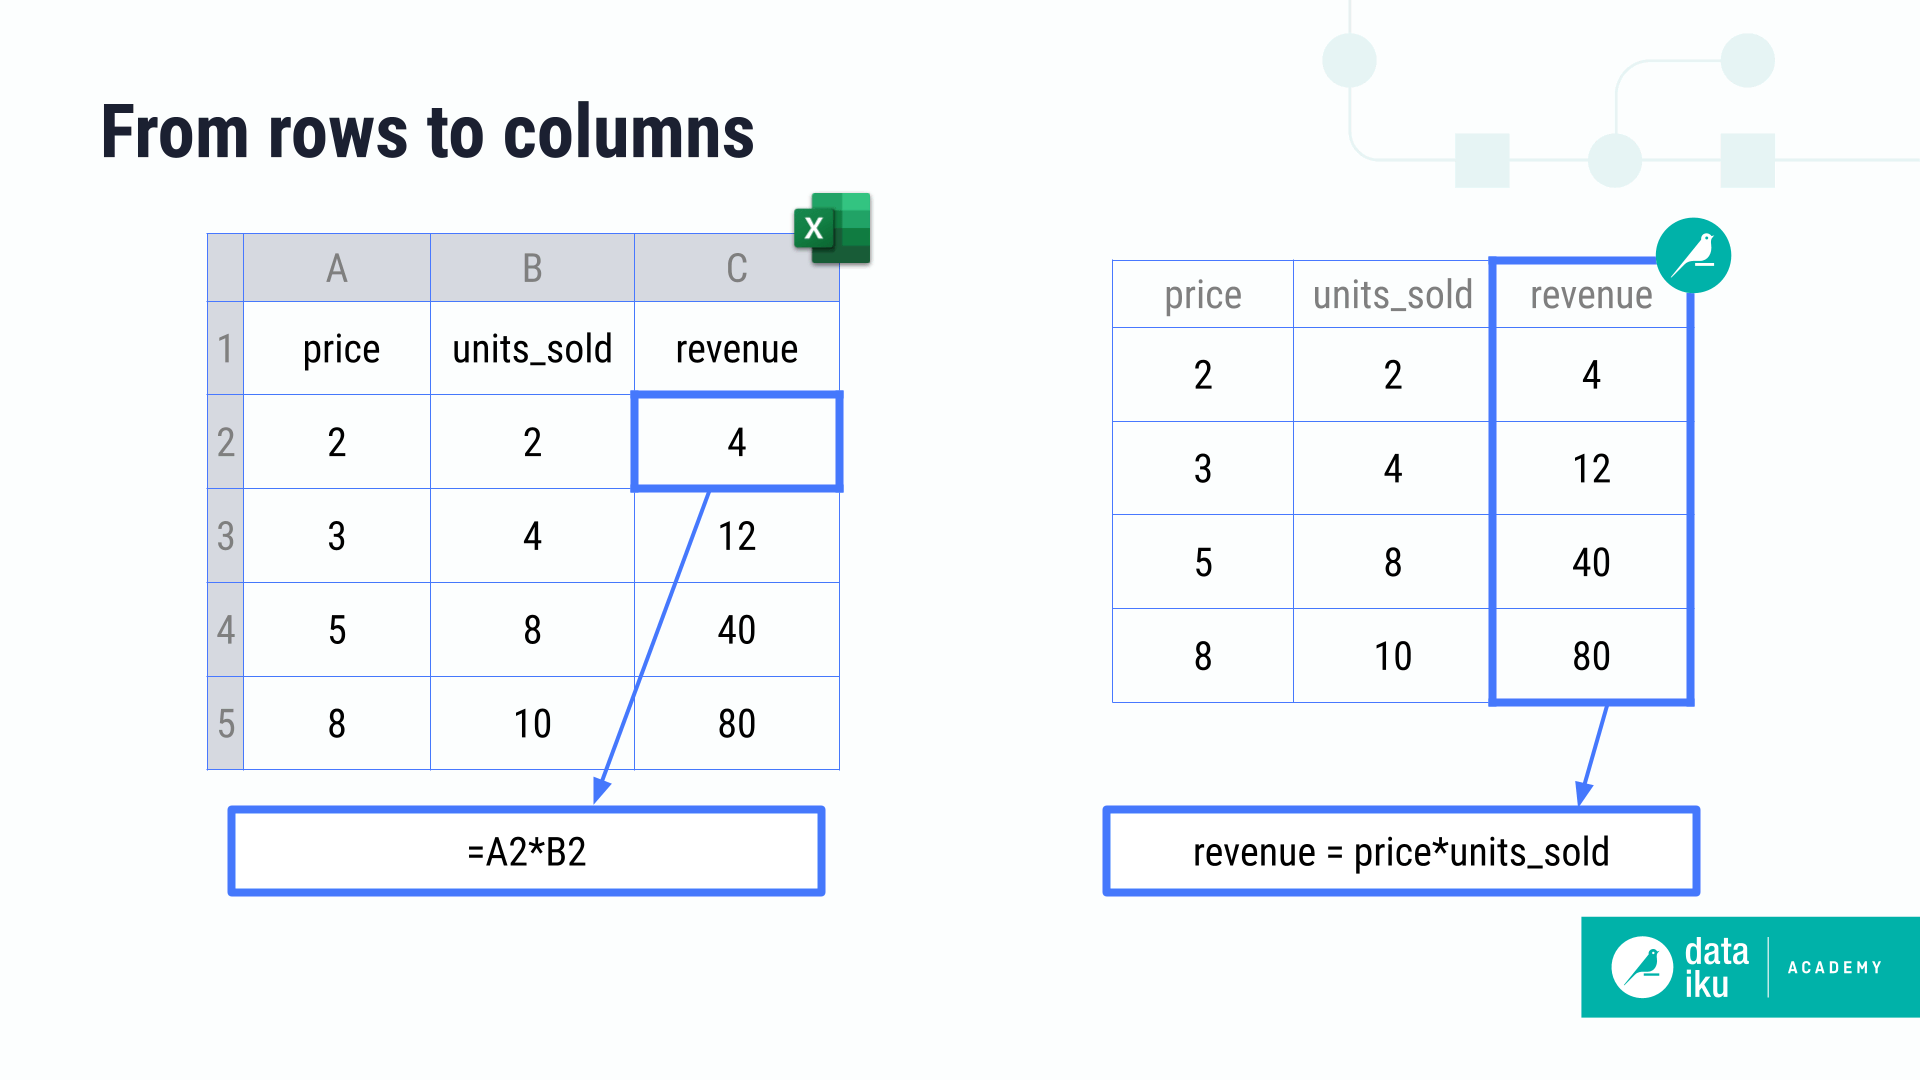
In Excel, or any spreadsheet program, you frequently work inside cells. You write formulas that perform row-by-row calculations, edit data directly in cells, and copy and paste cells to different locations.
In Dataiku, you generally perform tasks on columns, which is the most scalable way to process large datasets. Instead of thinking about calculations at the cell level, you’ll use columns to perform operations on datasets.
For example, formulas in Dataiku reference column names instead of cell addresses. The formula is applied to each row in the dataset. You can use formulas much the same way you do in spreadsheets to perform calculations, prepare data, and flag rows.
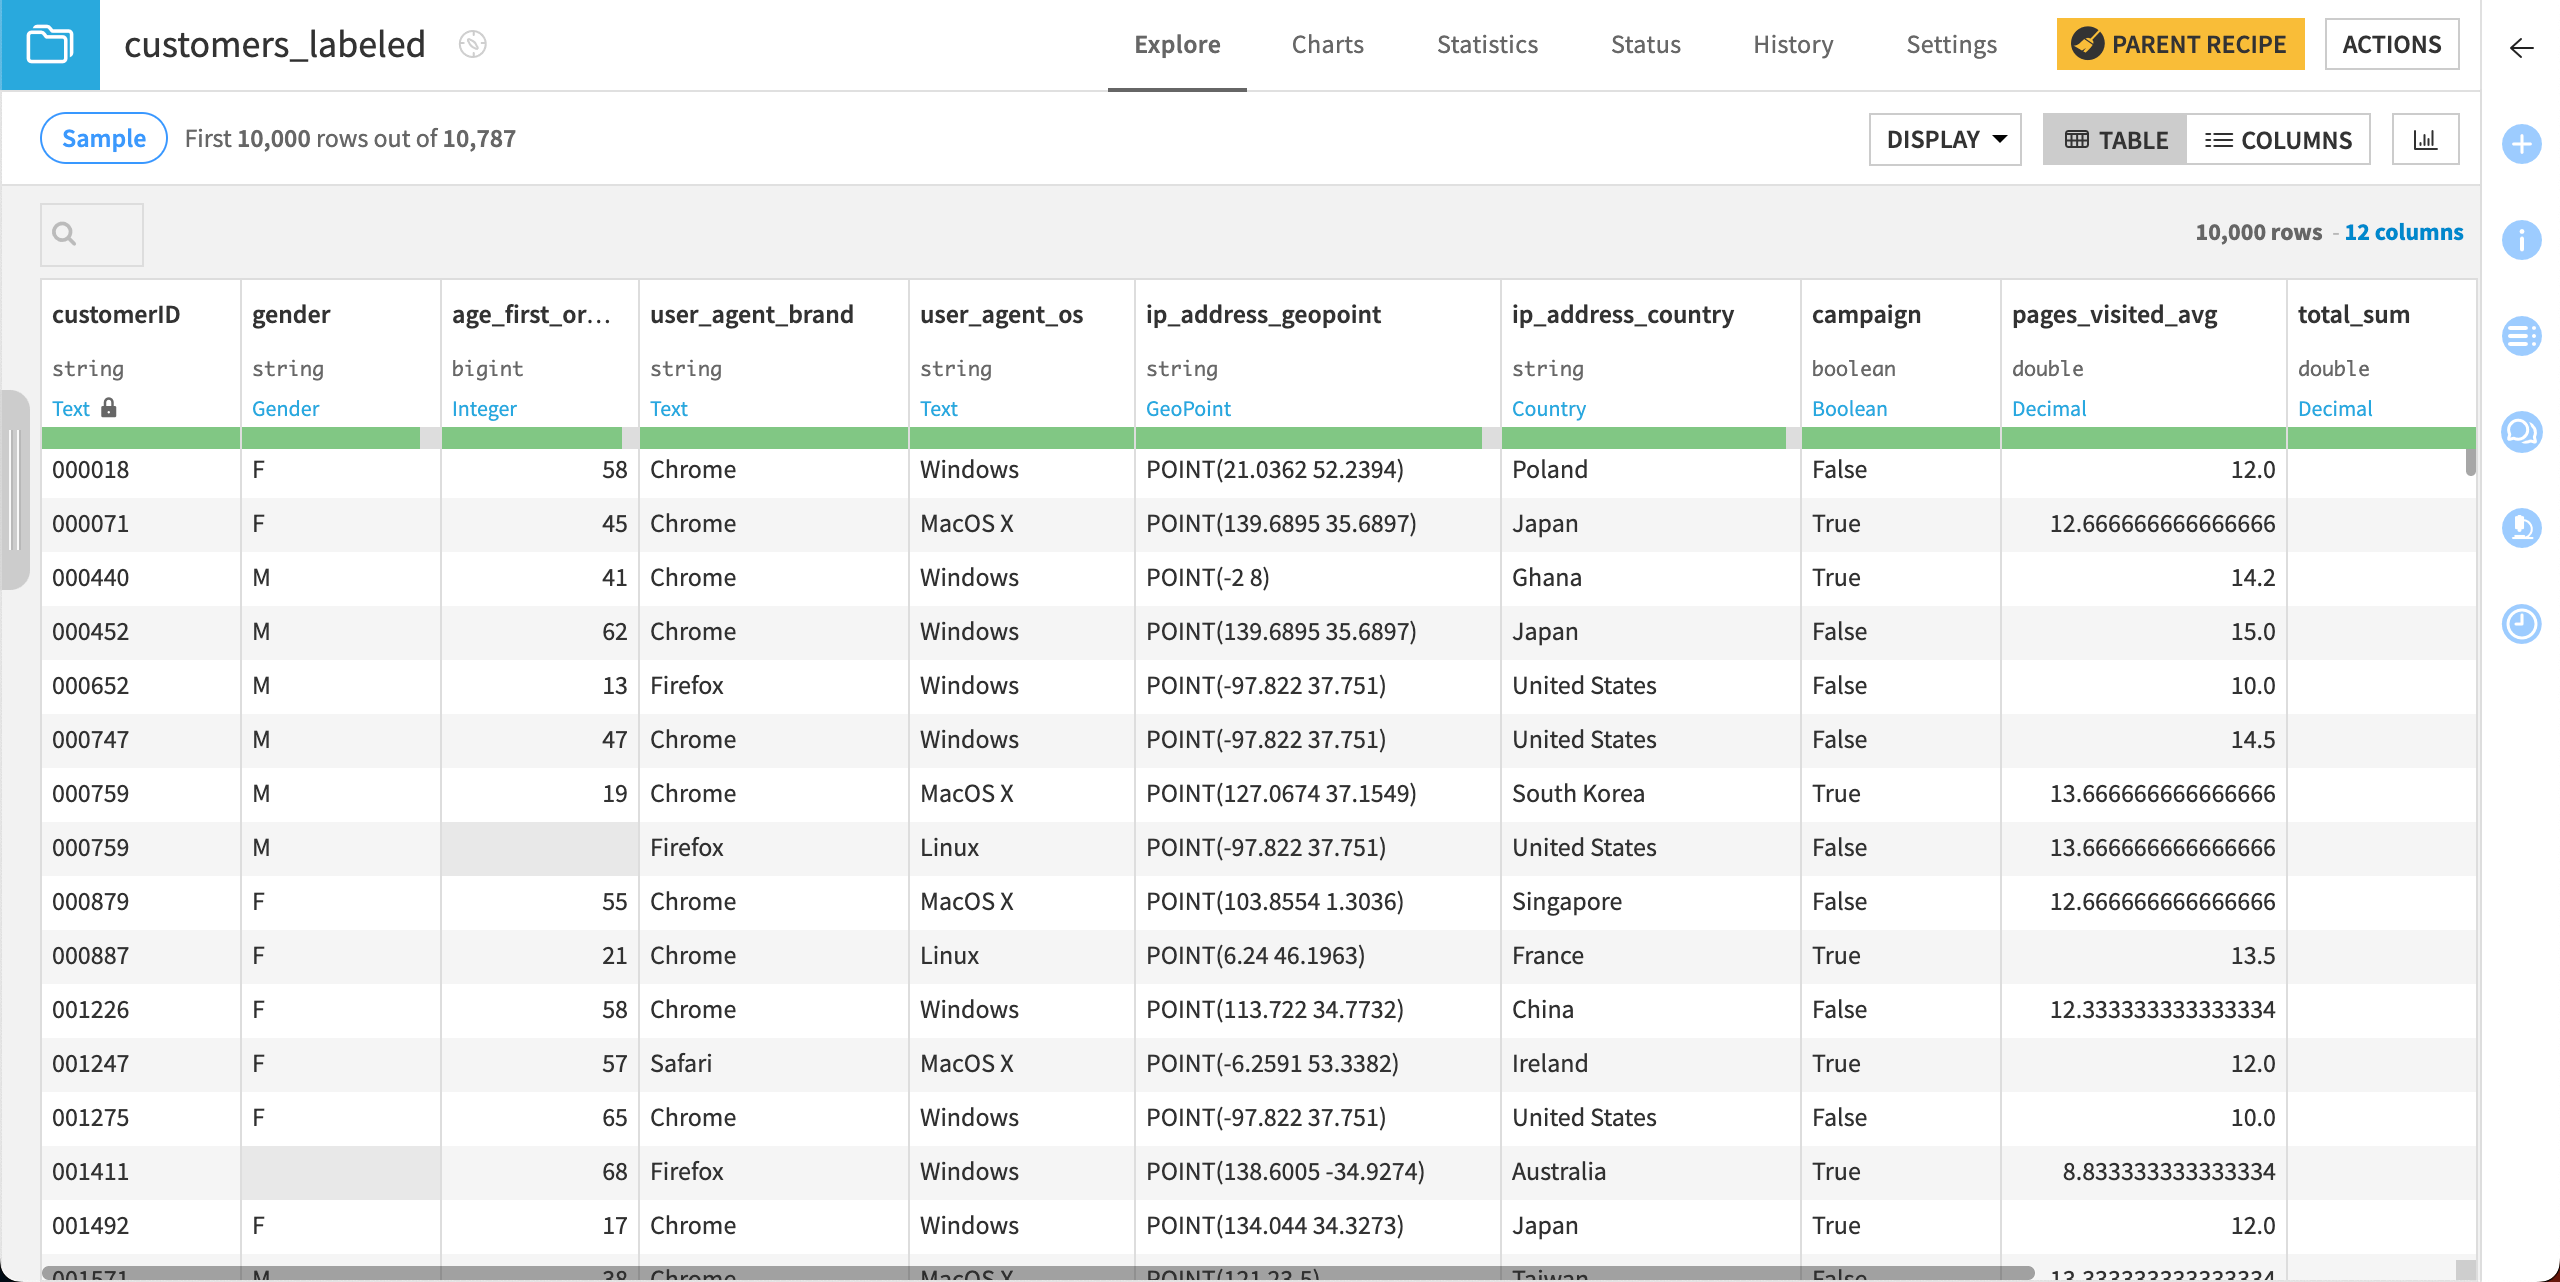
You can also perform multiple aggregate functions, including sum, min, and max, on a column with one click using Dataiku’s Analyze column feature.
Some aspects of Dataiku are similar to spreadsheets. You can view your data in tabular format, change the width of columns, hide columns, switch data types, and even edit data directly using Dataiku’s editable datasets feature.
Transforming data: Recipes#
In Excel, you interact directly with the data itself. In Dataiku, you process data through recipes, a key and powerful component of the platform. Visual recipes provide a user-friendly interface to transform your data with just a few steps. Some recipes perform the same types of transformations frequently used in Excel, such as filtering data or creating pivot tables. Others provide additional functionality, such as joining multiple datasets.
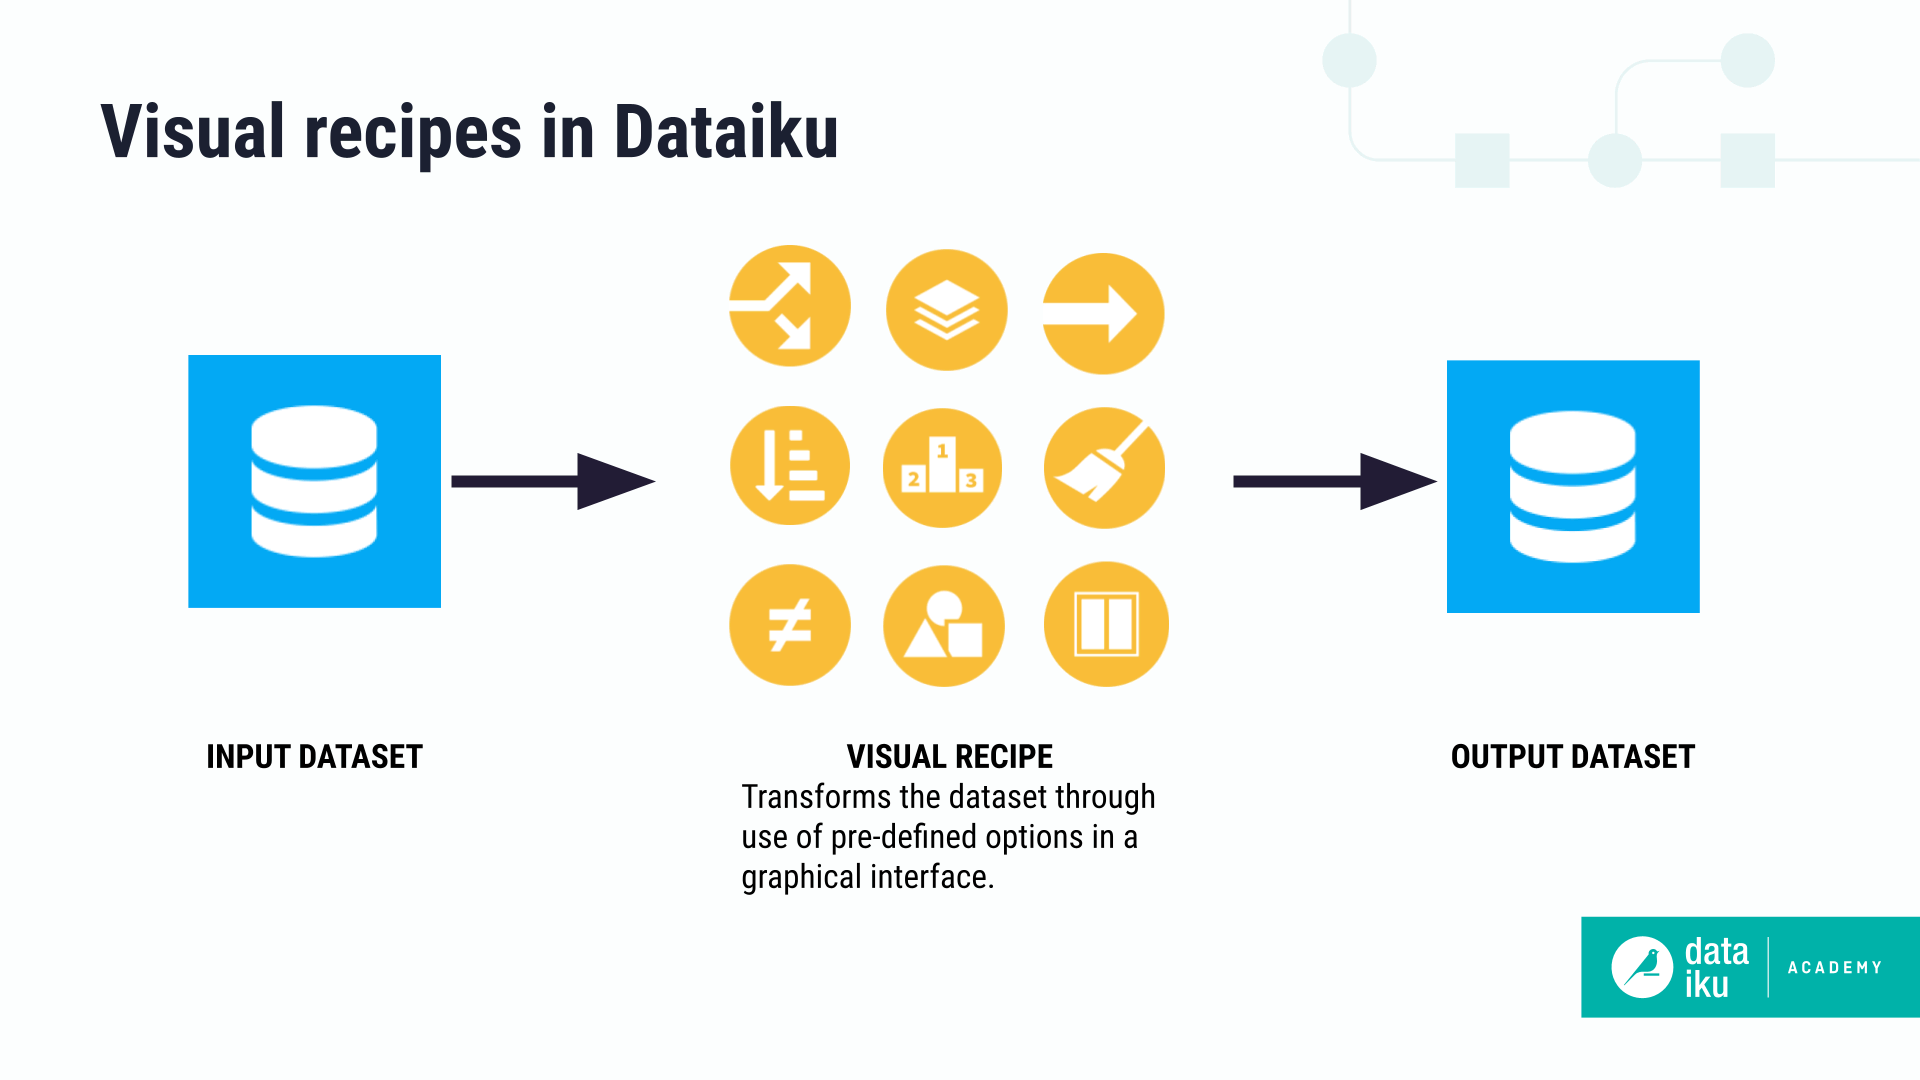
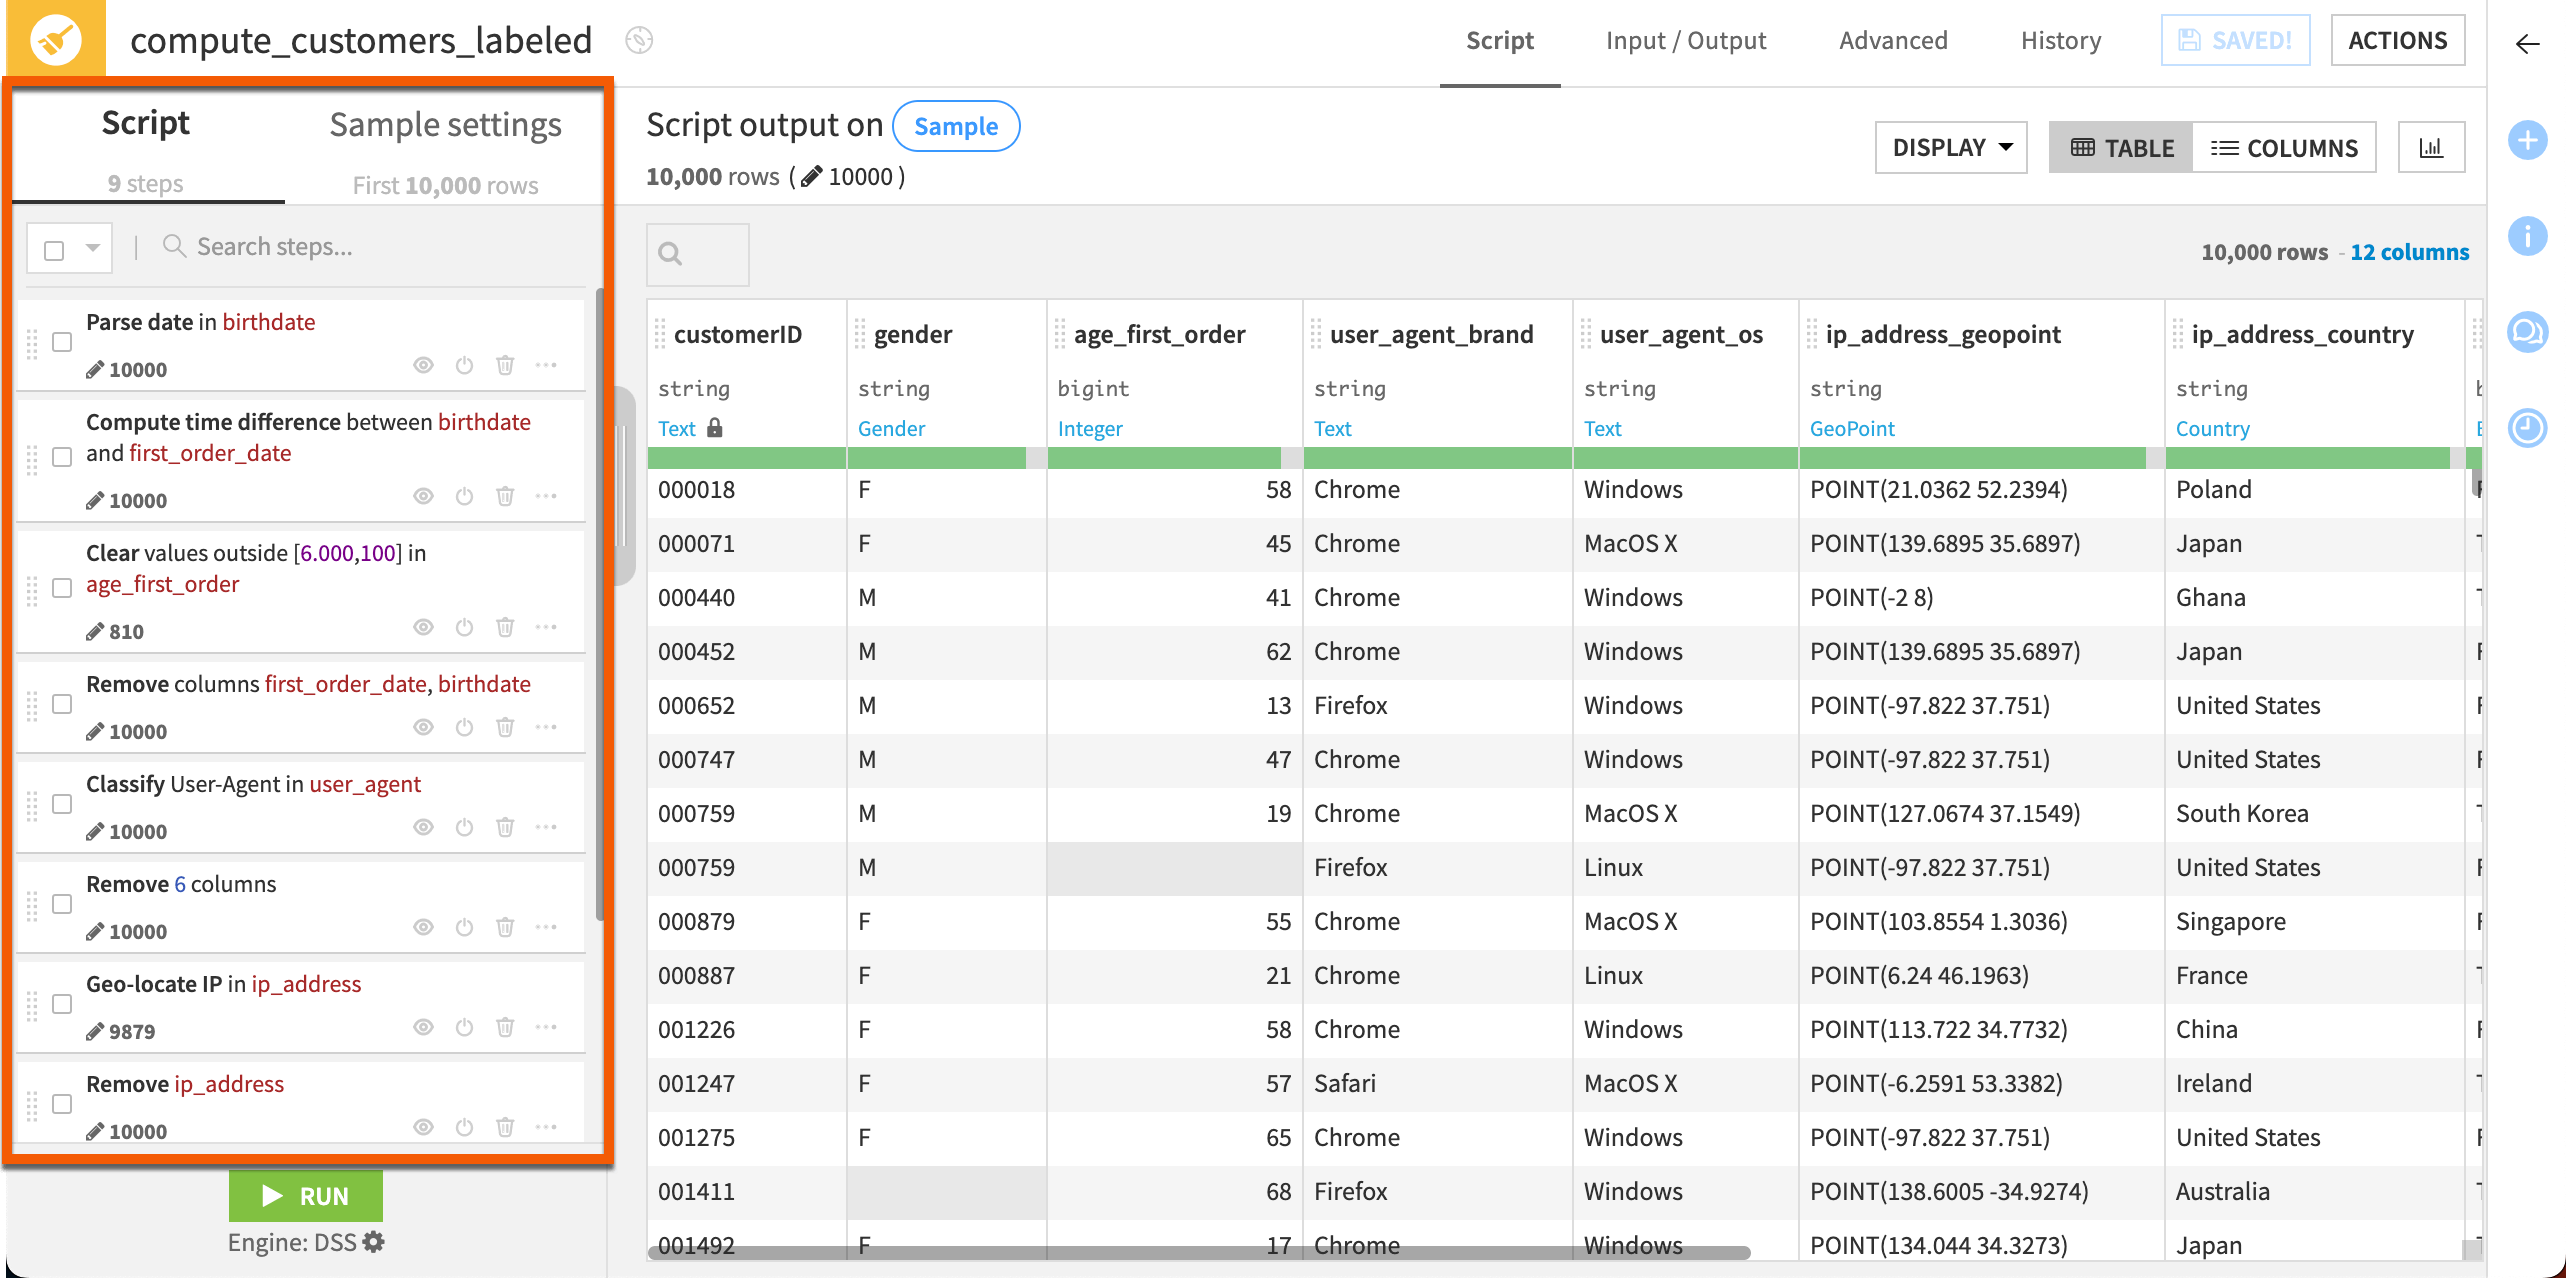
Among the menu of visual recipes, the Prepare recipe is one of the most versatile. It allows you to assemble a series of transformation steps from a library of about 100 processors. Each processor handles a specific task, much as an Excel formula does: parsing dates, extracting text using regular expressions, concatenating or splitting columns, or rounding numbers. You can also define your own specific transformation using the Formula processor mentioned above.
The Prepare recipe tracks each transformation step, allowing for validation of your methodology, editing steps, and collaborating with others as needed.
Chaining transformations: The Flow#
As you apply several transformations to your data, potentially from different sources, and further combine or process them, you are building what’s called a “data pipeline.” In Dataiku, that data pipeline is represented in a visual fashion to give an immediate overview and understanding of how your data is being processed. This view is called the Flow.
The Flow is another aspect of Dataiku that’s different from the spreadsheet experience. The Flow tracks every dataset and recipe in your Dataiku project, allowing you to navigate the pipeline and make any changes as needed. The Flow also makes collaboration easier as all teammates can view and track the steps, and it enables automation through building repeatable steps.
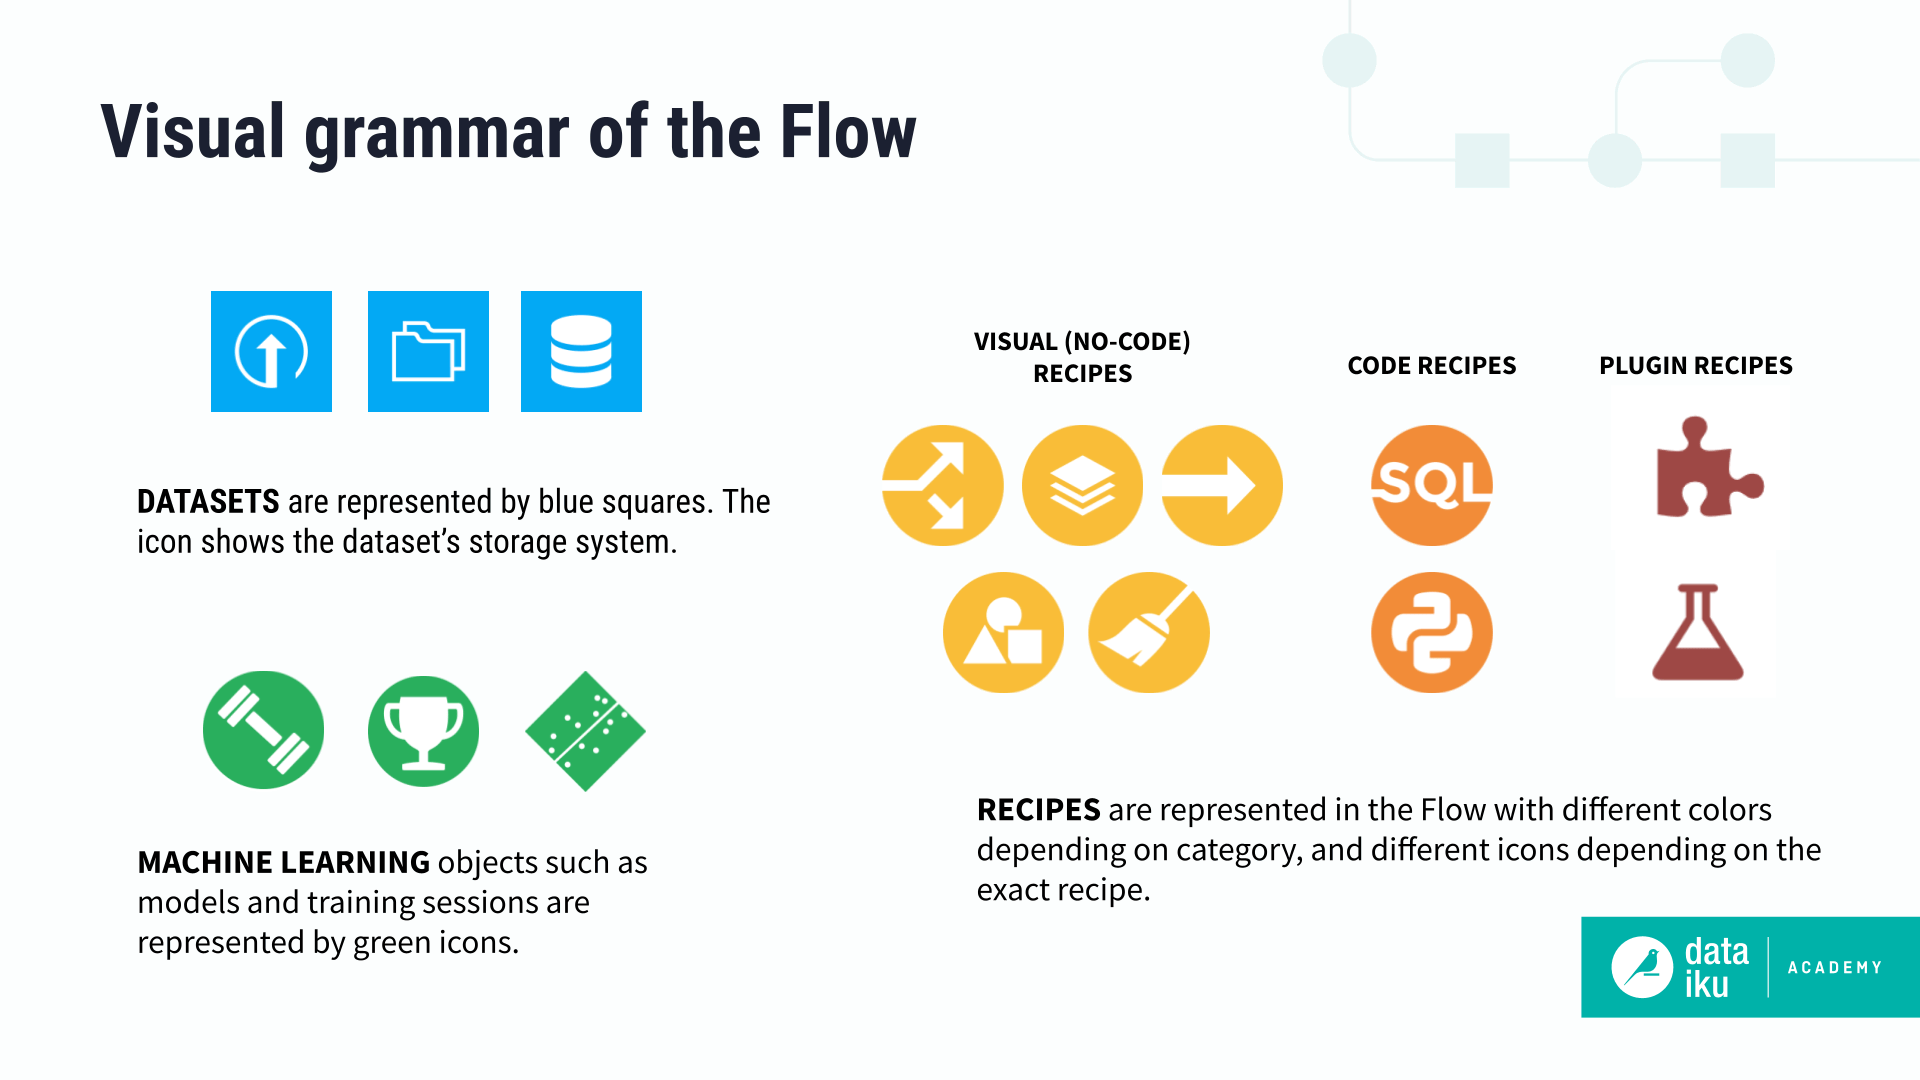
Common objects in the Flow include:
Datasets: Represented by blue squares, datasets also include icons that show the type of data connection, such as uploaded files, Structured Query Language (SQL) tables, cloud storage, or other connection types.
Recipes: Visual recipes are represented by yellow circles, with an icon showing the type of recipe. (In addition to visual recipes, you’ll notice a few other types such as code, plugin, and other recipes denoted by different colors.)
Machine learning models: If your data pipeline includes machine learning models, the training sessions, deployed models, and testing recipes are represented with green icons.
Tip
To familiarize yourself with the Dataiku environment, check out our guide to the user interface.
Next steps#
Continue your introduction to Dataiku by completing Quick Start | Excel to Dataiku.