
Tutorial | Group recipe#
The Group recipe allows you to aggregate data based on specified keys (that is, criteria).
Get started#
Objectives#
In this tutorial, you will:
Use the Group recipe to aggregate data.
Prerequisites#
To complete this tutorial, you’ll need the following:
Dataiku 14.0 or later.
Create the project#
From the Dataiku Design homepage, click + New Project.
Select Learning projects.
Search for and select Group Recipe.
If needed, change the folder into which the project will be installed, and click Create.
From the project homepage, click Go to Flow (or type
g+f).
Note
You can also download the starter project from this website and import it as a ZIP file.
You’ll next want to build the Flow.
Click Flow Actions at the bottom right of the Flow.
Click Build all.
Keep the default settings and click Build.
Use case summary#
Let’s say we’re a financial company that uses some credit card data to detect fraudulent transactions.
The project comes with three datasets, described in the table below.
Dataset |
Description |
|---|---|
tx |
Each row is a unique credit card transaction with information such as the card that was used and the merchant where the transaction was made. It also indicates whether the transaction has either been:
|
merchants |
Each row is a unique merchant with information such as the merchant’s location and category. |
cards |
Each row is a unique credit card ID with information such as the card’s activation month or the cardholder’s FICO score (a common measure of creditworthiness in the US). |
Create the Group recipe#
You have a prepared dataset of transactions, but the next phase of analysis is about card holders (represented by the column card_id). To facilitate that kind of analysis, you need to first aggregate transactions per distinct card holders.
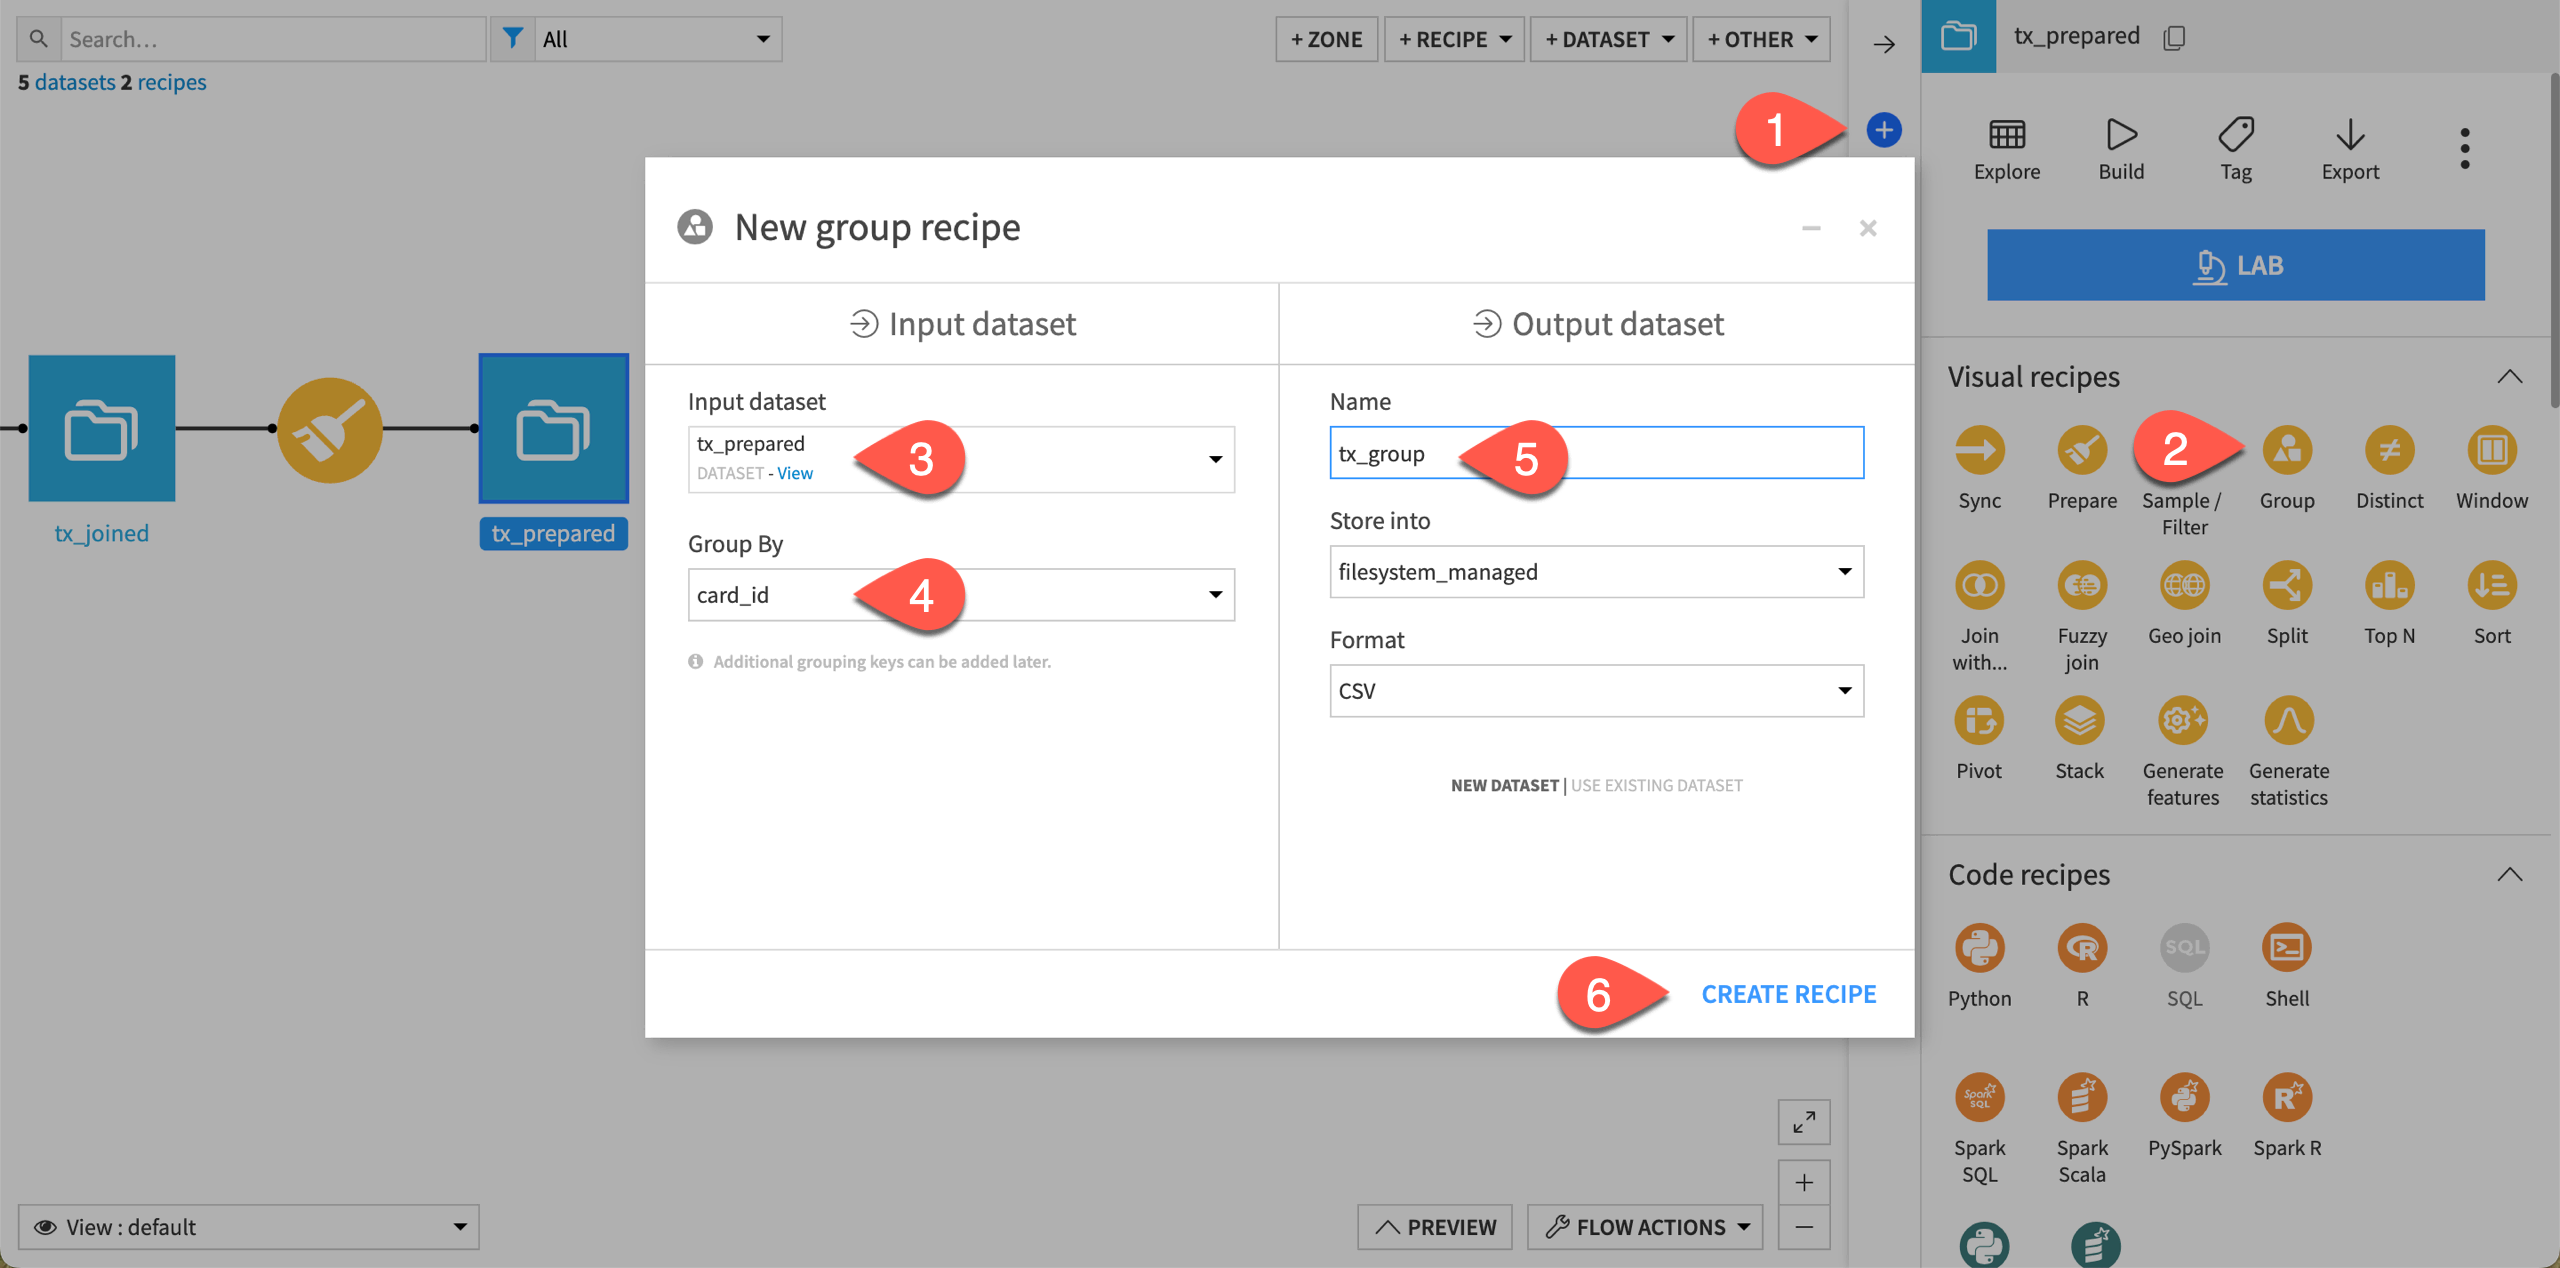
First, create a Group recipe.
From the Flow, select the tx_prepared dataset.
In the Actions tab of the right panel, select the Group recipe from the visual recipes section.
For the Group by field, select card_id.
Name the output dataset
tx_group.Click Create Recipe.
Select aggregations by group key#
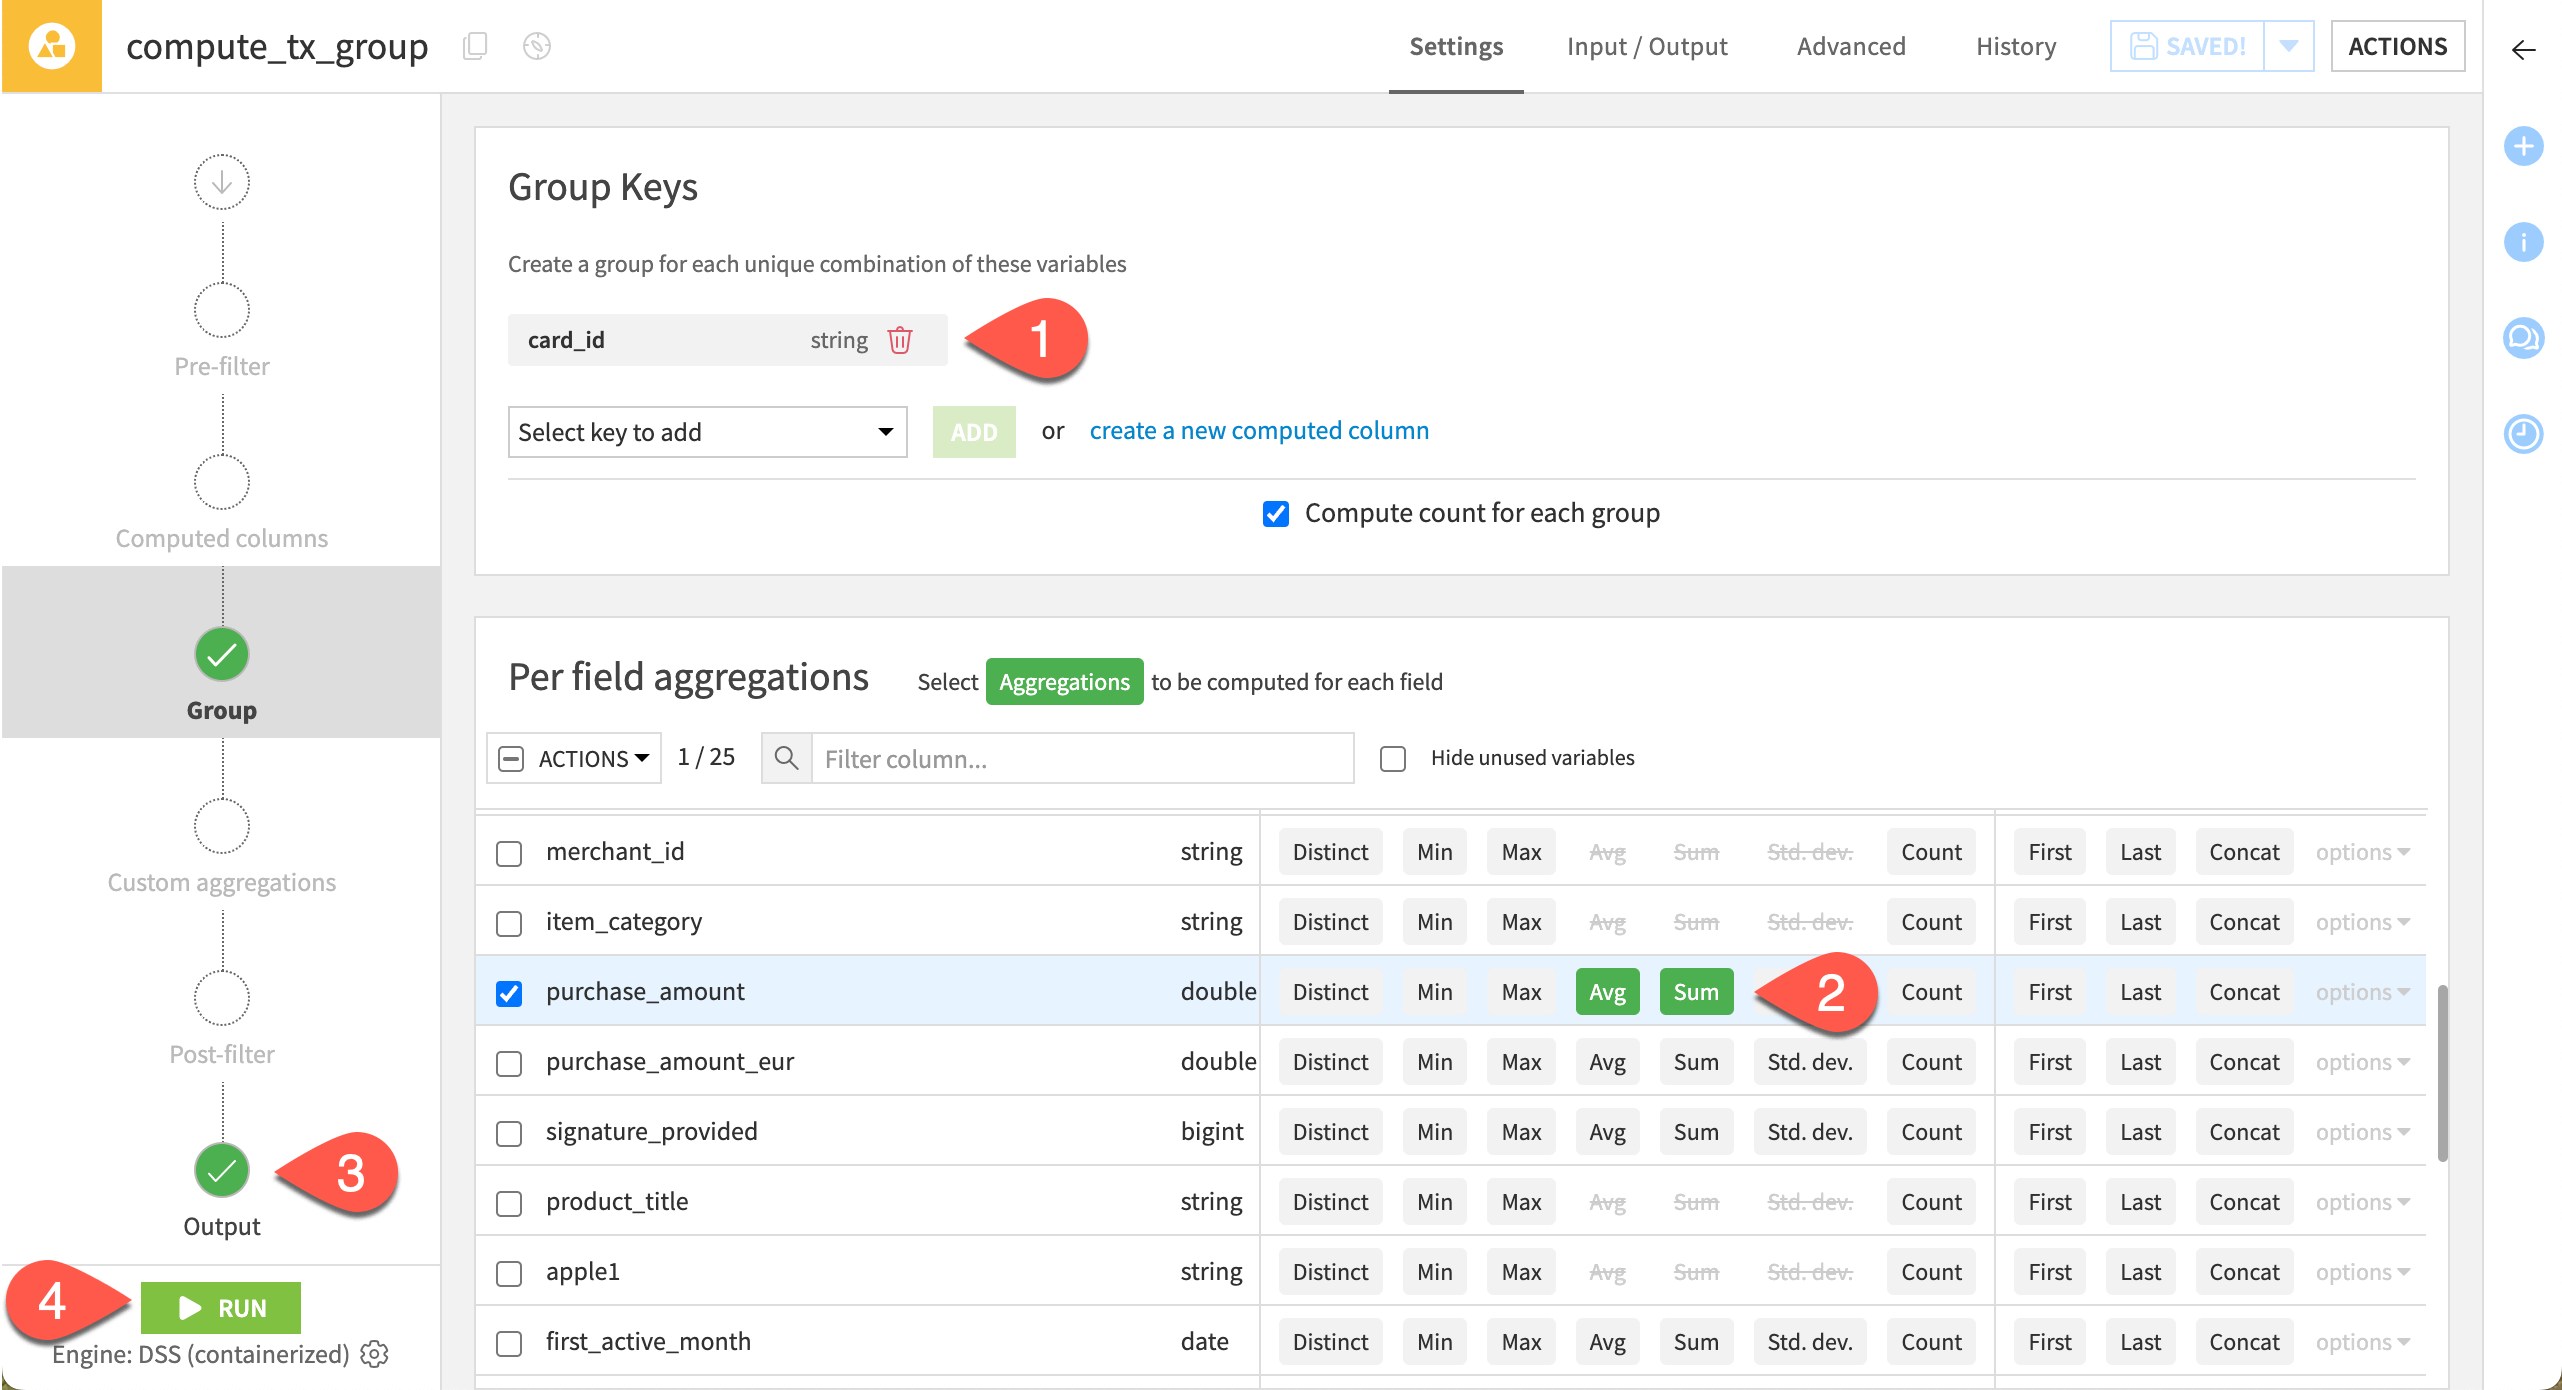
The core step of the Group recipe is the Group step, where you choose which columns to serve as keys and which aggregations you want performed.
In the recipe creation dialog, you’ve already chose the group key. You only need to specify the aggregations. The average and sum of the purchase amount for each card is a good start.
On the Group step, ensure that card_id is a group key column.
Note that, by default, the recipe computes the count for each group.
In the Per field aggregations section, select the following aggregations:
Avg of purchase_amount
Sum of purchase_amount
Before running the recipe, navigate to the Output step.
Rename output columns#
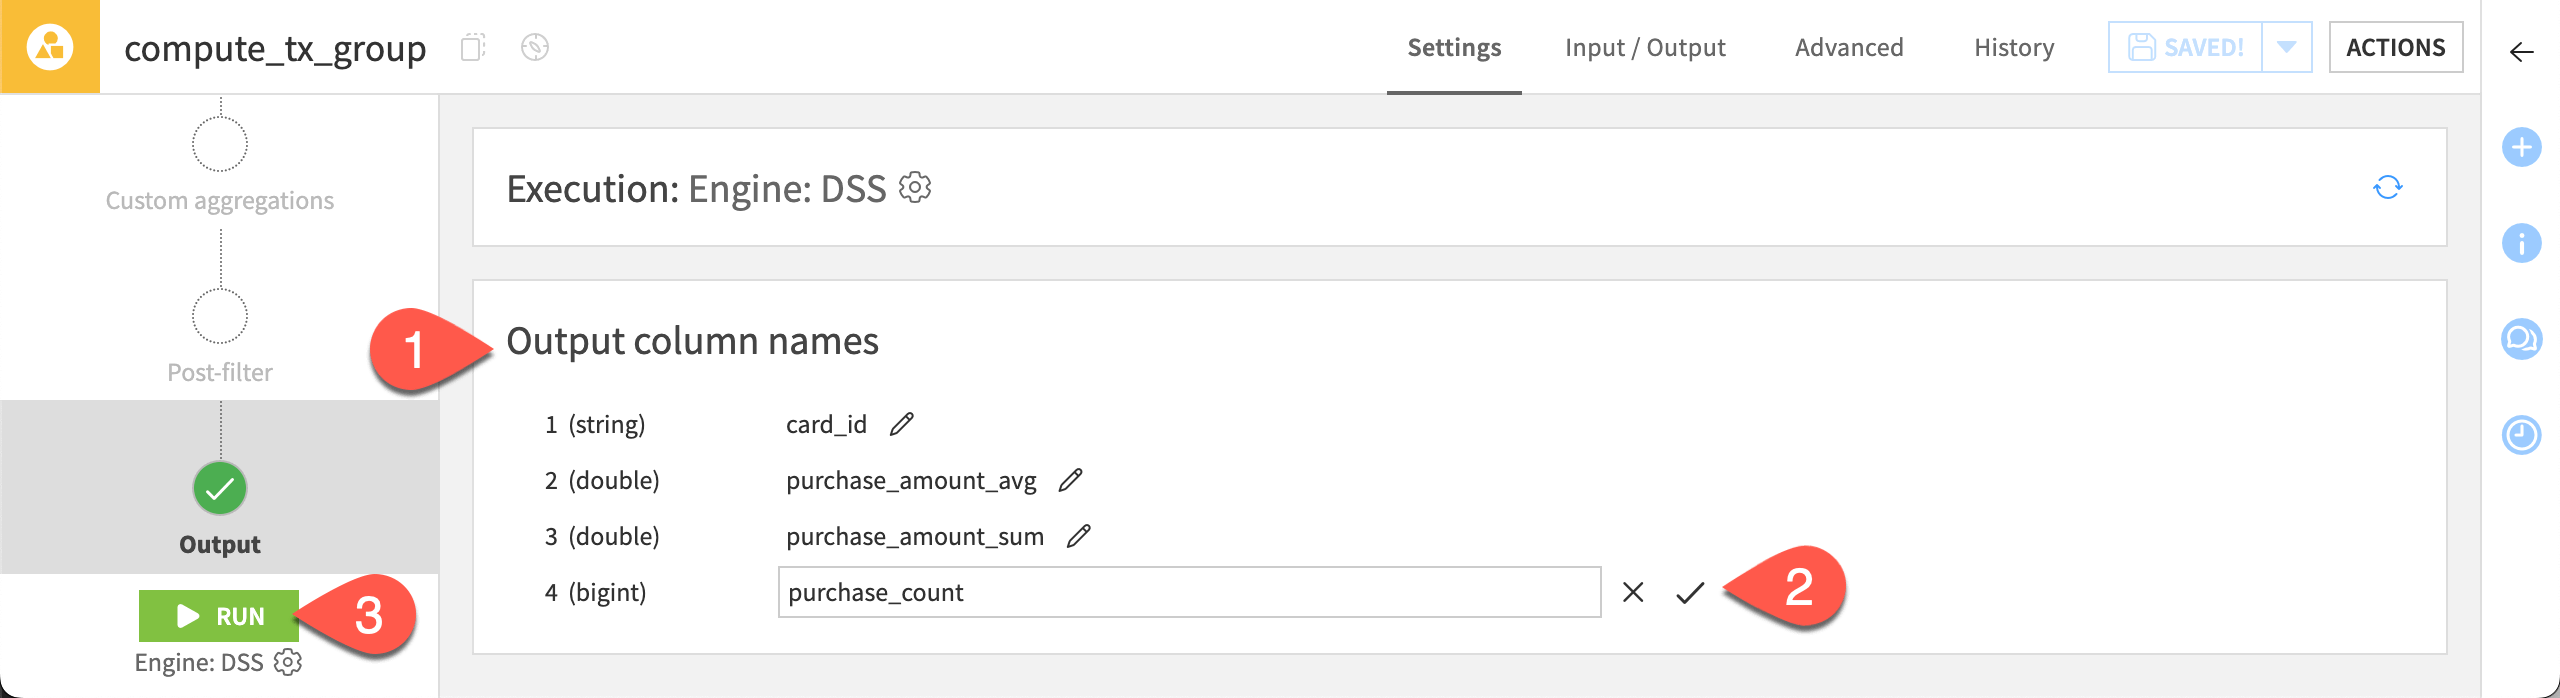
Clear column names are important throughout a Flow—especially after aggregations. The Output step of the Group recipe provides an opportunity to rename columns.
In this case, it’s unclear what the count column represents. Clarify it:
On the Output step, confirm the output schema includes four columns: one for the single group key column and three for the requested aggregations.
Rename count as
purchase_count, and click the checkmark ( ) to accept it.
Click Run to create the new grouped output dataset.
Important
Columns in the input dataset not used in the group key or per field aggregations (like purchase_date and merchant_id) aren’t included in the output dataset. To keep columns not included in the aggregation, you’ll need a Window recipe.
Explore the output dataset#
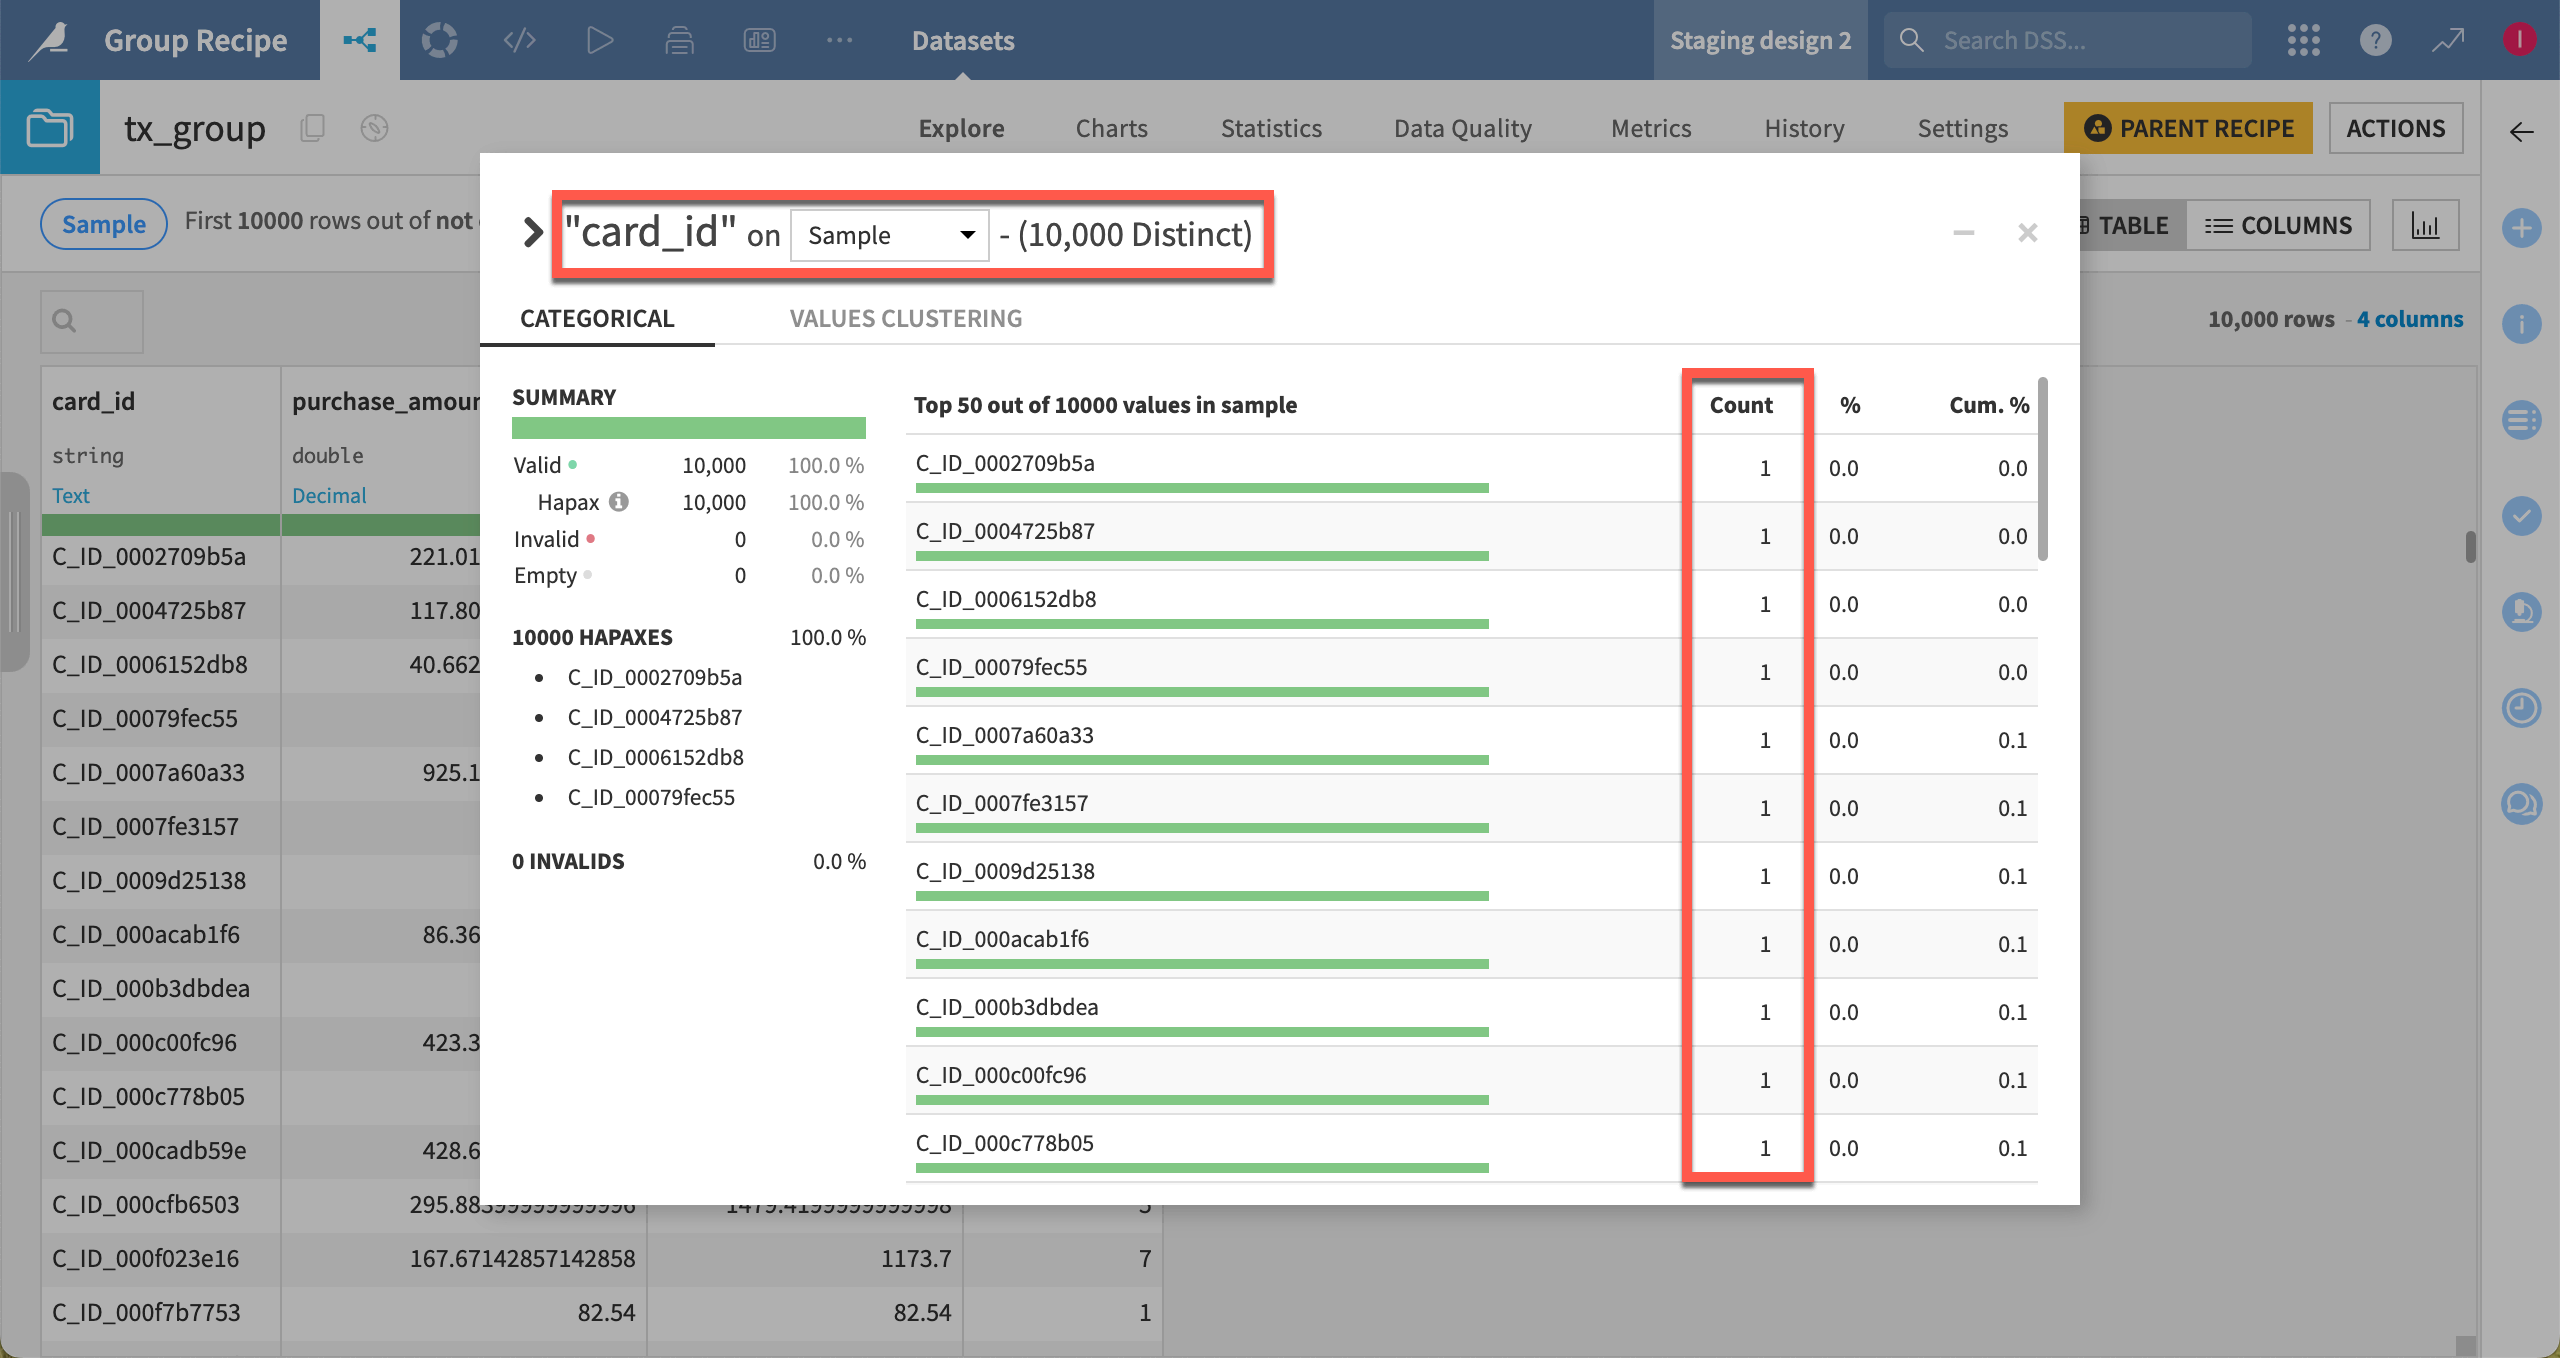
When the computation finishes, confirm your expectations.
Open the tx_group dataset.
Click on the card_id column dropdown, and select Analyze.
Note that after grouping by this column, all values are unique.
Also, be aware that the Explore tab, and the Analyze window, only include a sample of the dataset by default.
Next steps#
Continue to the Tutorial | Window recipe to use advanced grouping in Dataiku.