Concept | Group recipe#
Watch the video

The Group recipe lets you aggregate the values of columns by the values of one or more keys.
Use case#
Throughout any analytics process, you might want to perform various types of aggregations based on the values of particular columns. For example, in a dataset of transactions, you might want to sum the value of transactions according to certain groups such as individual customers, certain product categories, a specific time period like a month, or a geographic unit like a state or country.
The Group recipe is one answer in Dataiku to address this kind of data transformation problem.
It’s capable of taking a dataset like the one on the left and producing the one on the right.
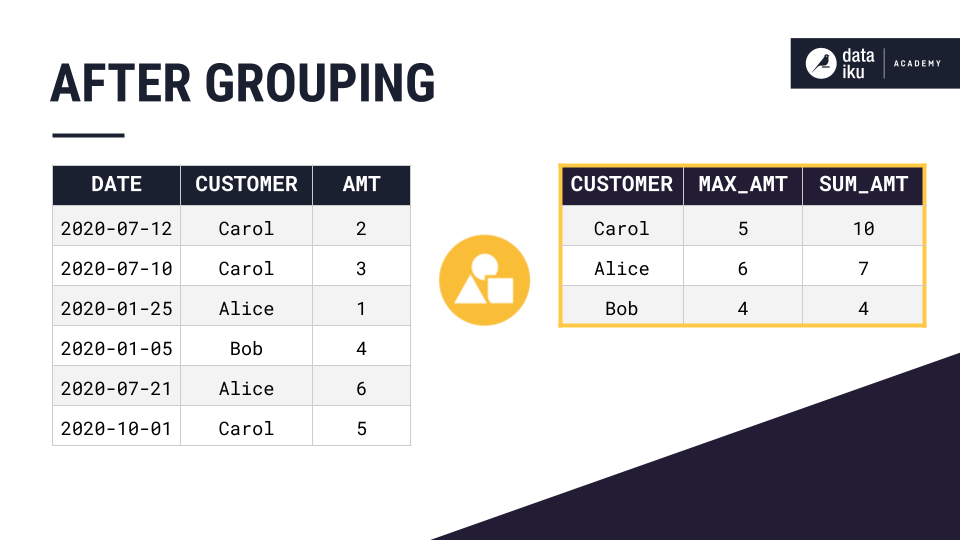
In the case above, we group by all of the unique values of the customer column and aggregate them by maximum and sum, so each unique customer only appears once.
Group components#
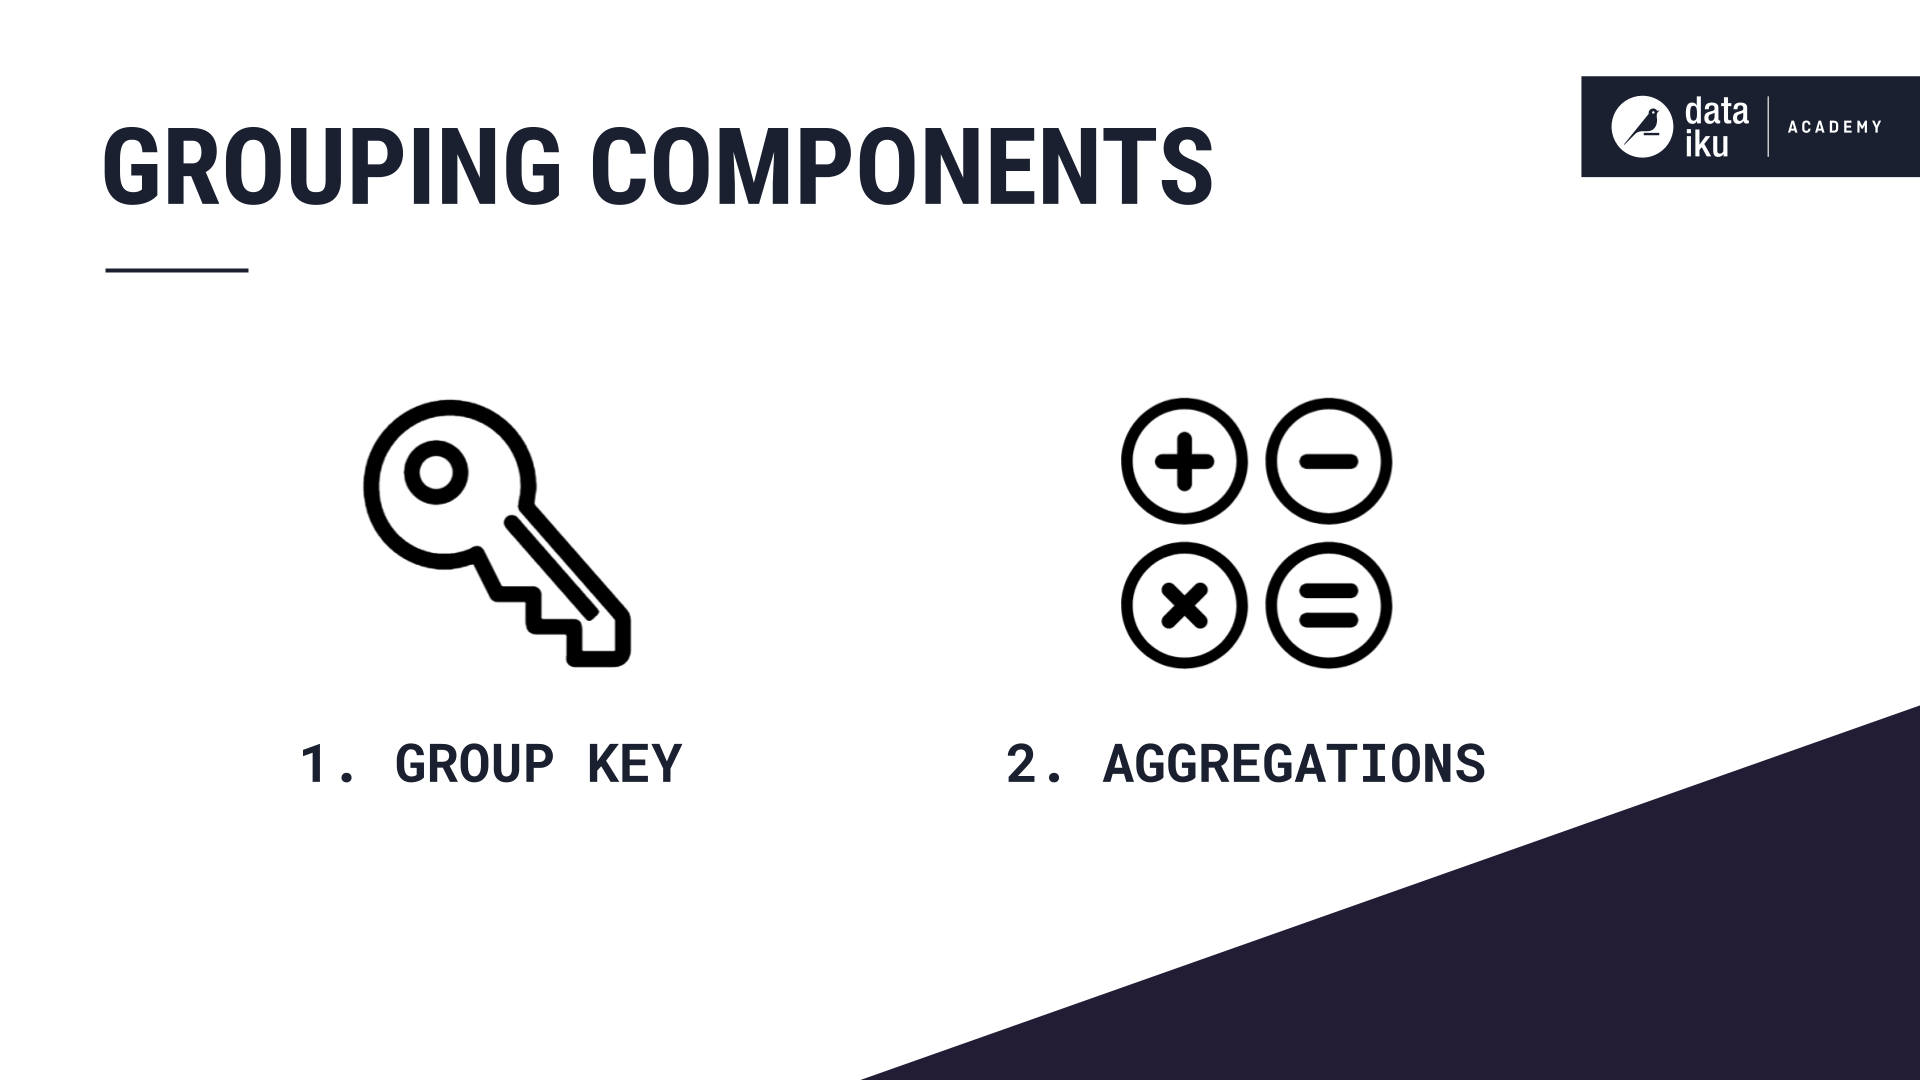
The concept of grouping has two important components:
Group key#
The first component is choosing which columns will serve as the group key.
The output dataset will have the same number of rows as unique combinations of values in the group key columns.
In the example above, the customer column was the group key.
Aggregation#
The second component is defining the aggregations.
For each unique value in the group key column, what do you want to calculate?
In the example above, this was the maximum and sum of the sale amount for each customer.
Grouping with Dataiku#
Group step#
In Dataiku, the Group recipe is an obvious choice to perform a grouping transformation.
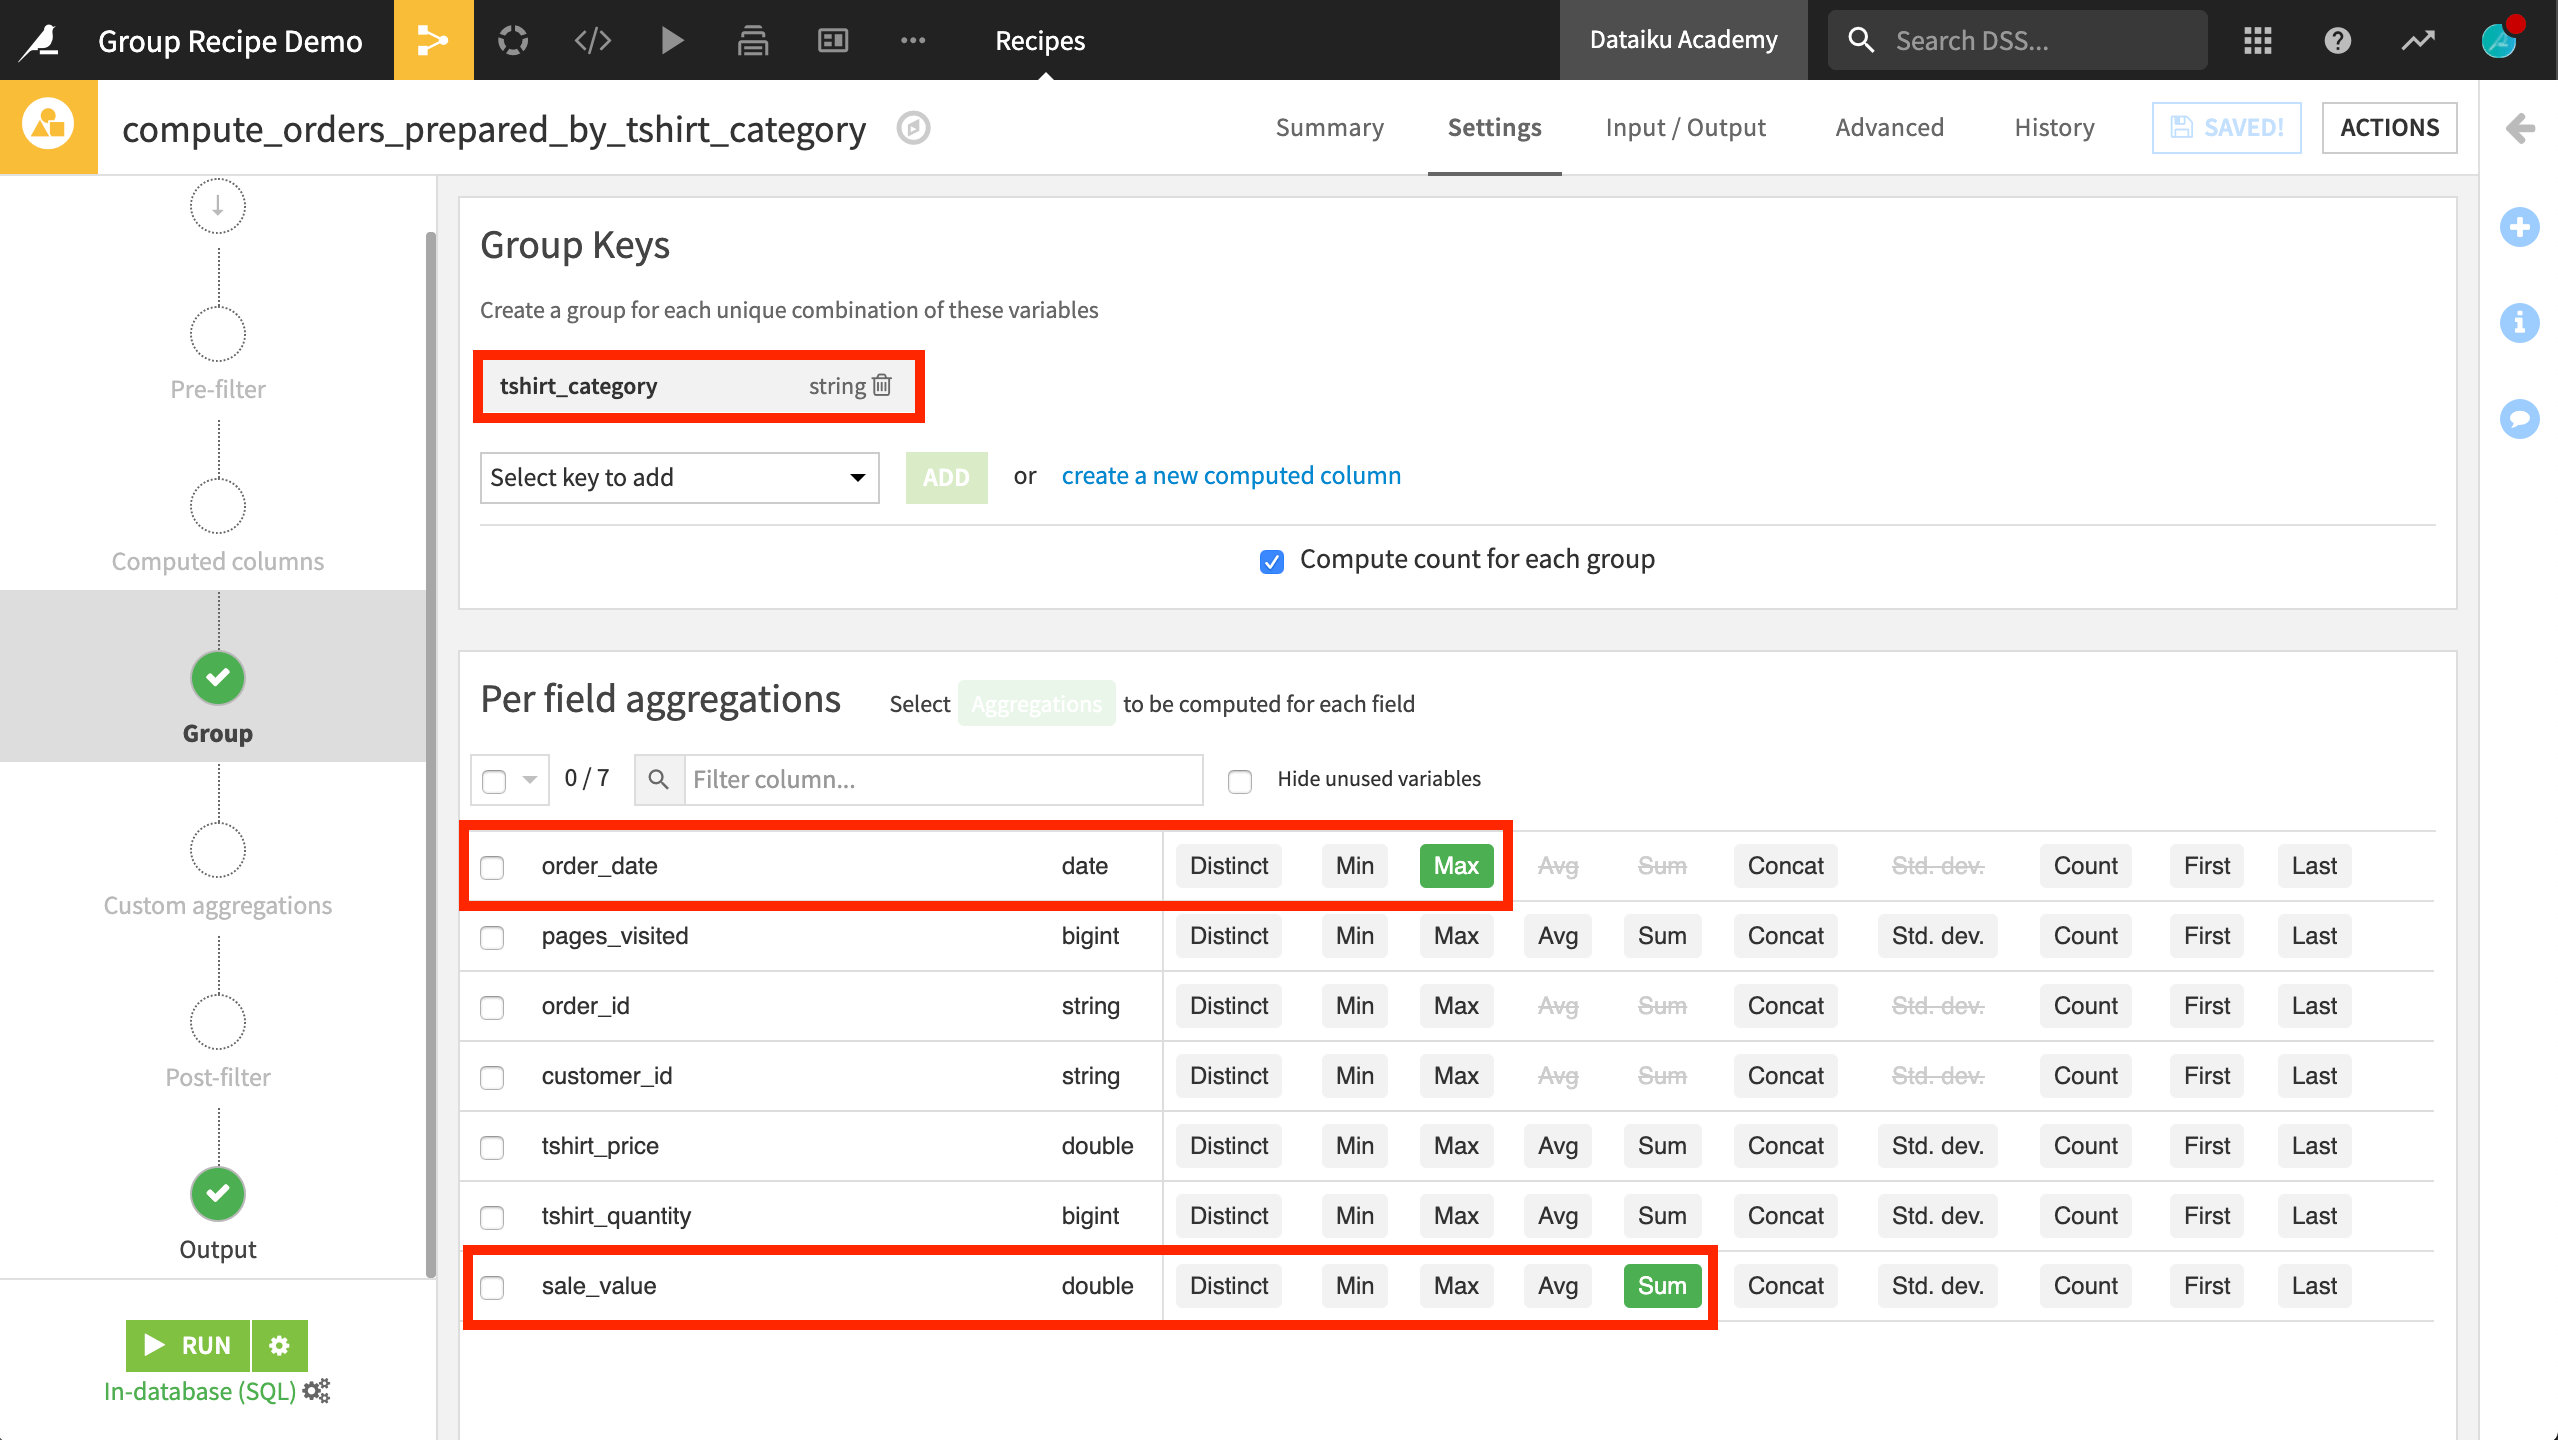
After initiating a recipe, you first need to choose the group key. In the example shown below, tshirt_category is selected as the group key. The output dataset will have one row corresponding to each unique value in this column.
Note
In the example above, a single column serves as the group key, but it’s possible to have more. For example, if grouping orders by month, columns for year and month might both be needed to serve as the key. In which case, the number of rows would be equal to the number of unique combinations of values in both key columns.
After setting the group key, the next step is to choose the per-field aggregations.
Several kinds of aggregations are natively available. Keep in mind:
The types of available aggregations depend on the types of variables (for example, numeric or categorical).
The median aggregation is available with SQL engines only.
If no aggregations are set for a particular variable, that variable will be excluded from the output set.
If none of these native aggregations meet your needs, you can also define custom aggregations in SQL code on the Custom aggregations step.
Output step#
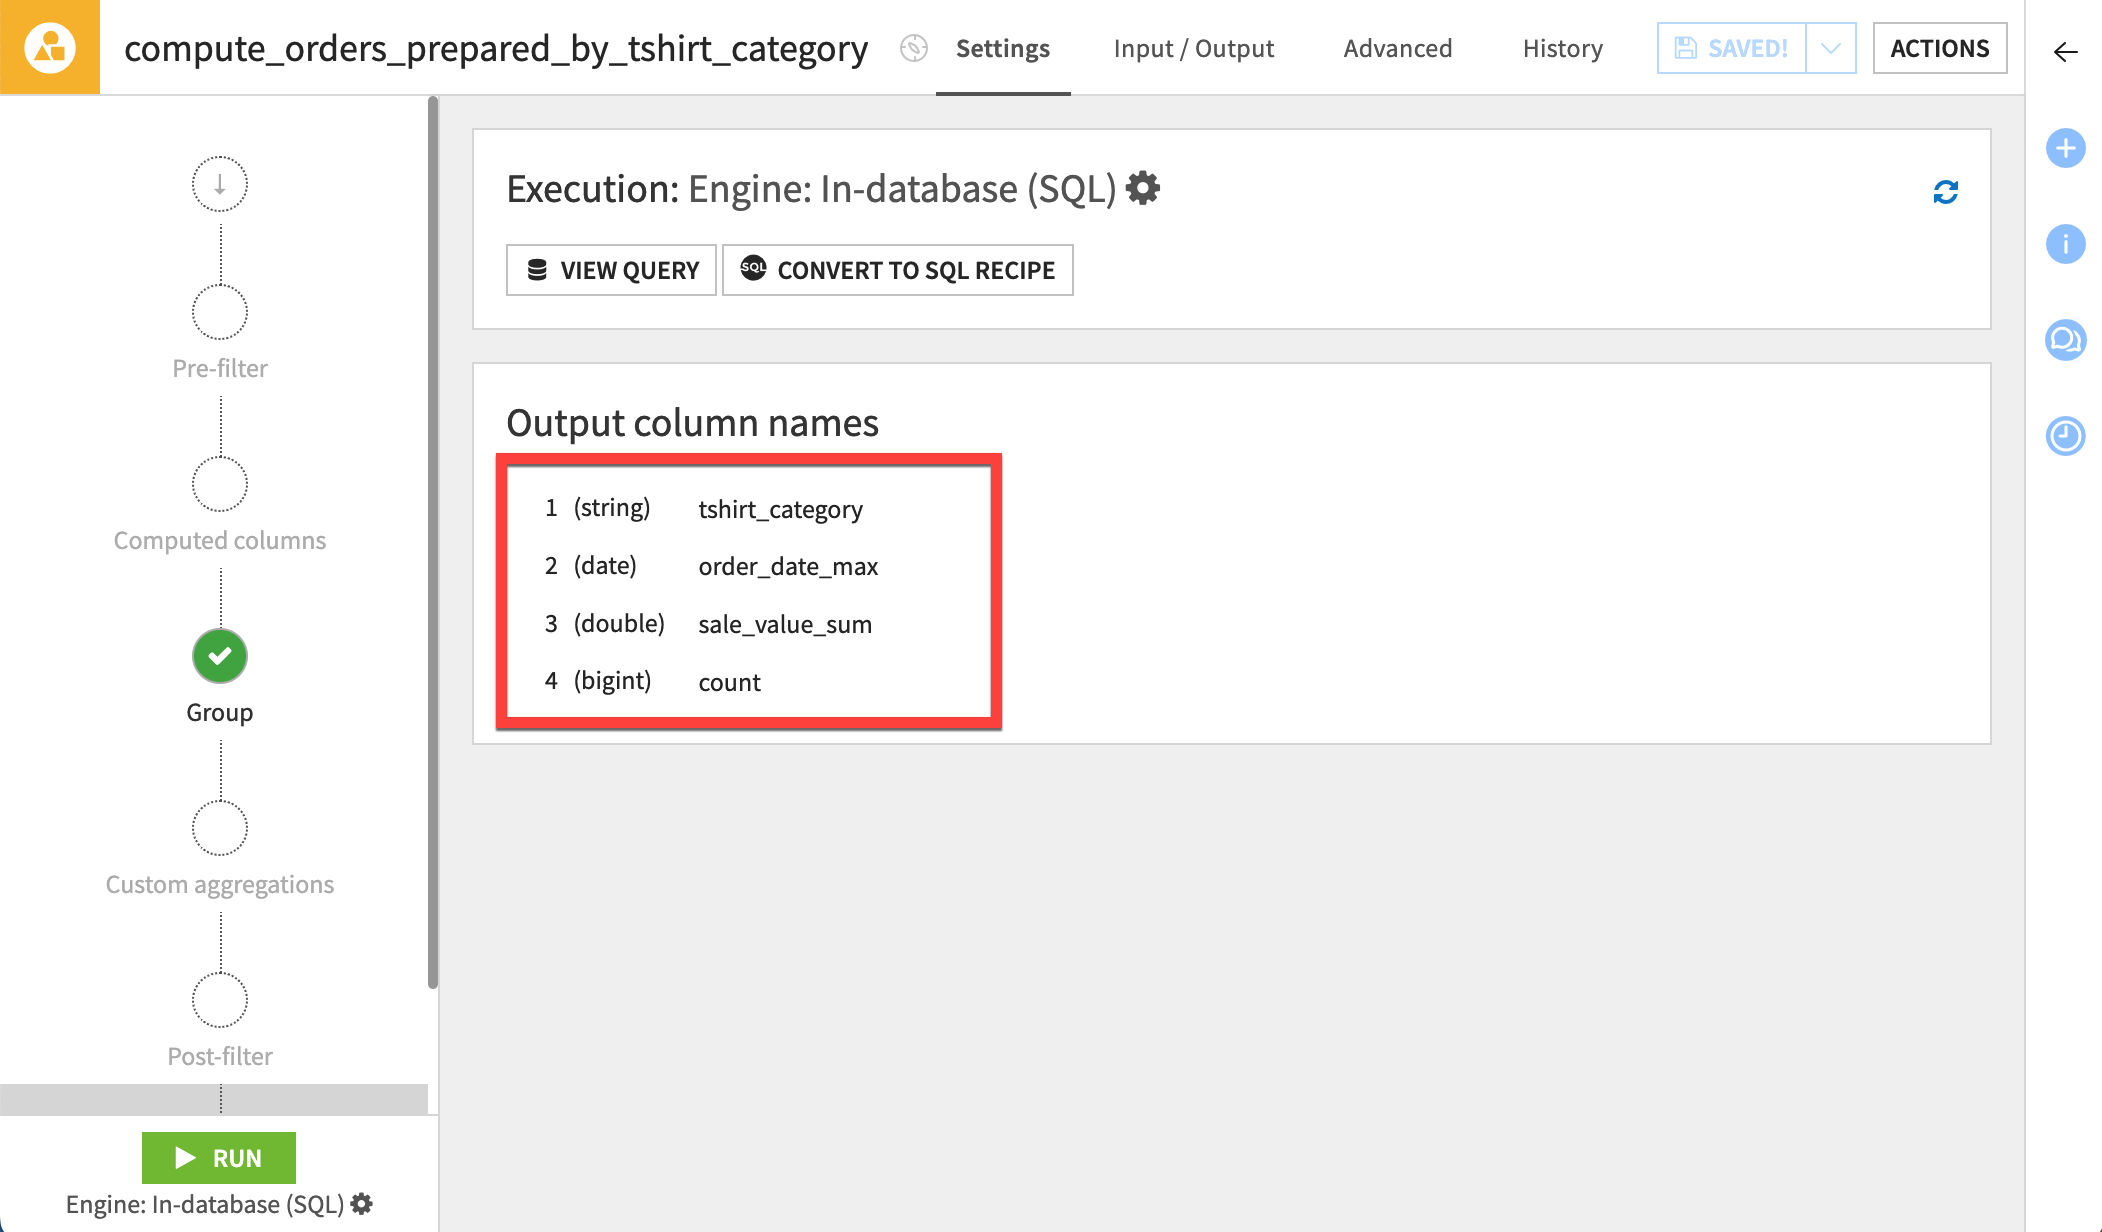
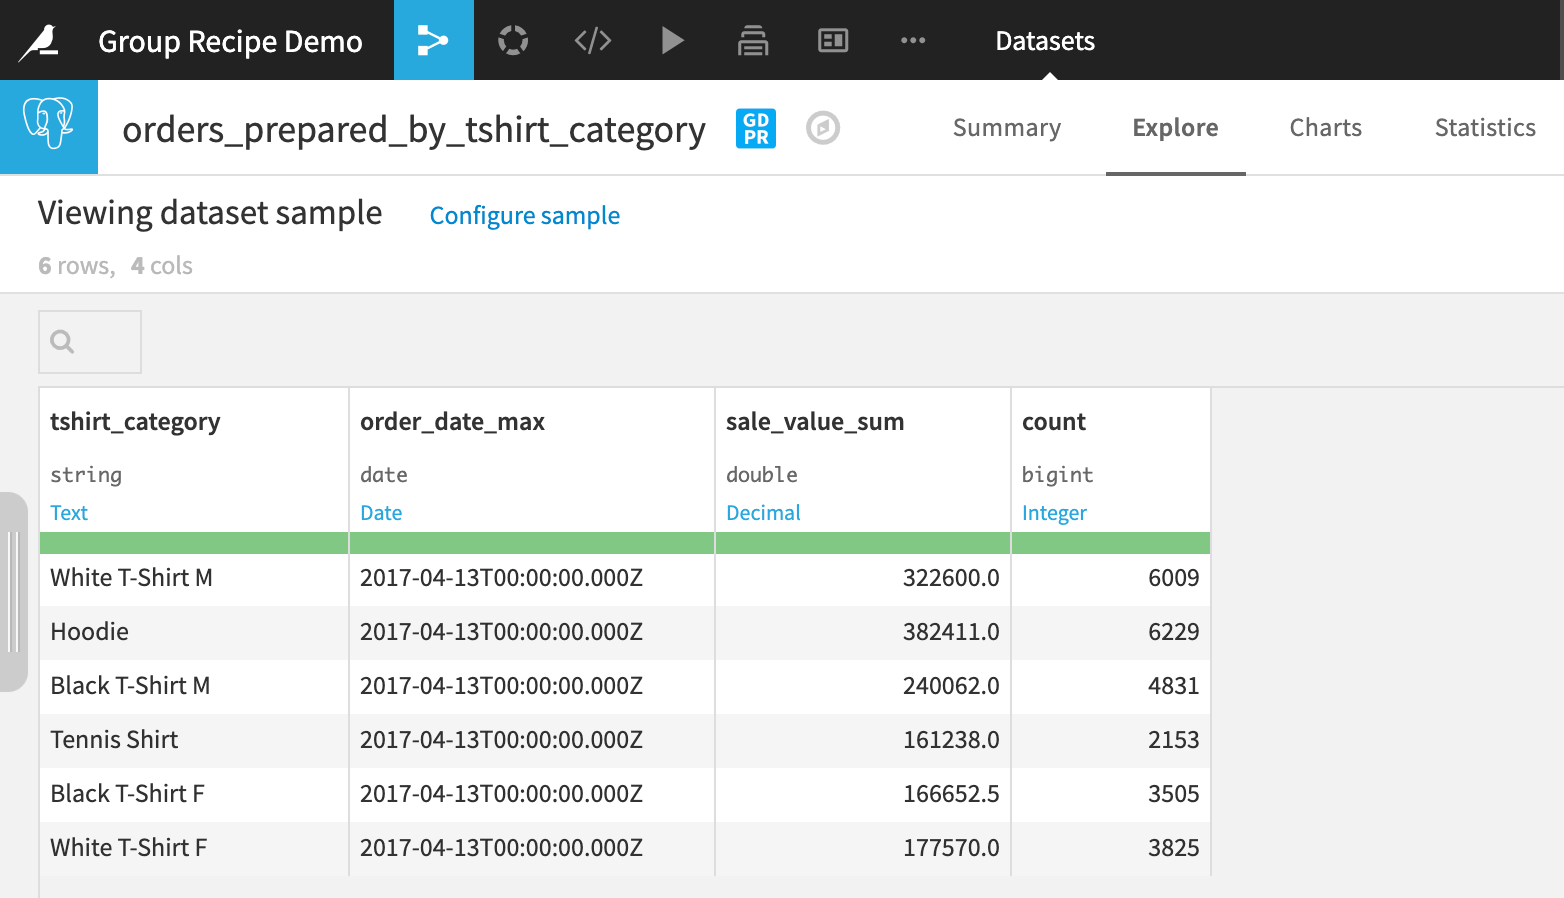
In the Output step of the recipe, you can see that four columns will be included in the output dataset. These columns represent:
The group key
The max order date
The sum of sale values
The count of records of each key
You can also rename the columns in this step by clicking the column name.
SQL query#
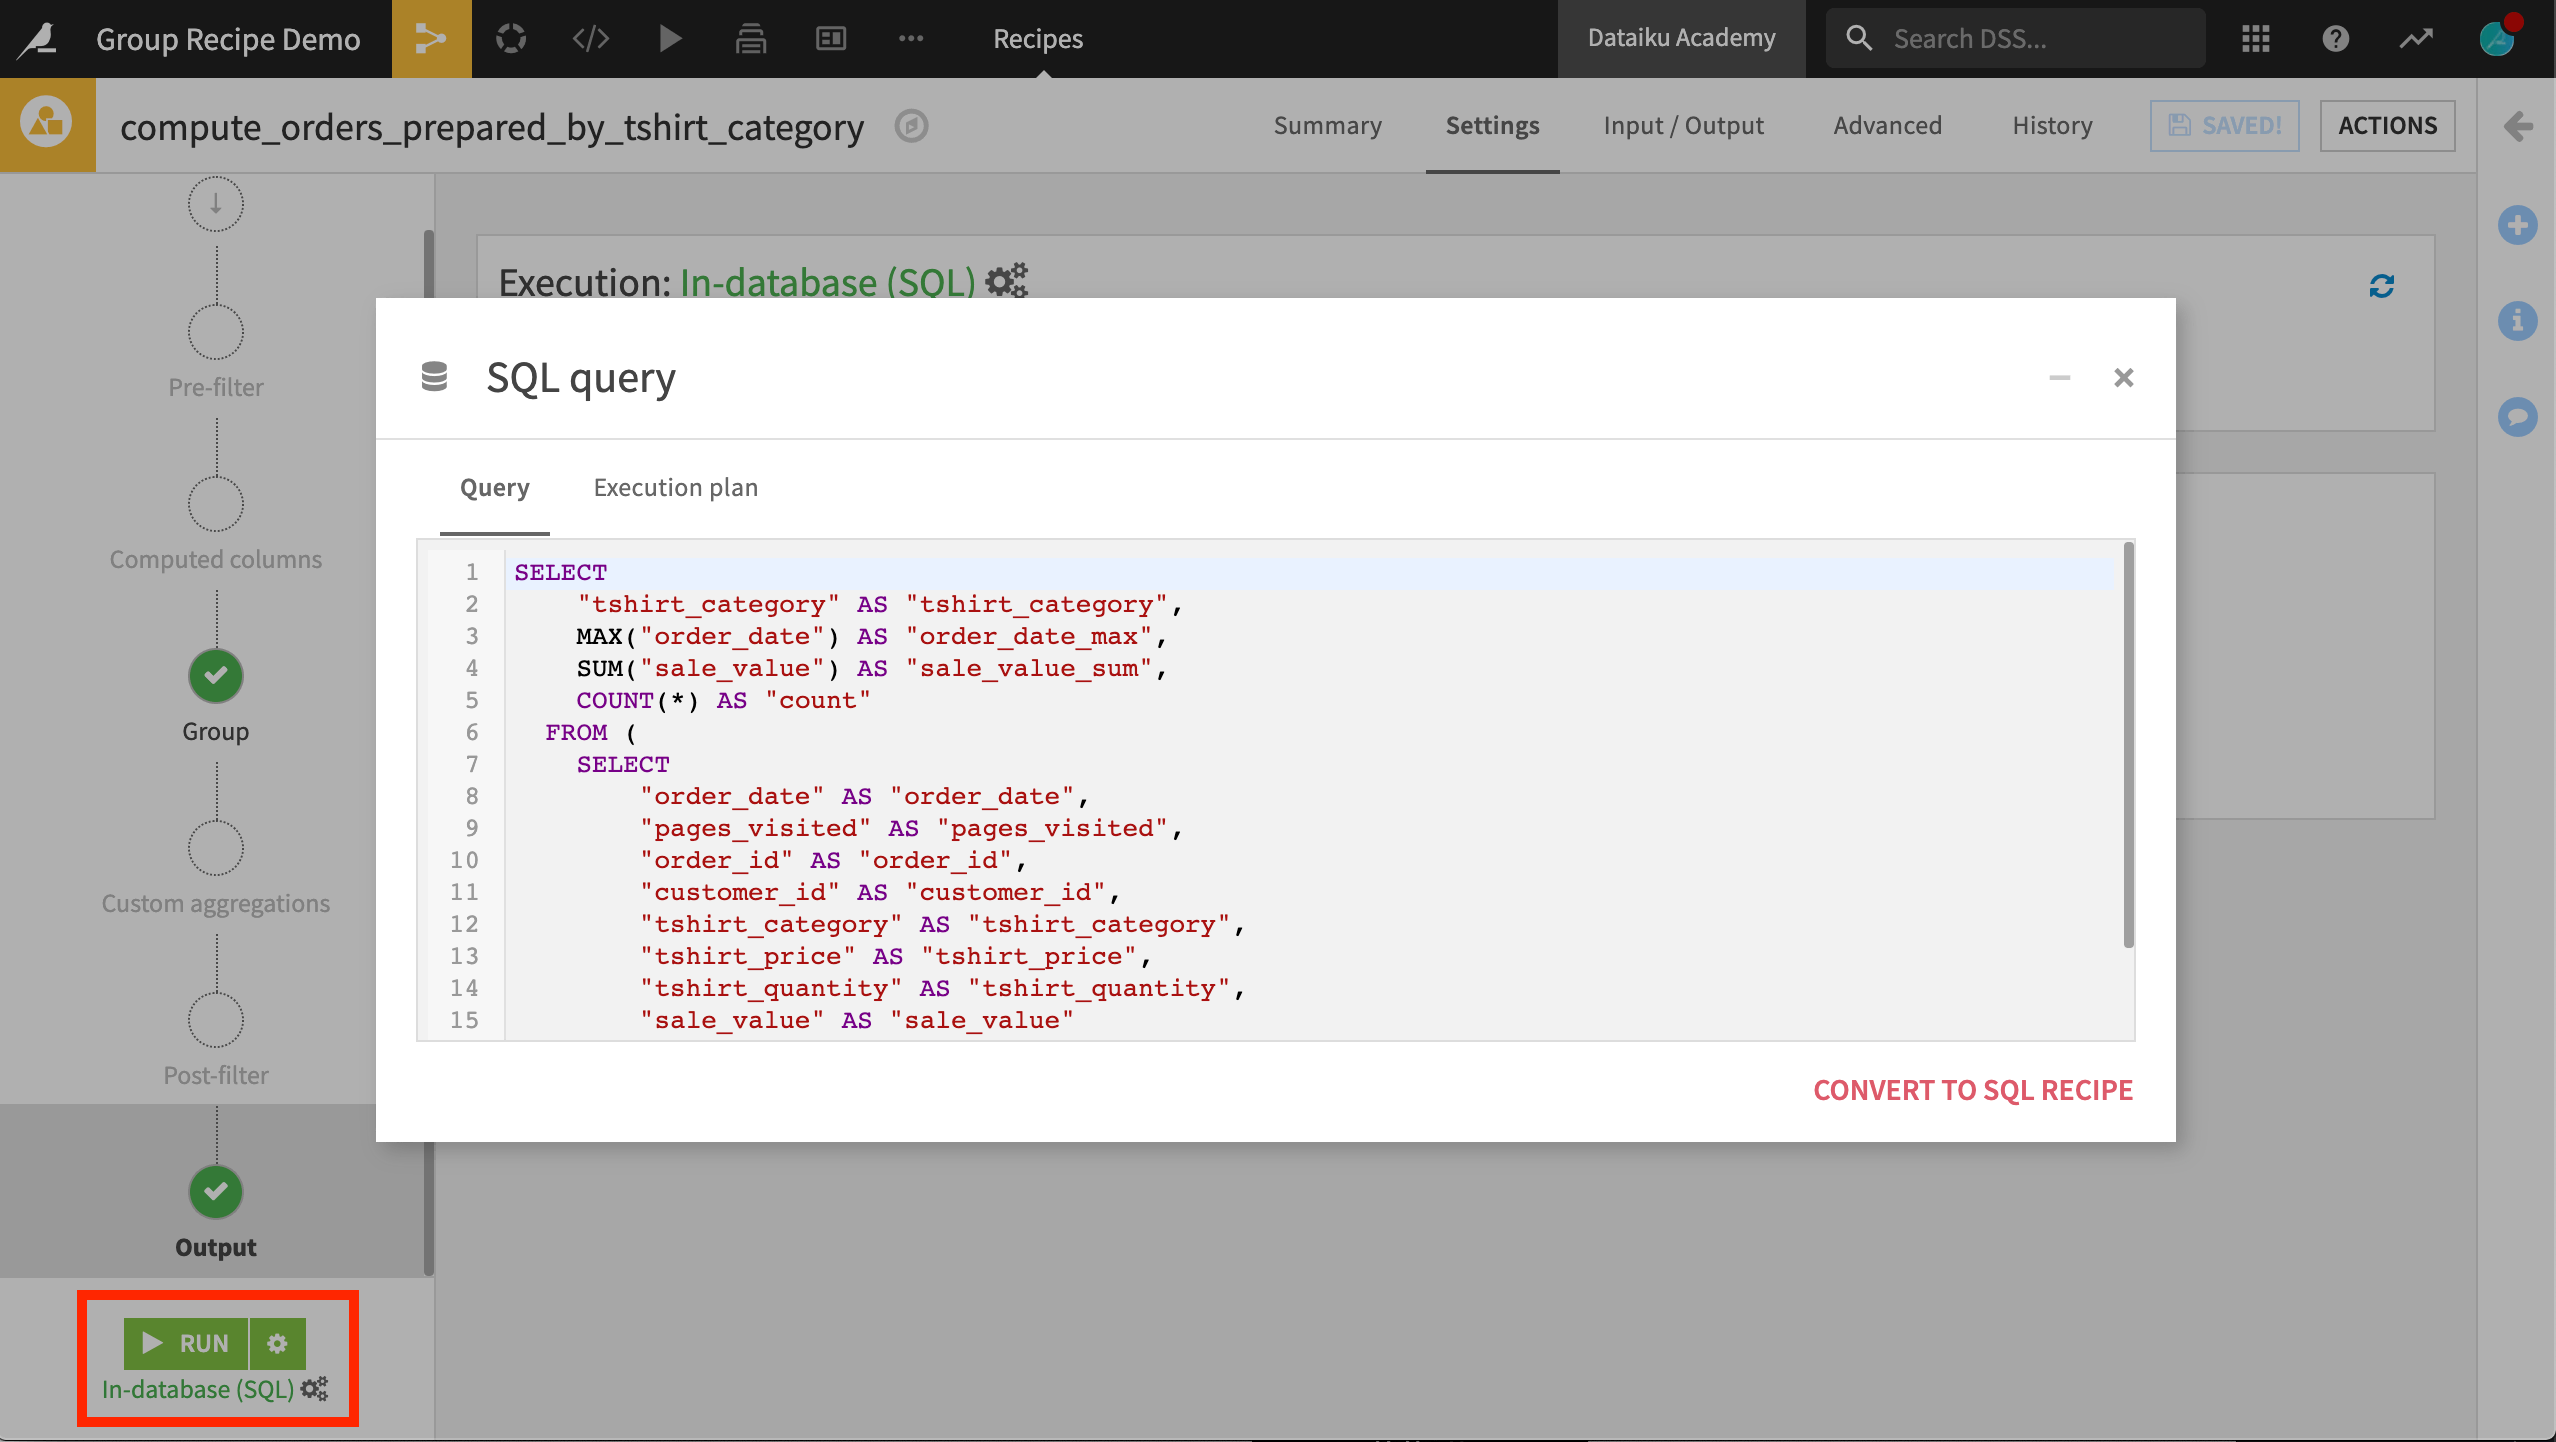
If you are familiar with SQL, you may recognize that the Group recipe is the equivalent of an SQL GROUP BY statement. In fact, for eligible in-database computations, you can view the SQL query underneath the visual layer of the Group recipe.
Output dataset#
After running the recipe, you are left with only the unique combinations of the group key and the requested aggregations for each.
Next steps#
Now, you know how to perform group-wise aggregations using the Group visual recipe!
Continue learning about this recipe by working through the Tutorial | Group recipe article.
Tip
You can find this content (and more) by registering for the Dataiku Academy course, Visual Recipes. When ready, challenge yourself to earn a certification!

