Tutorial | In-database data visualization and preparation#
Get started#
Once you have an SQL connection available in Dataiku, you can use it as a storage and computation layer underneath native charts and visual data preparation in Dataiku Flows.
Objectives#
In this tutorial, you will:
Build a chart with the in-database engine.
Create a visual recipe that runs in-database.
Prerequisites#
Dataiku 12.0 or later.
You will need access to a Dataiku instance with an available SQL connection. If you don’t have one yet, see Tutorial | Configure a connection between Dataiku and an SQL database.
Create the project#
From the Dataiku Design homepage, click + New Project.
Select Learning projects.
Search for and select In-database Operations.
If needed, change the folder into which the project will be installed, and click Create.
From the project homepage, click Go to Flow (or type
g+f).
From the Dataiku Design homepage, click + New Project.
Select DSS tutorials.
Filter by Core Designer.
Select In-database Operations.
From the project homepage, click Go to Flow (or type
g+f).
Note
You can also download the starter project from this website and import it as a ZIP file.
Change connections#
The datasets in the Flow aren’t yet synced to your specific SQL database. Let’s fix that first.
From the Flow, multi-select all datasets computed by Dataiku (all except the two leftmost uploaded files).
Near the bottom of the right panel’s Actions tab, select Change connection.
For the new connection field, select an available SQL connection.
Click Save.
Note
For more information, see Concept | Connection changes.
You’ll next want to build the Flow.
Click Flow Actions at the bottom right of the Flow.
Click Build all.
Keep the default settings and click Build.
Use case summary#
The Flow begins from two uploaded CSV files:
Dataset |
Description |
|---|---|
orders |
Order information for t-shirts, including the order’s date, the type of t-shirt, and the customer who placed the order. |
customers_stacked |
Additional information about the customers who have placed a t-shirt order. |
Build charts in-database#
Like the dataset preview in the Explore tab, charts by default represent a sample of the dataset. When this sample is representative, a chart based on a sample may be adequate.
However, in other cases, you may need a complete representation of the entire data. If a dataset is stored in an SQL database, you can efficiently compute a chart on the complete dataset using the in-database engine.
Note
You may also wish to review Concept | In-database charts.
Create a chart#
Start with a simple chart.
Open the customers_stacked_prepared dataset.
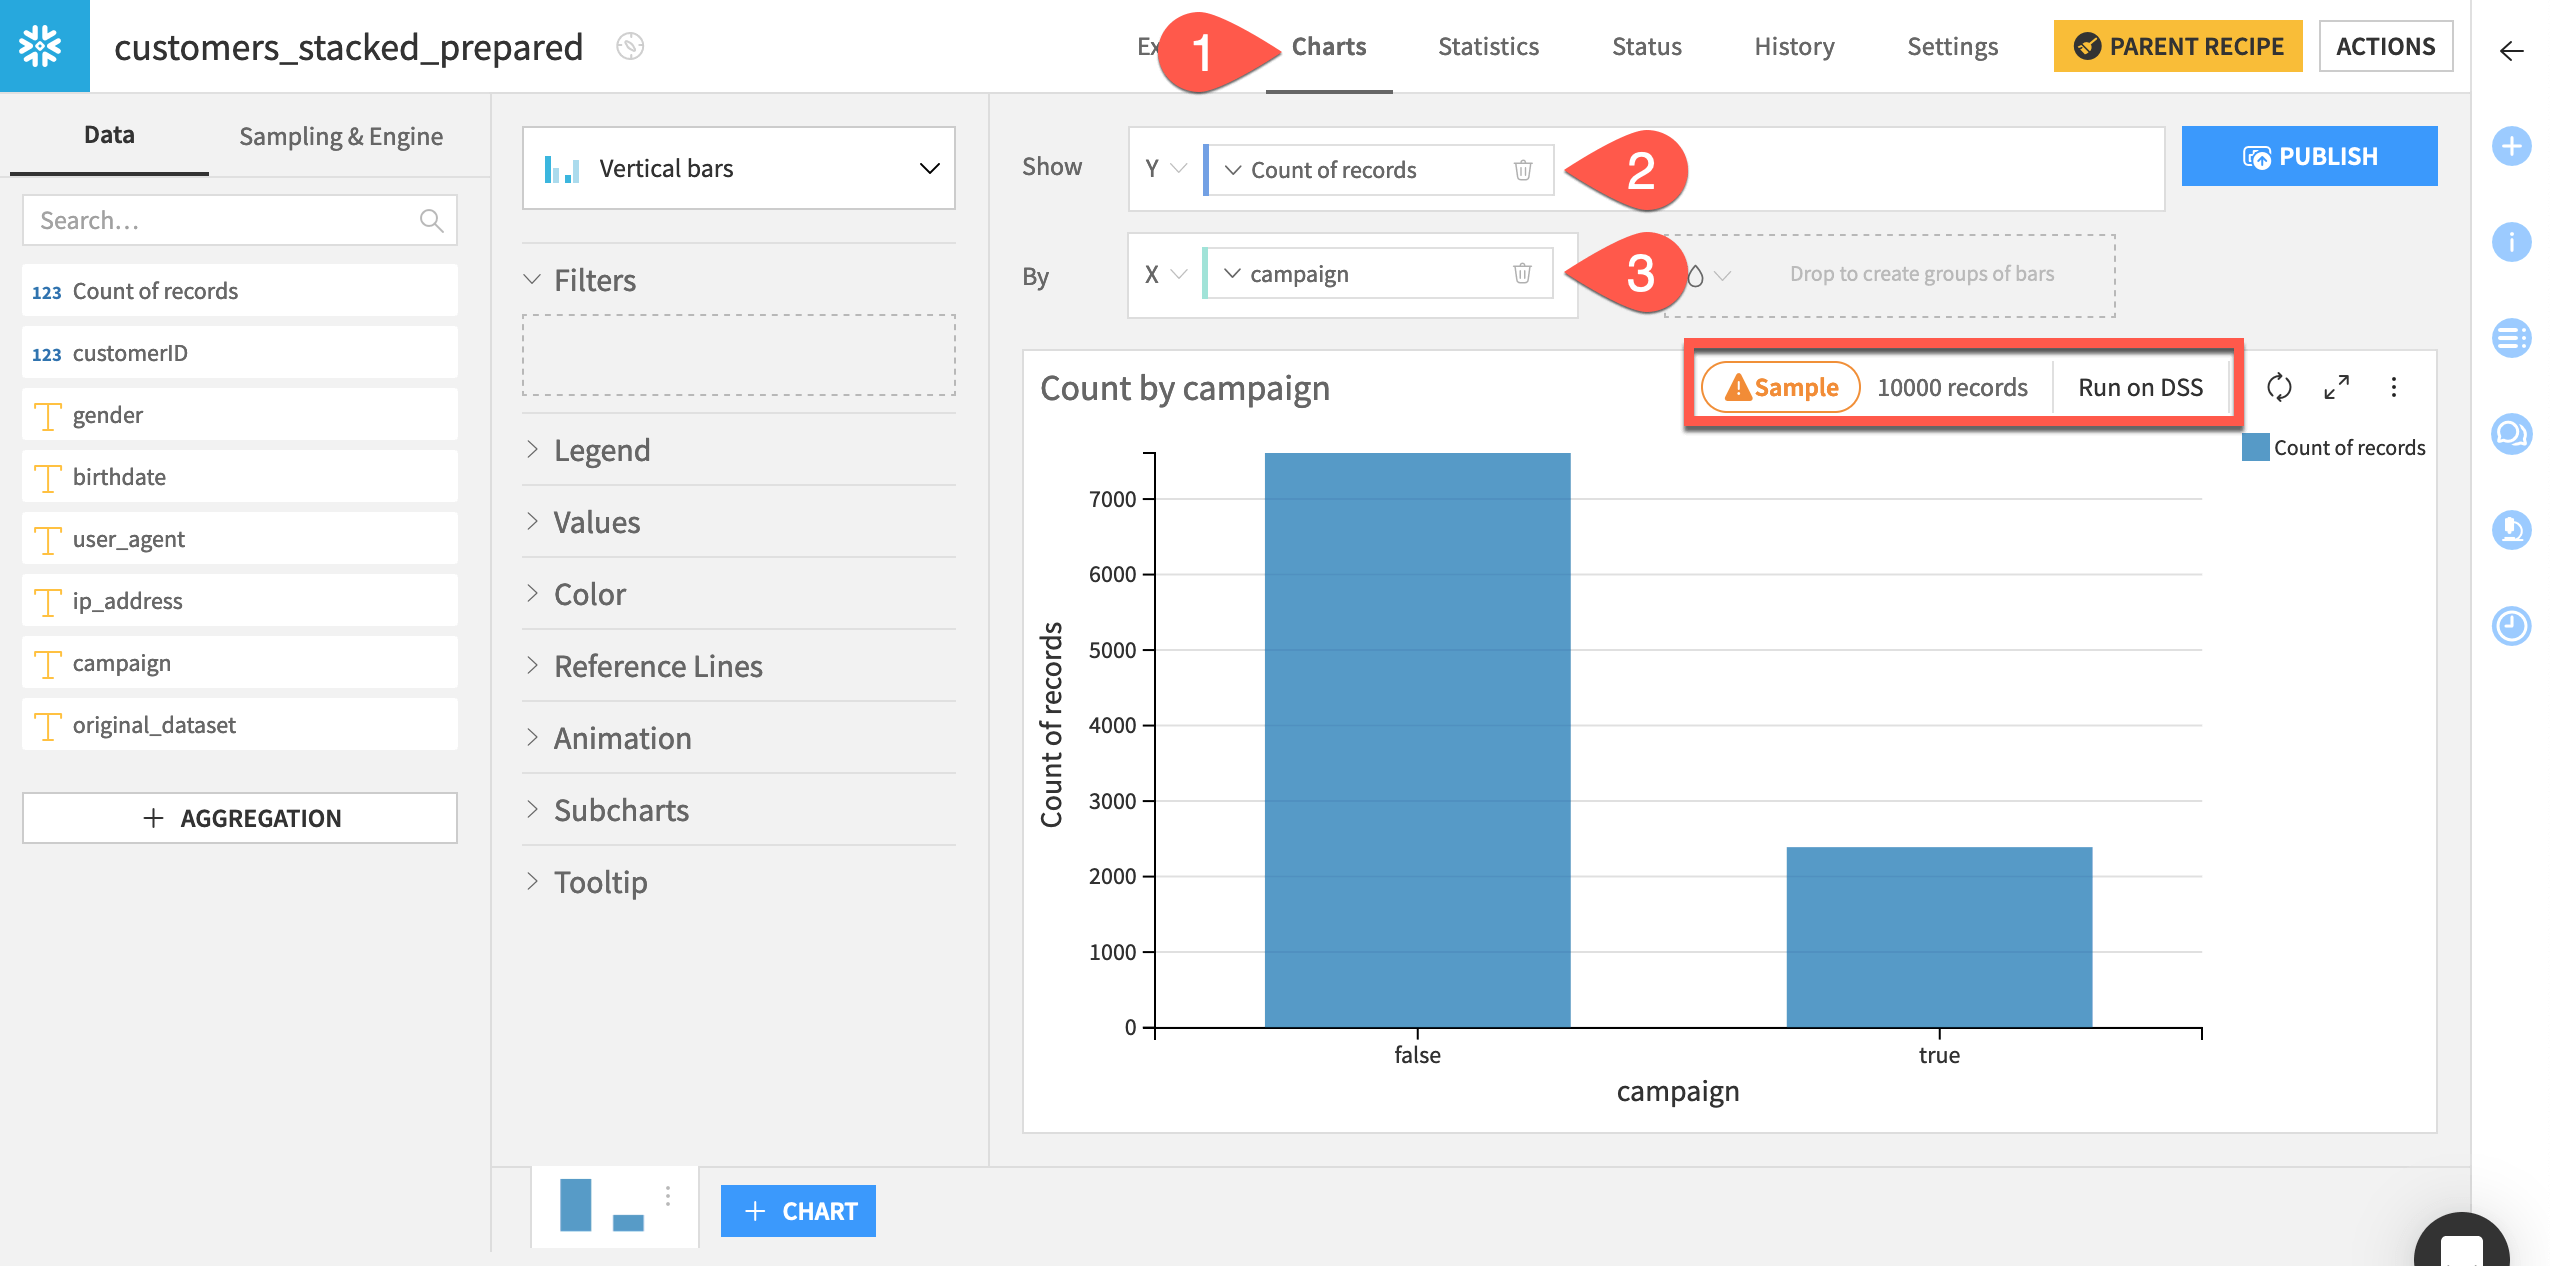
Navigate to the Charts tab (
g+v).In the default bar chart, drag Count of records to the Y axis.
Drag campaign to the X axis.
Recognize that the chart represents only a sample of the data.
Use the in-database engine#
At the moment, the chart represents only the present sample of the data. Switch to the in-database engine.
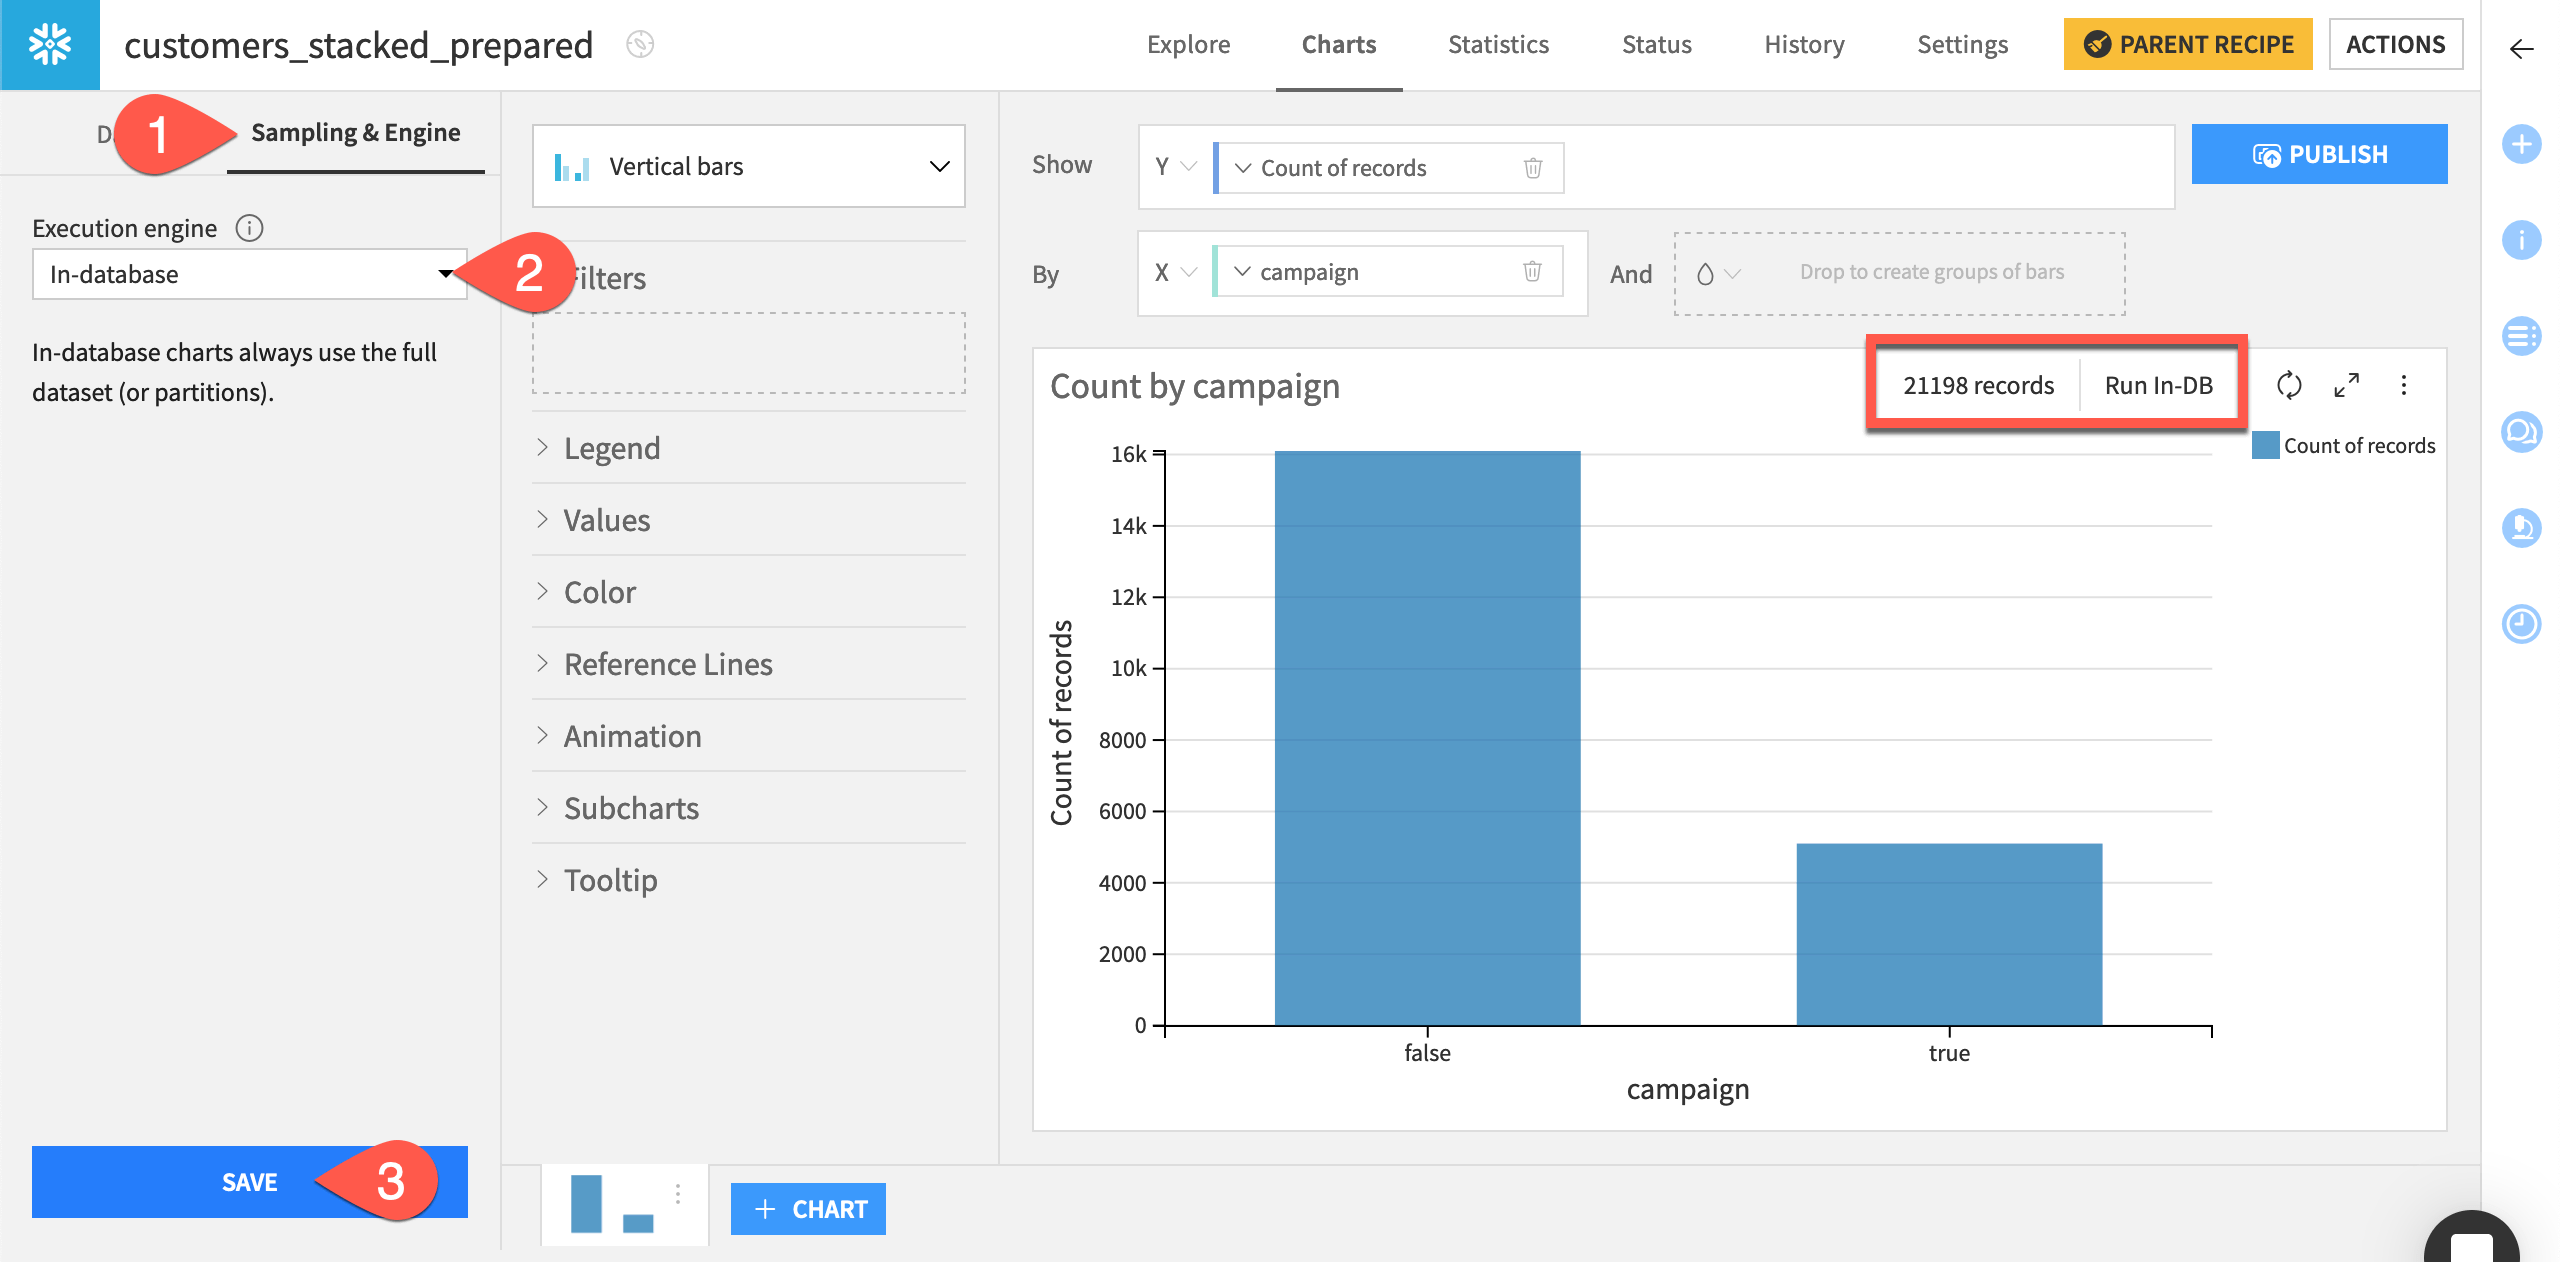
Click on the Sampling & Engine tab of the left pane.
For the execution engine, select In-database.
Click Save.
Recognize that the chart now reflects the full set of records.
See also
Learn more in the reference documentation about sampling and engines for charts.
Run visual recipes in-database#
In addition to building charts using the in-database engine, you can also run many visual recipes in-database, provided you’ve met certain conditions. Most importantly, the input and output datasets must be stored in the same database.
Create a Join recipe#
Start with a typical Join recipe.
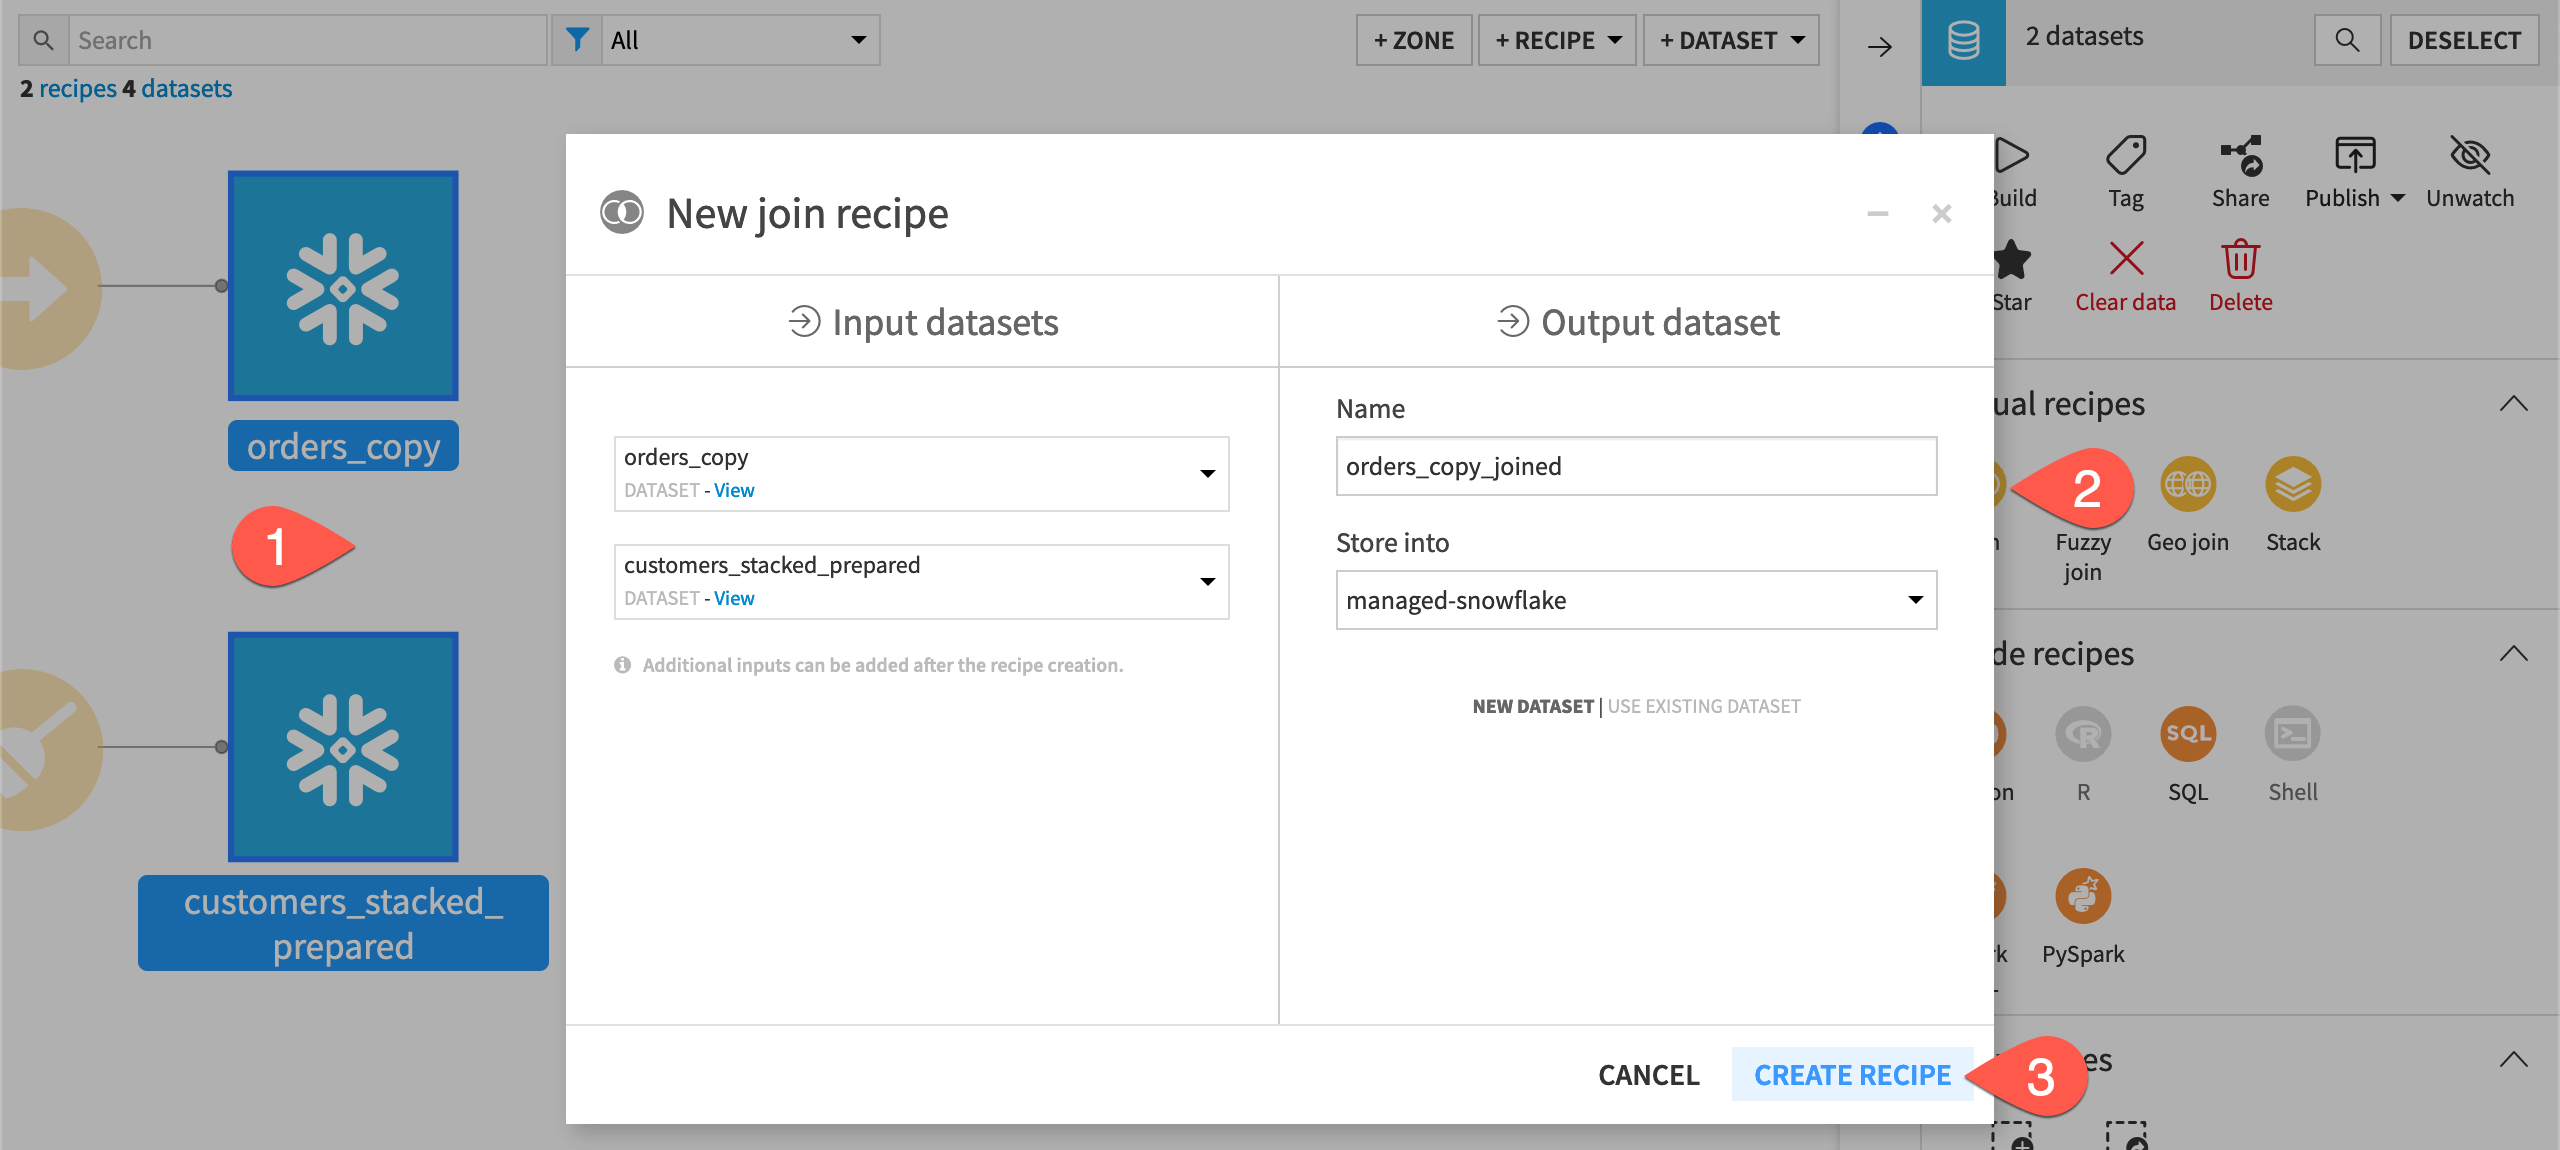
From the Flow, select the orders_copy and then customers_stacked_prepared datasets.
In the Actions (
) tab of the right panel, select Join from the menu of visual recipes.
Click Create Recipe.
Set a join condition#
The next step is to define the join condition. A simple left join will do.
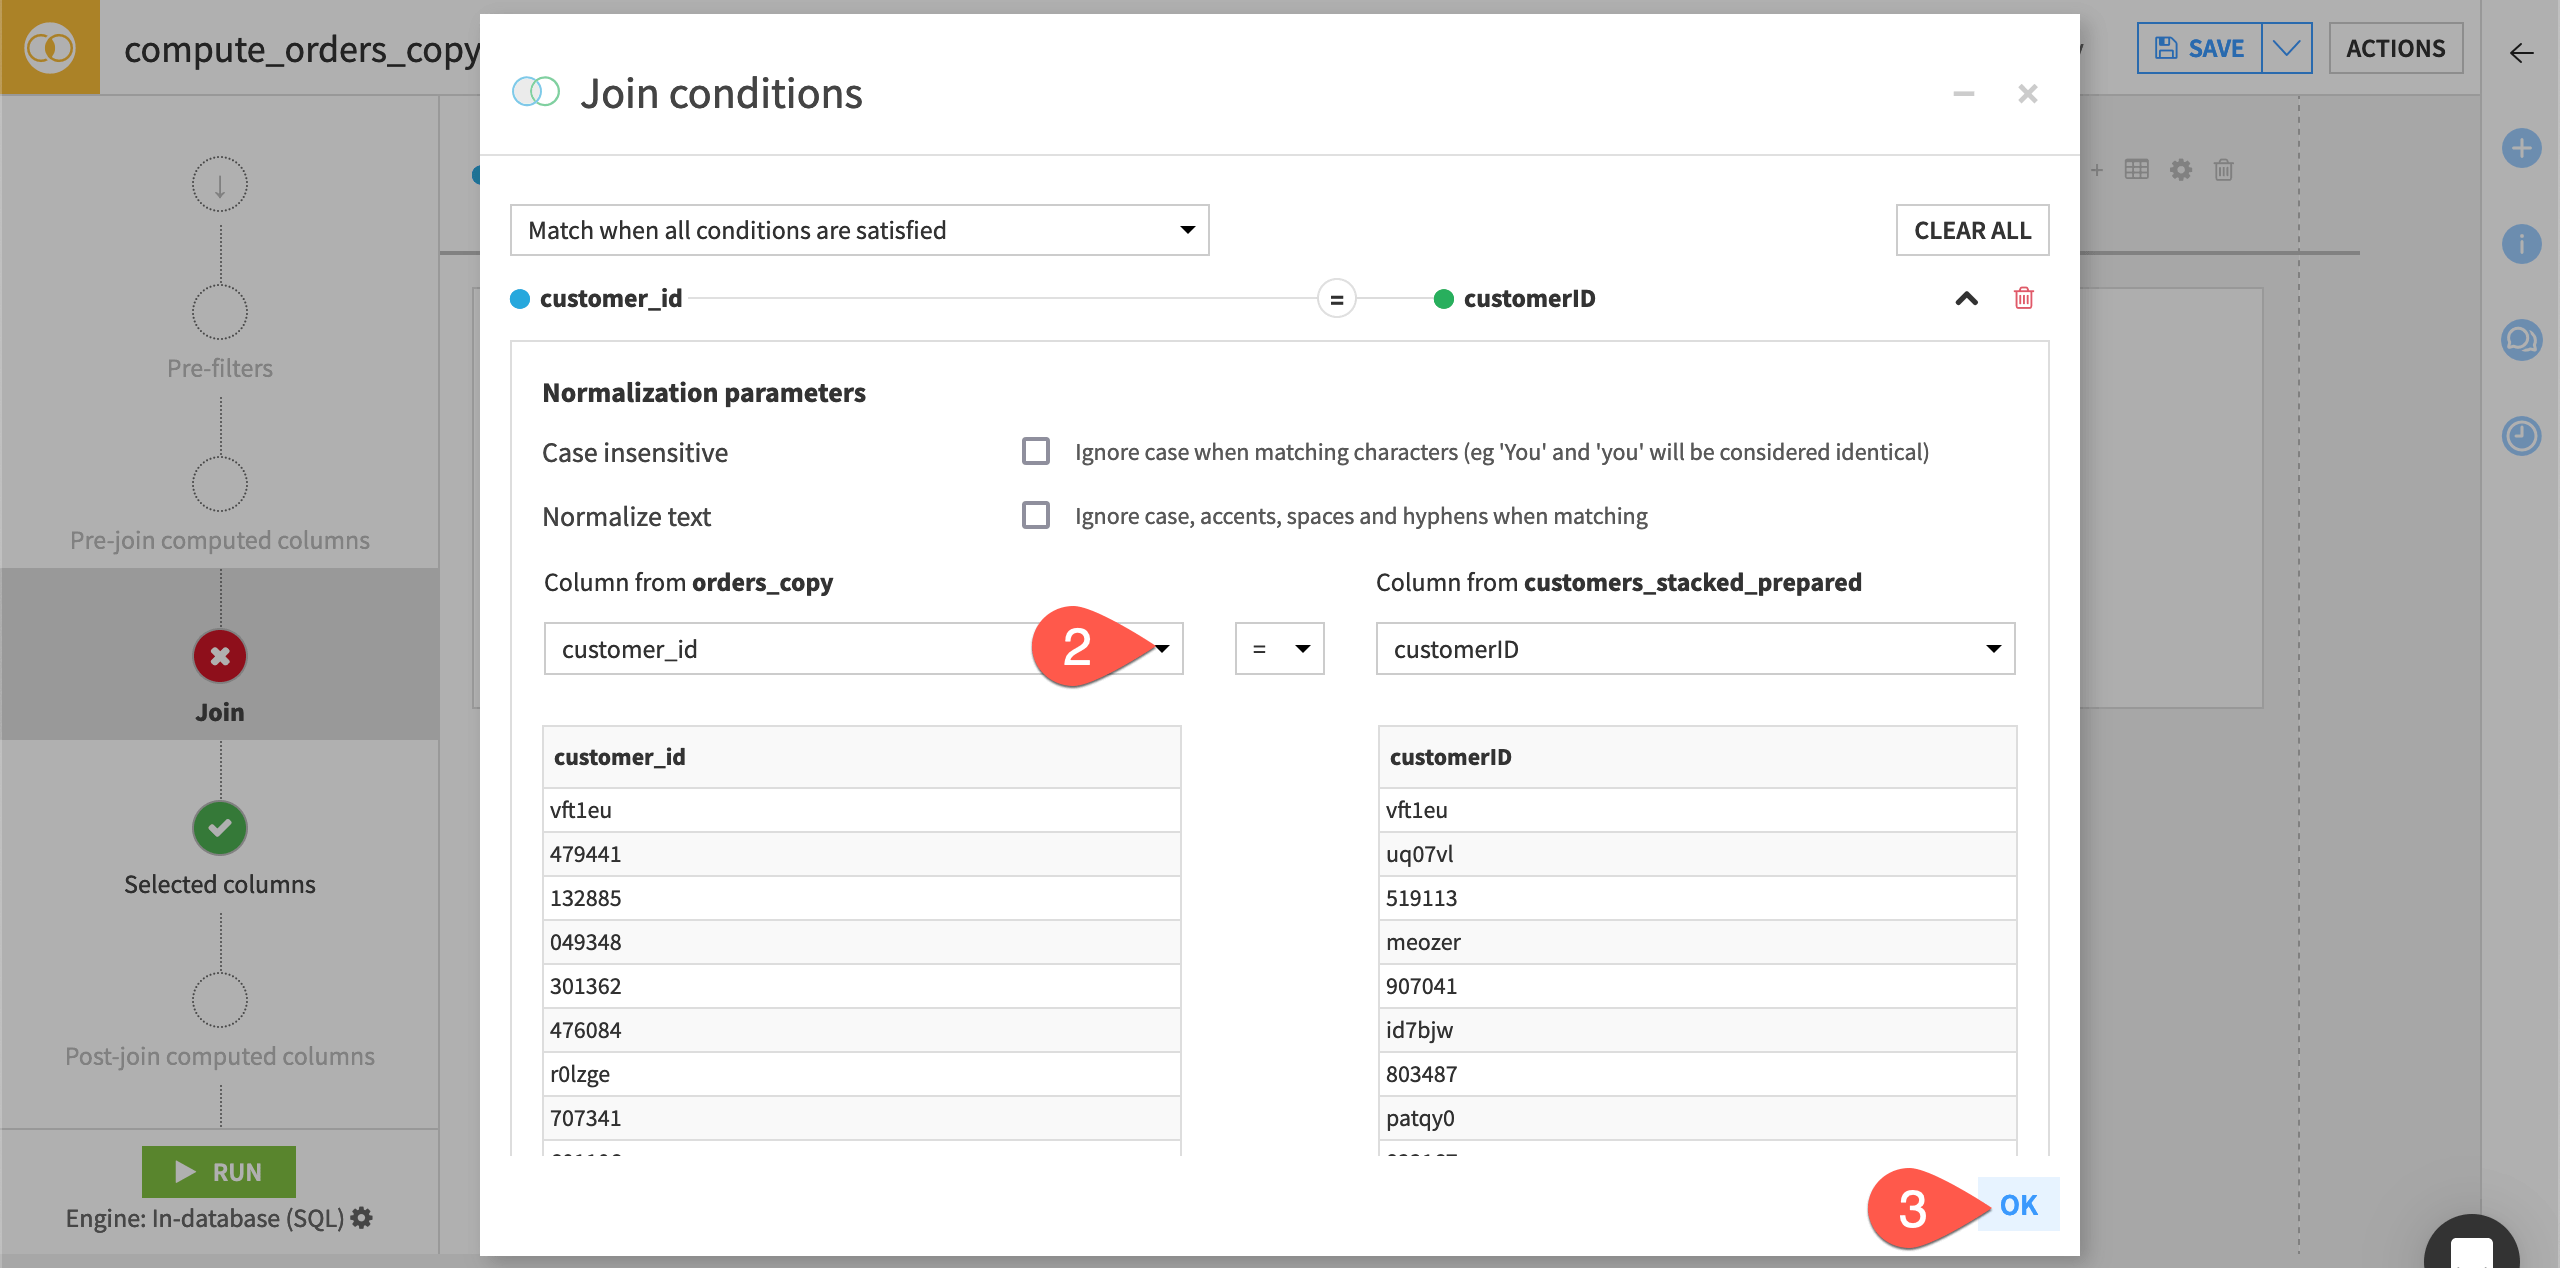
On the Join step, click Add a Condition.
On the left side of the dialog, select customer_id as the join column from orders_copy.
Click OK to close the dialog.
View the SQL query for a Join recipe#
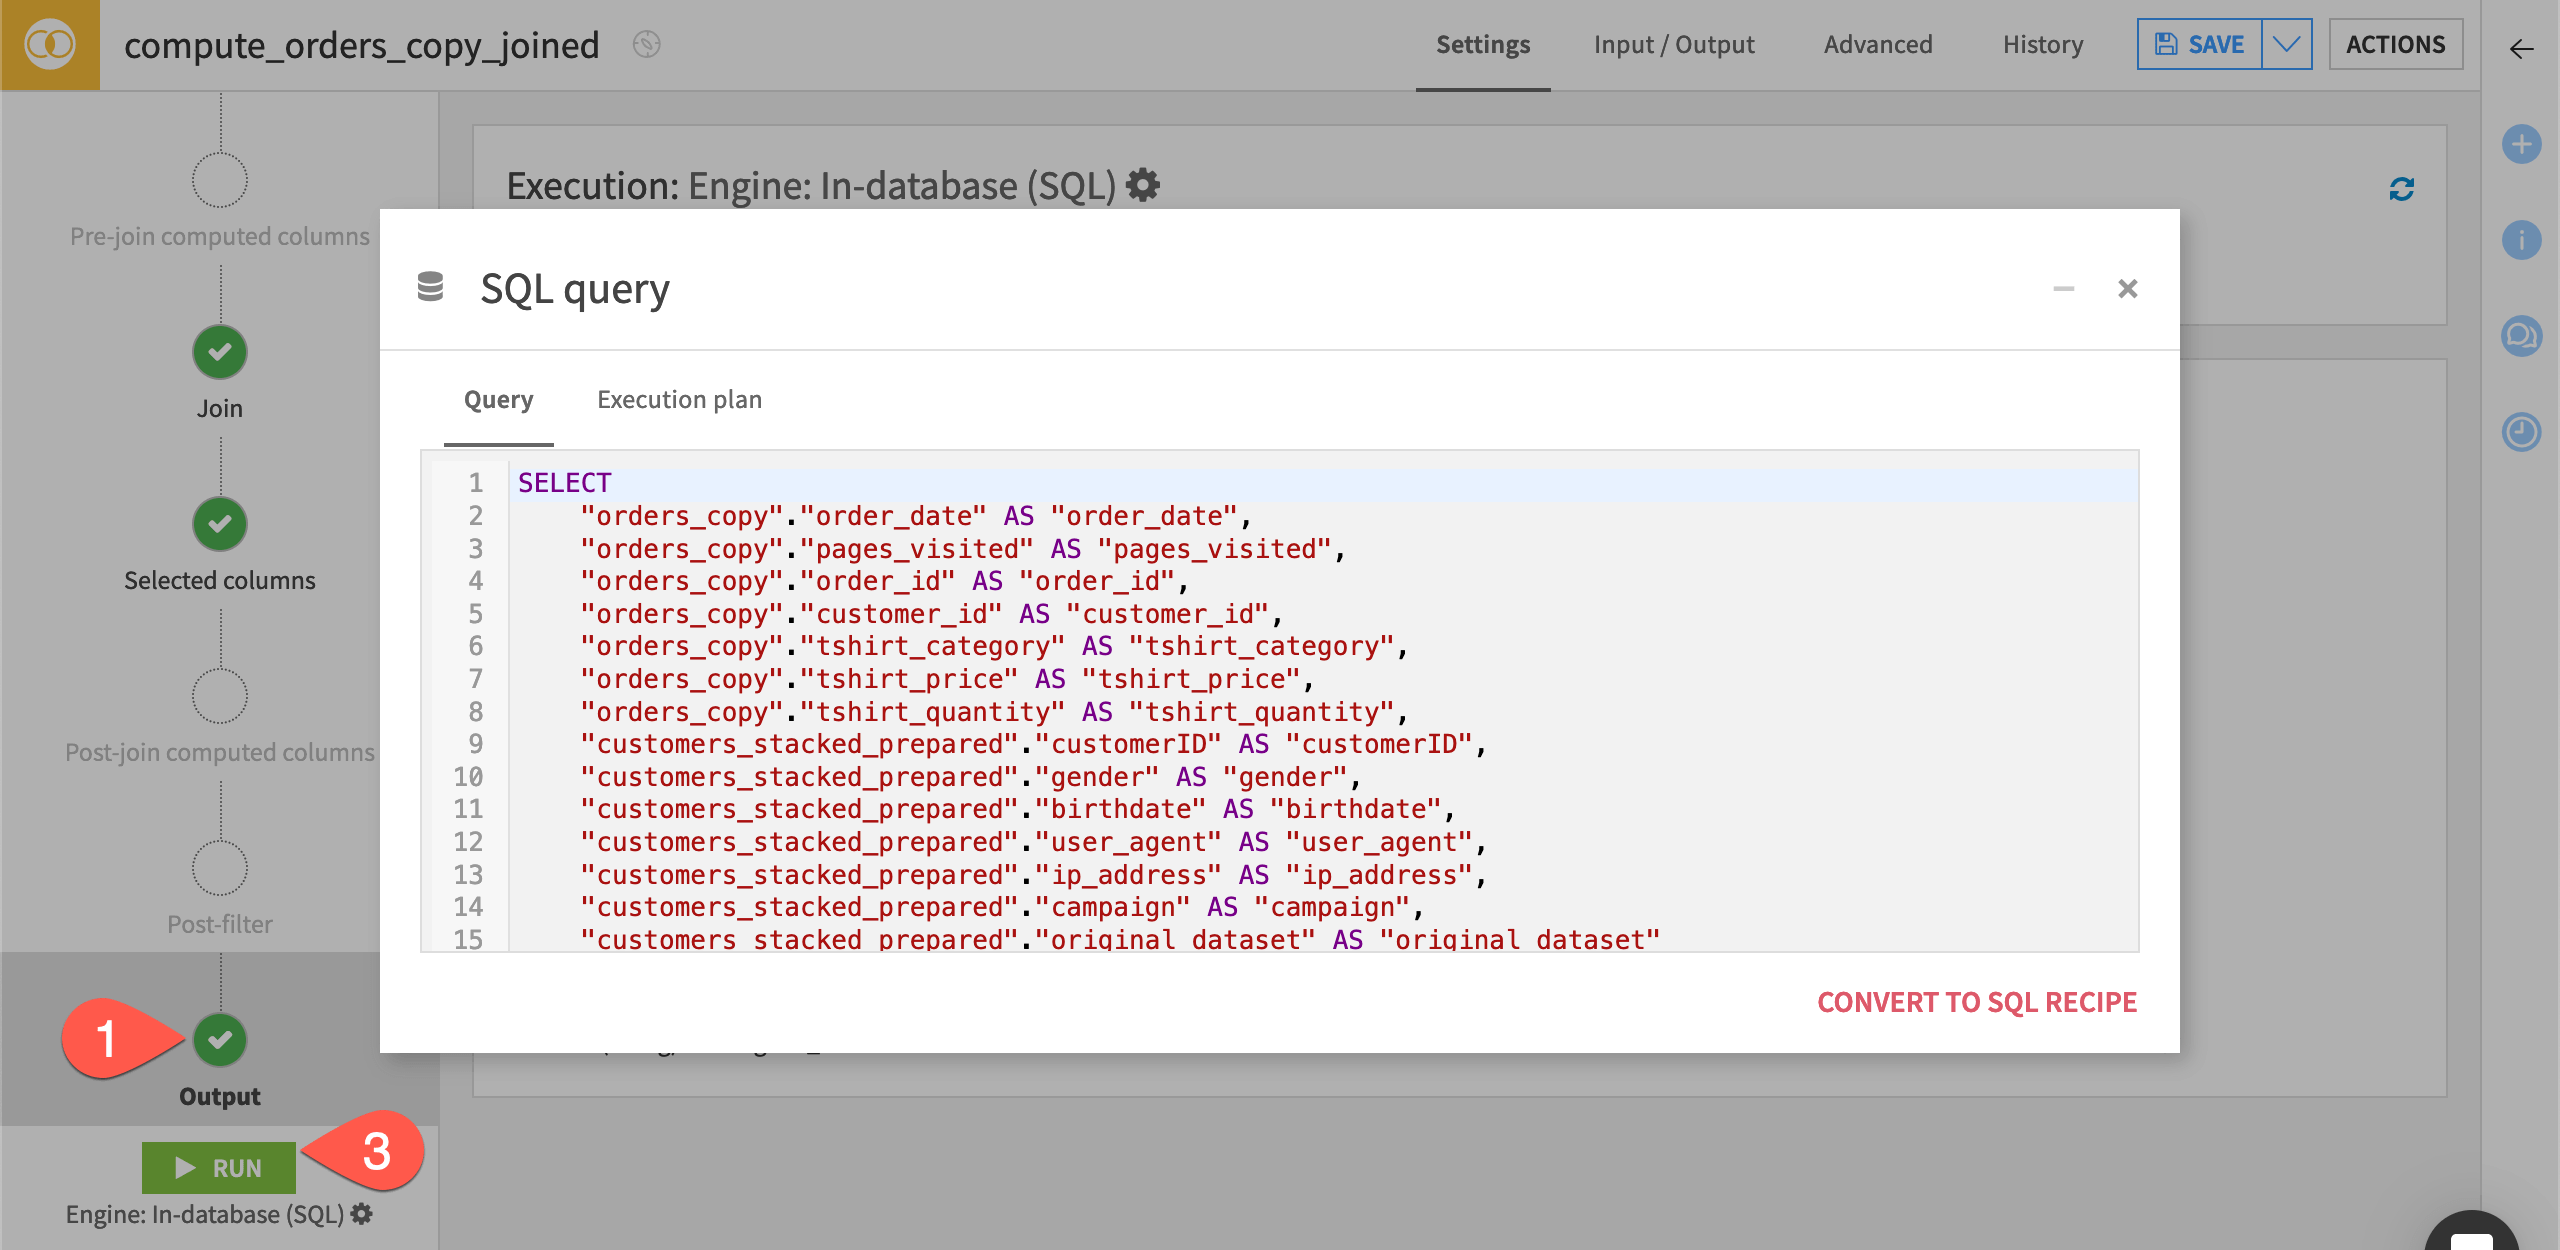
Before running it, review the actual SQL query that the Join recipe will execute.
Navigate to the Output step on the left.
Click View Query to see the actual SQL query that the Join recipe will run, and then close the dialog.
Click Run at the bottom left, noting how Dataiku has selected the in-database SQL engine by default.
Important
The Join recipe includes the option of computing additional columns pre- or post-join. In this case though, because the recipe meets the conditions for the SQL engine, you could also create such columns using SQL in addition to DSS formulas.
See also
To understand how Dataiku selects the execution engine for a visual recipe, see Tutorial | Recipe engines.
Next steps#
Congratulations! You executed routine tasks like building charts and running visual recipes, but did so with a more efficient in-database engine.
Using the in-database engine with visual recipes is convenient for the most common data transformations. However, when you need a more custom approach, you can turn to SQL notebooks and SQL recipes.
Try that in Tutorial | SQL notebooks and recipes!
Tip
You can find this content (and more) by registering for the Dataiku Academy course, Dataiku & SQL. When ready, challenge yourself to earn a certification!

