Concept | Sampling on datasets#
Watch the video

Sampling benefits#
Once you’ve created and/or imported a dataset into Dataiku, you’ll want to explore its contents.
Exploring large datasets can be difficult, as even simple operations can be expensive in computational resources and time. Dataiku addresses this problem by only displaying a sample when exploring and preparing data.
Note
The same sampling principle applies to visualization in charts, data preparation in a Prepare recipe, and statistical analyses.
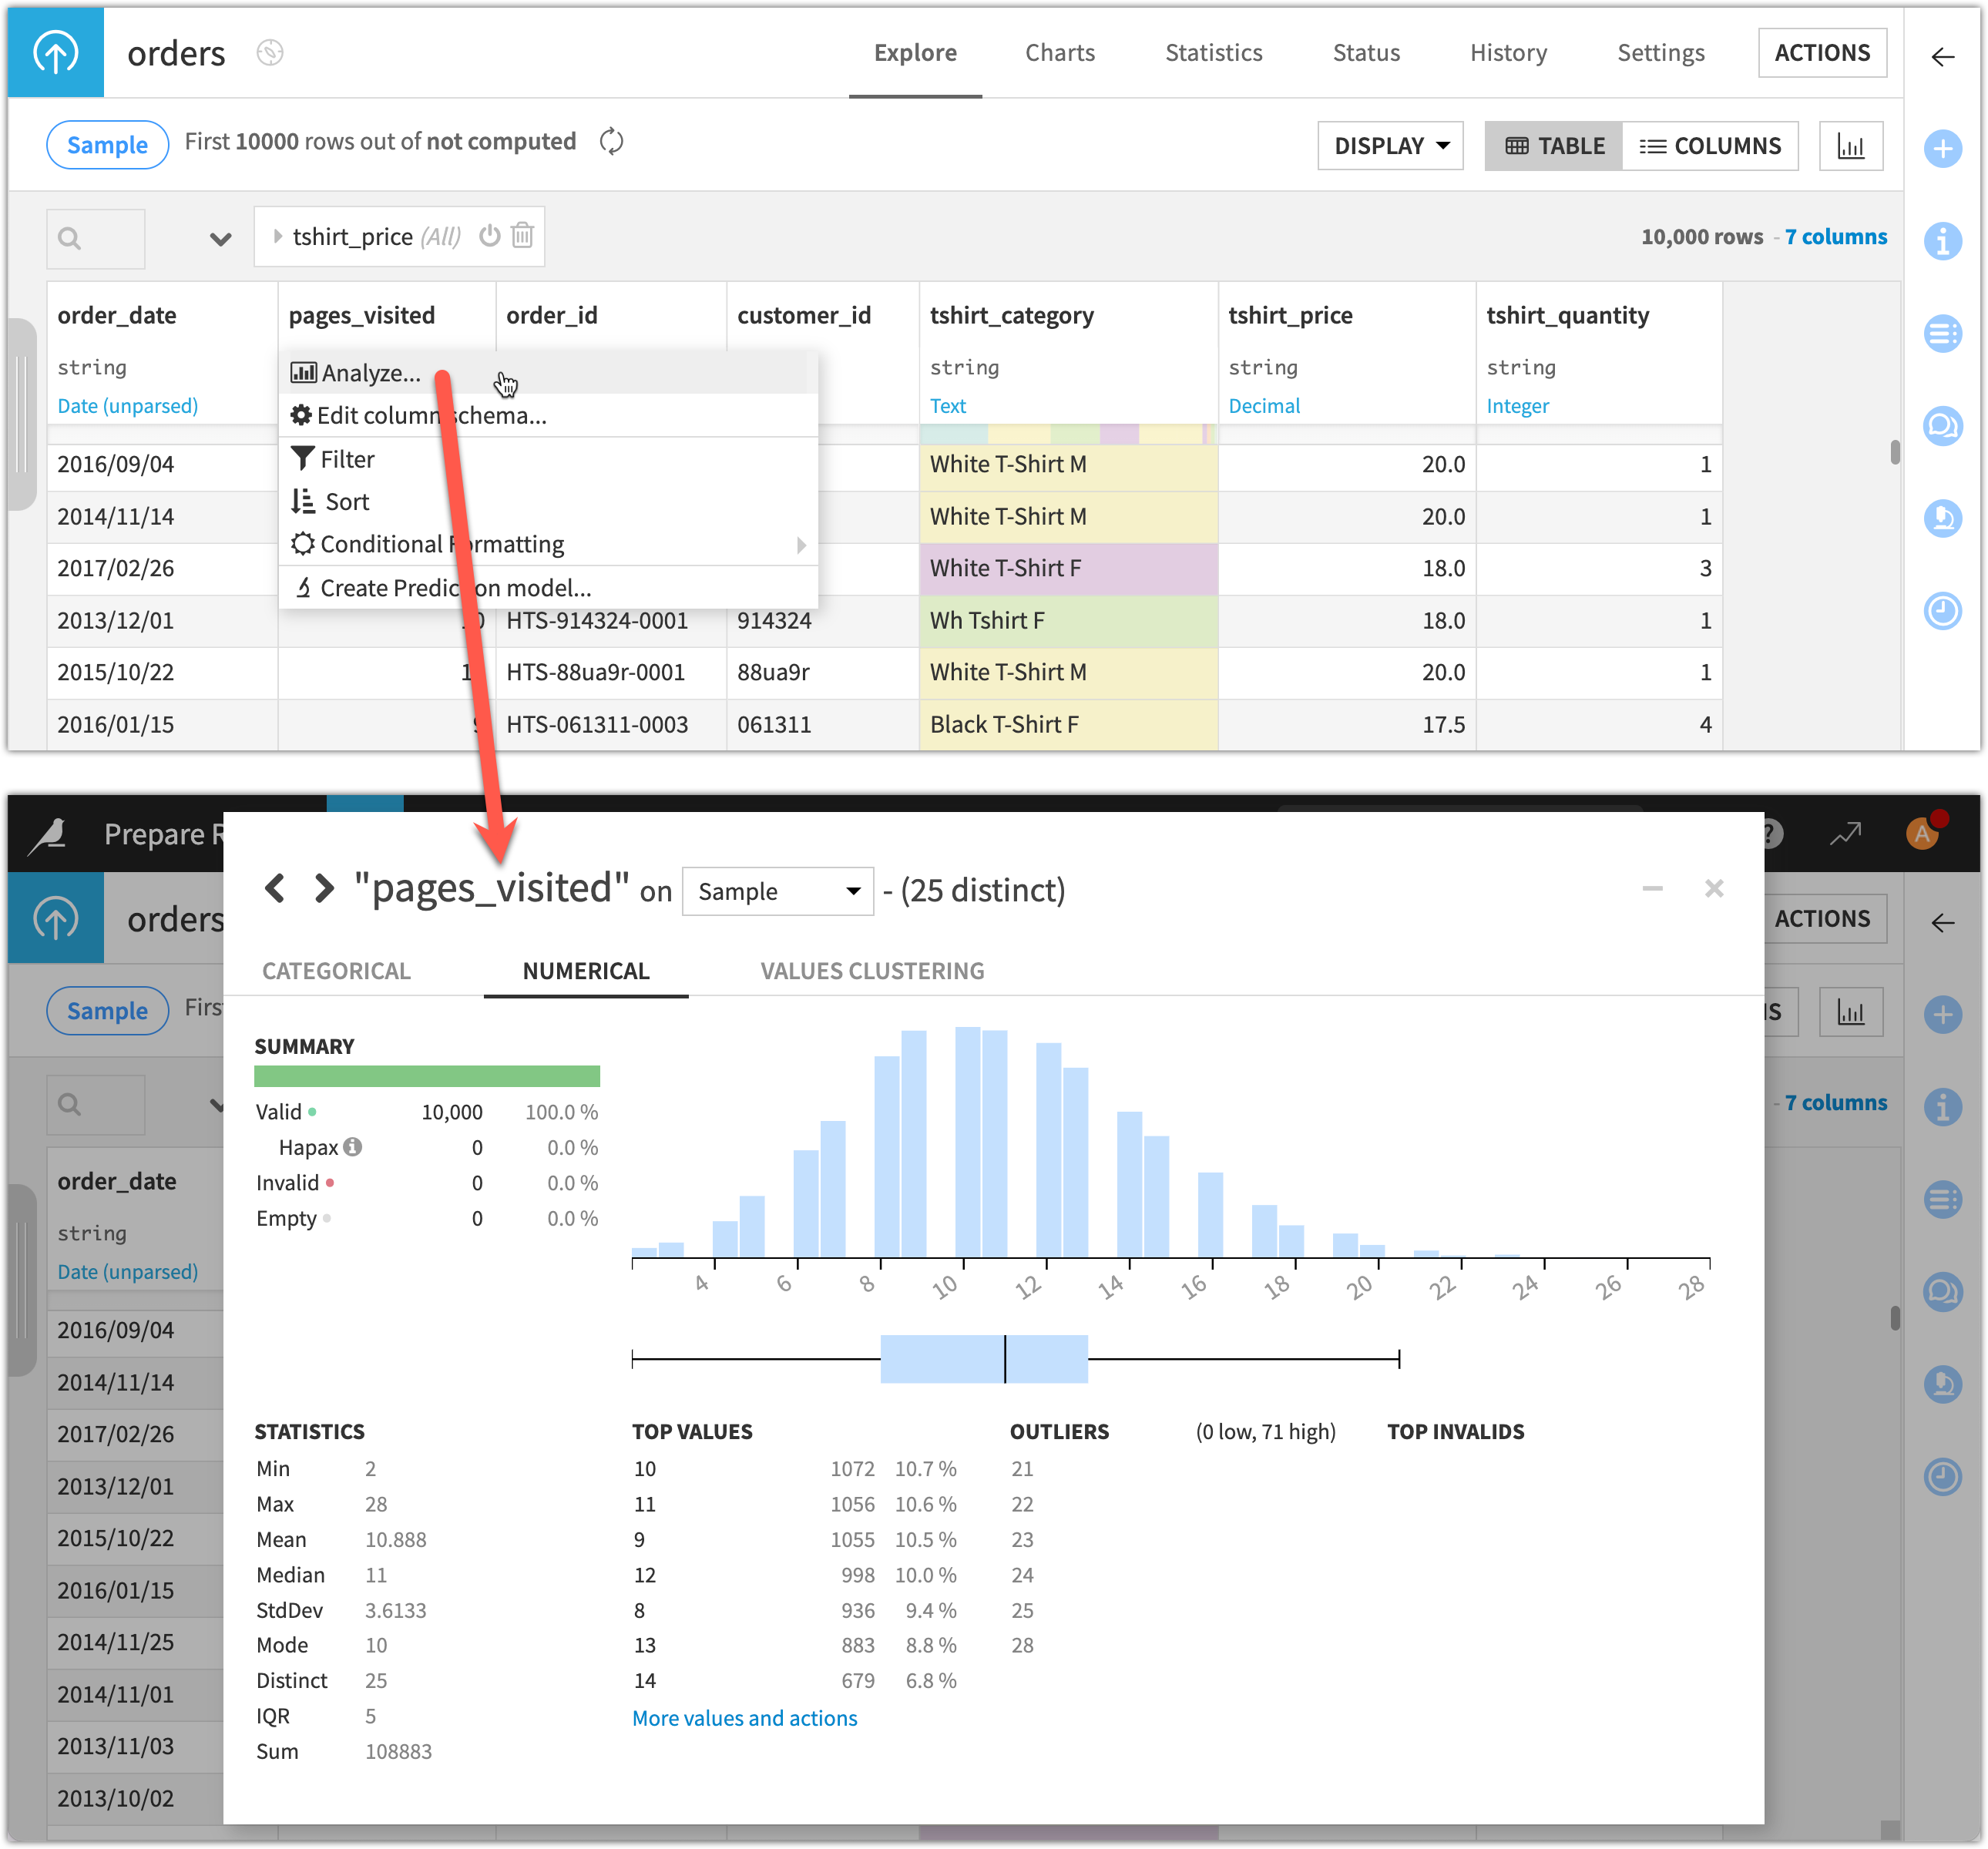
The main purpose of sampling is to provide immediate visual feedback while exploring and preparing the dataset, no matter how large it may be. Therefore, because you are only viewing a relatively small sample of the data, you can quickly:
Action |
Interface |
|---|---|
Sort with a column |
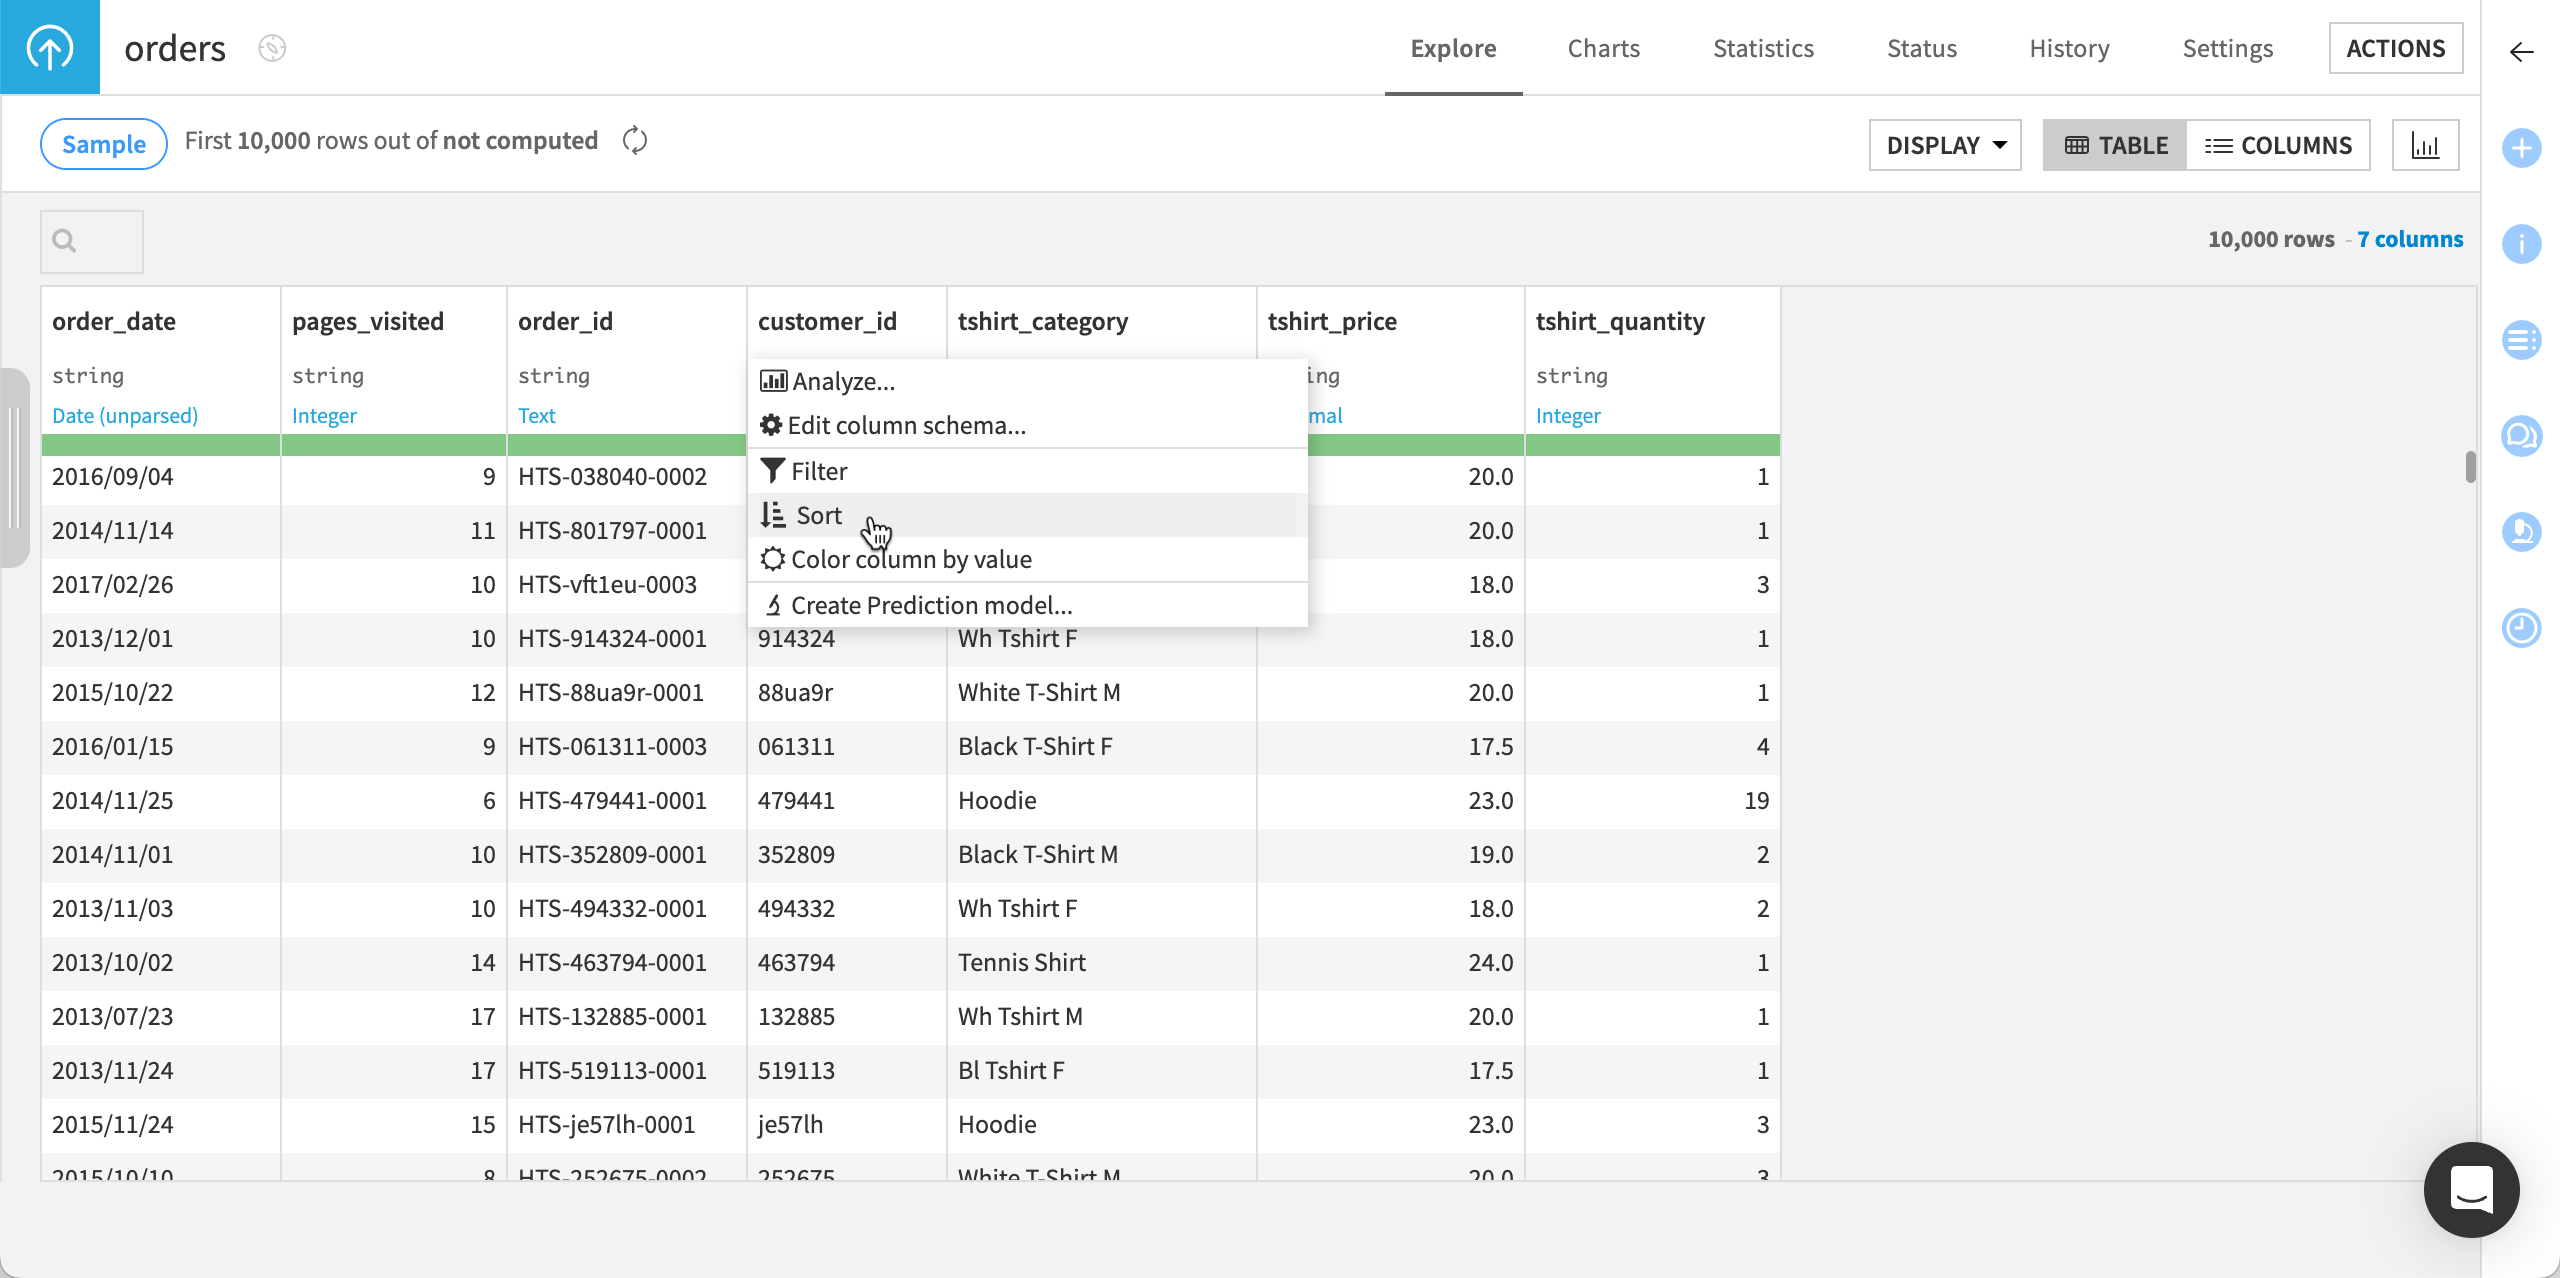
|
Filter the data |
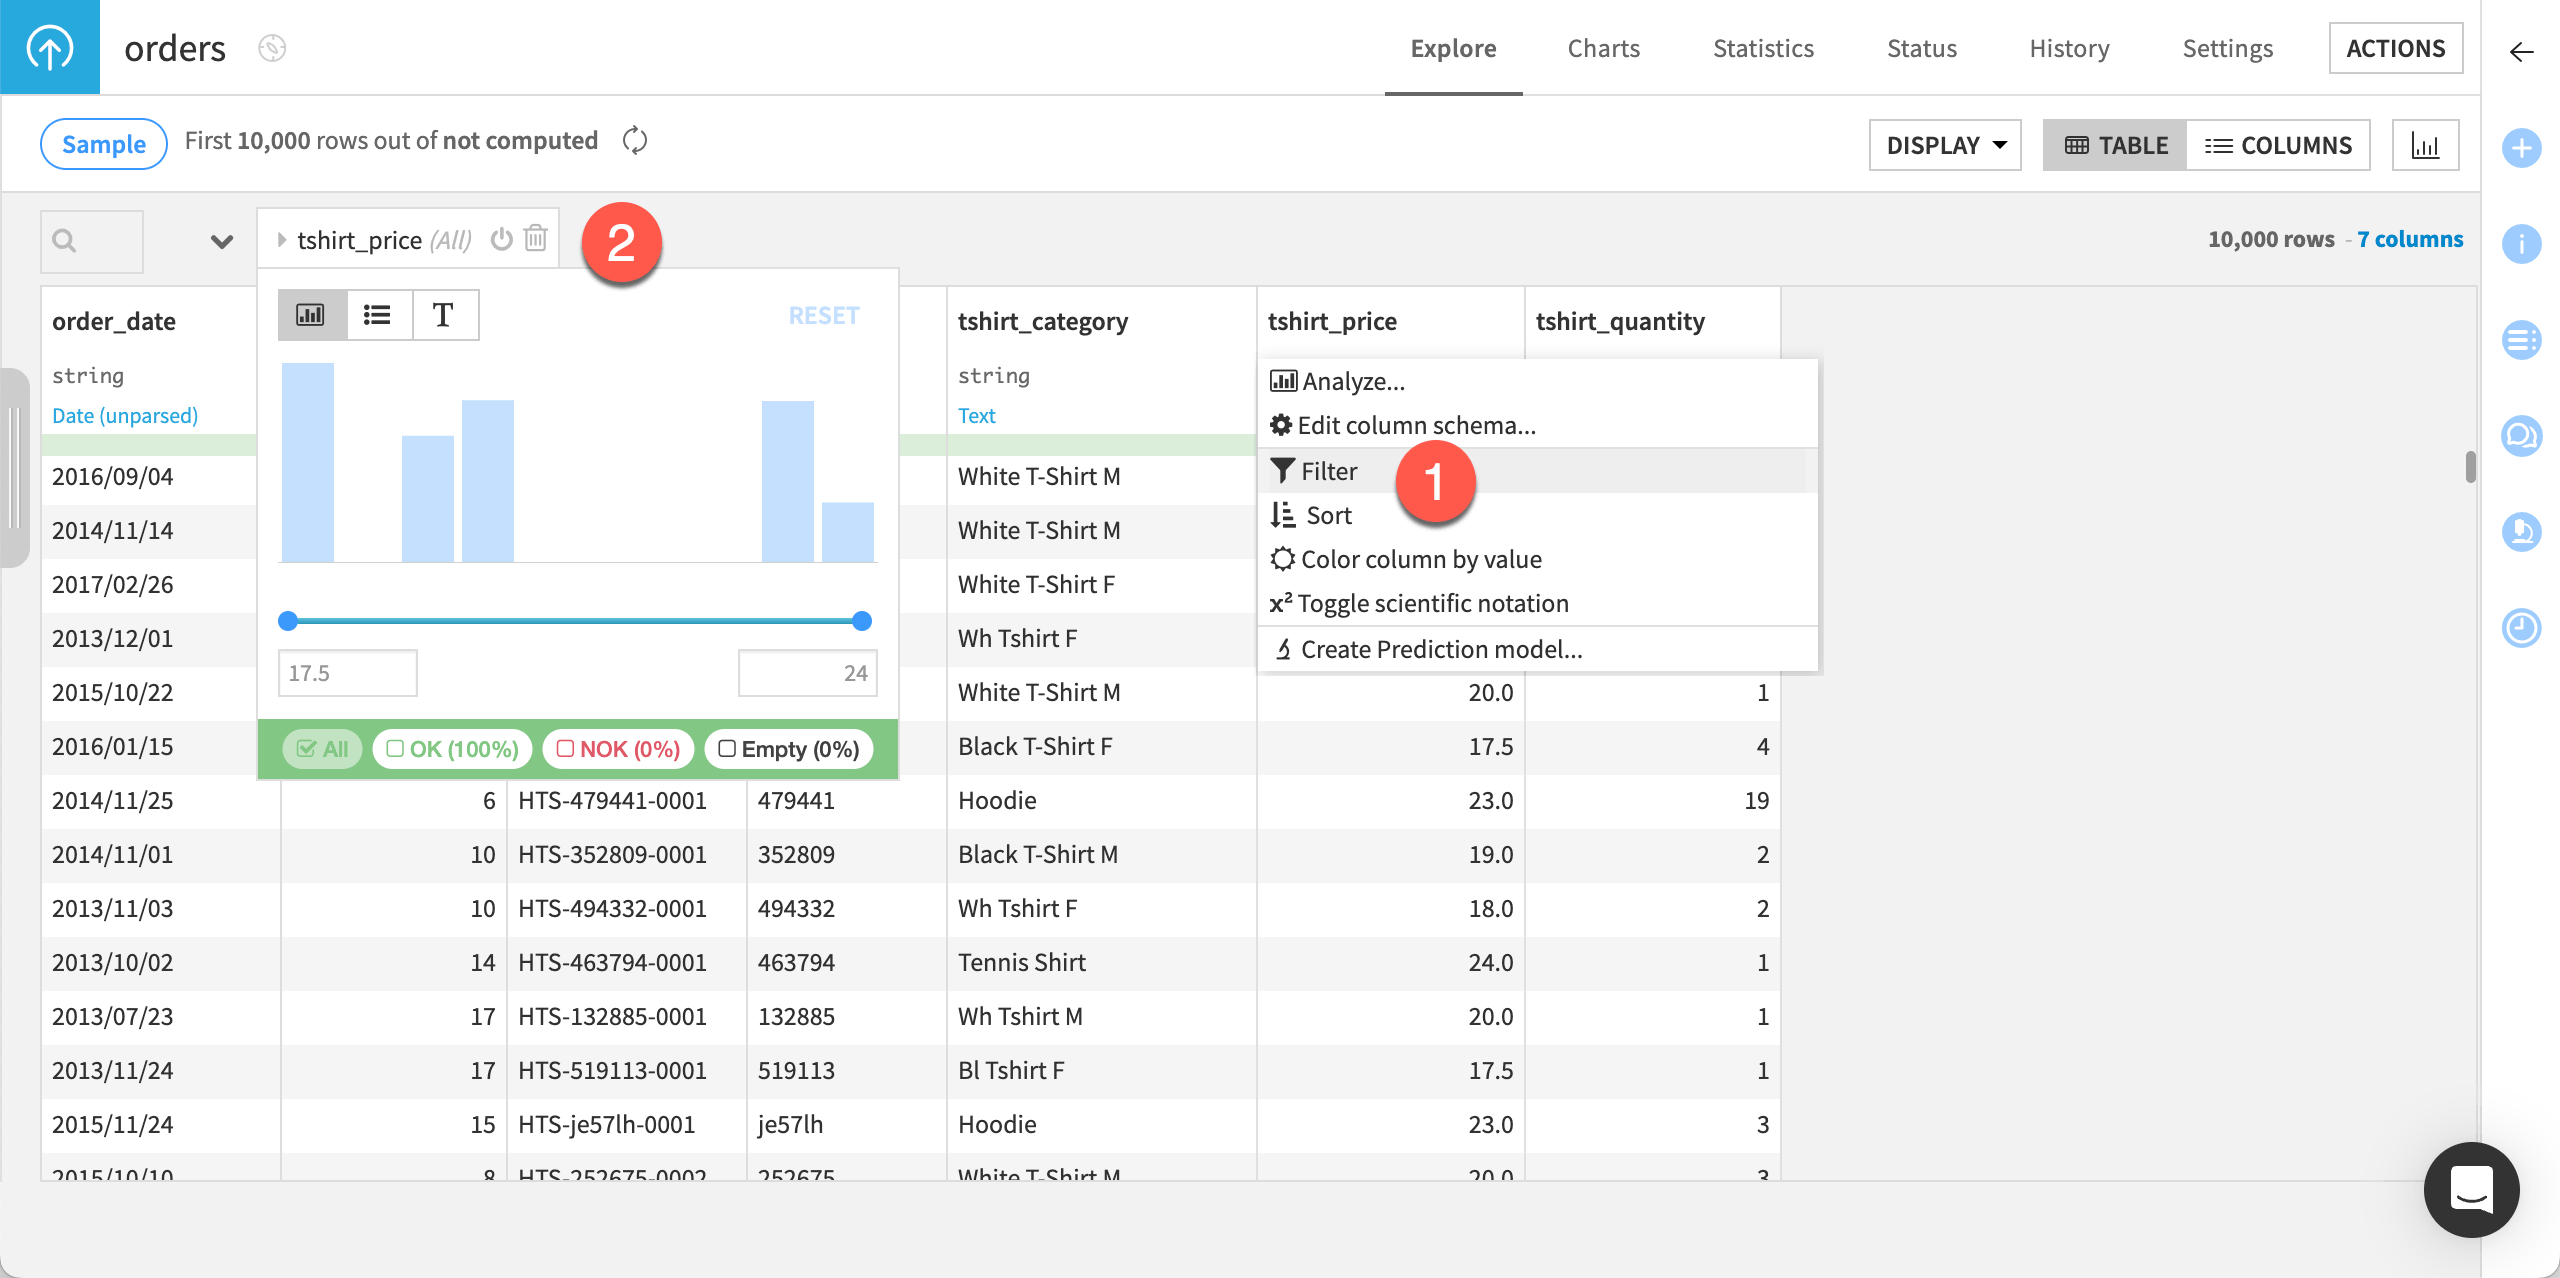
|
Display column distributions |
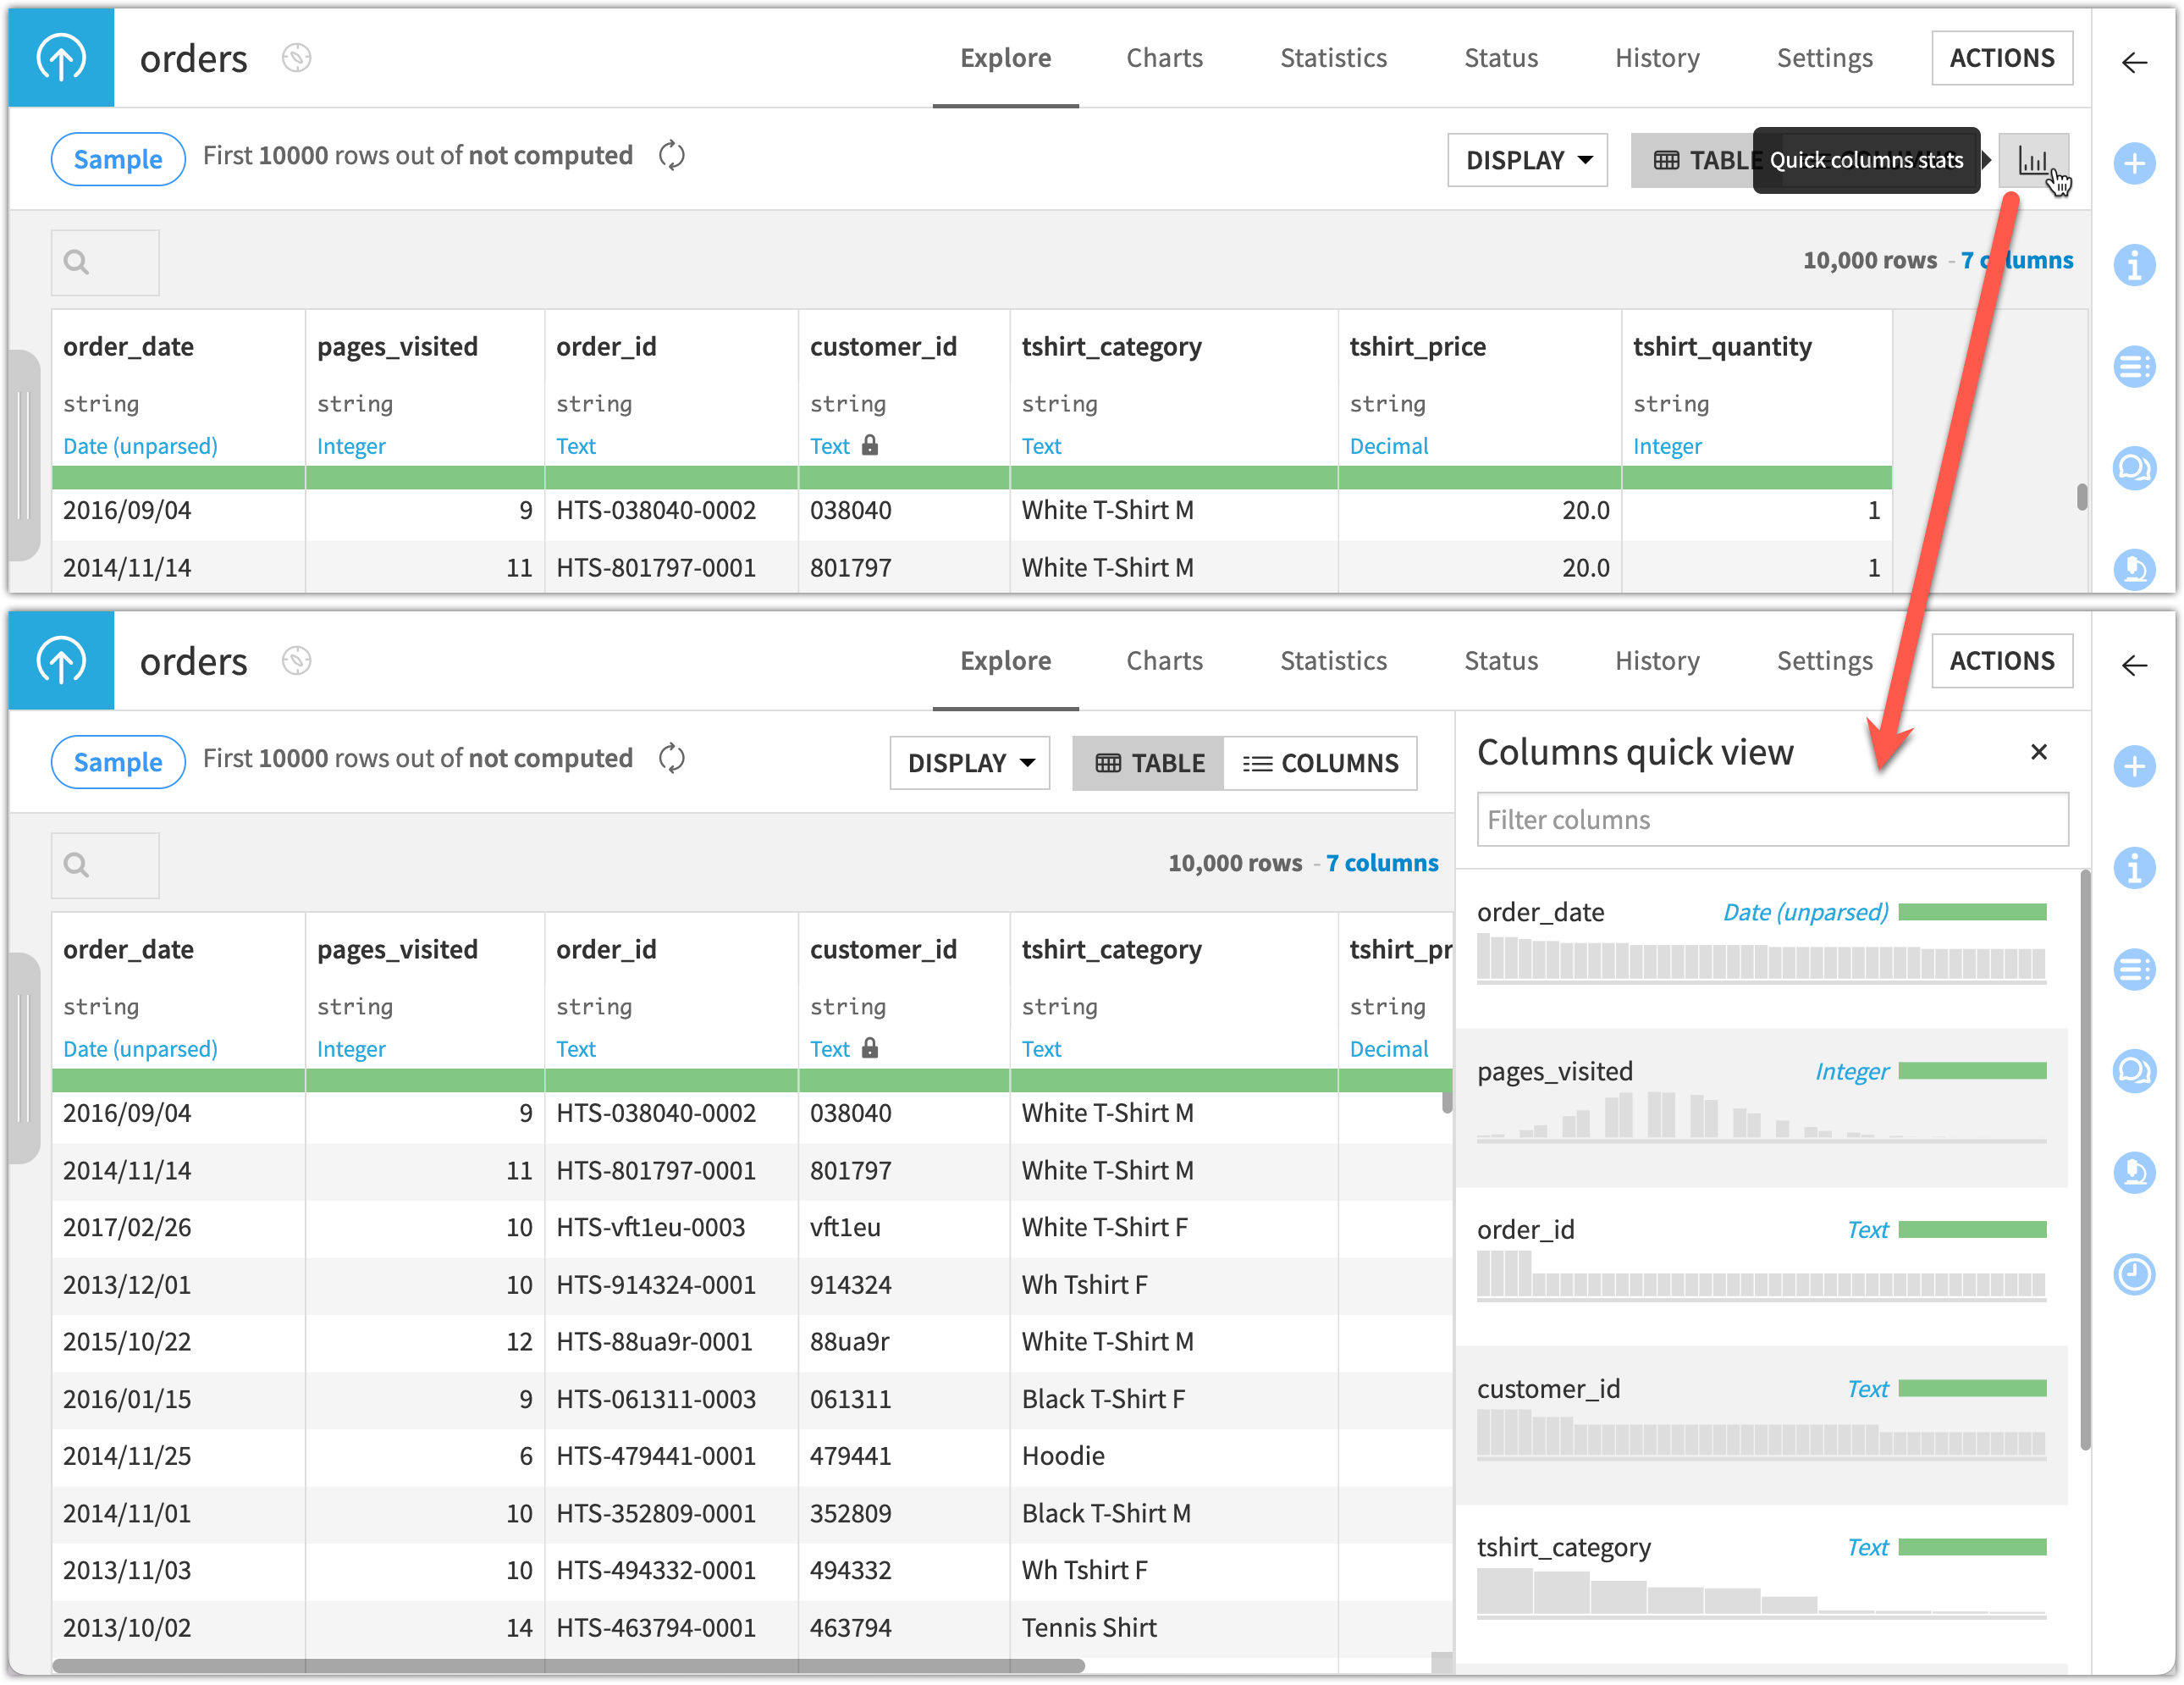
|
Apply conditional formatting |
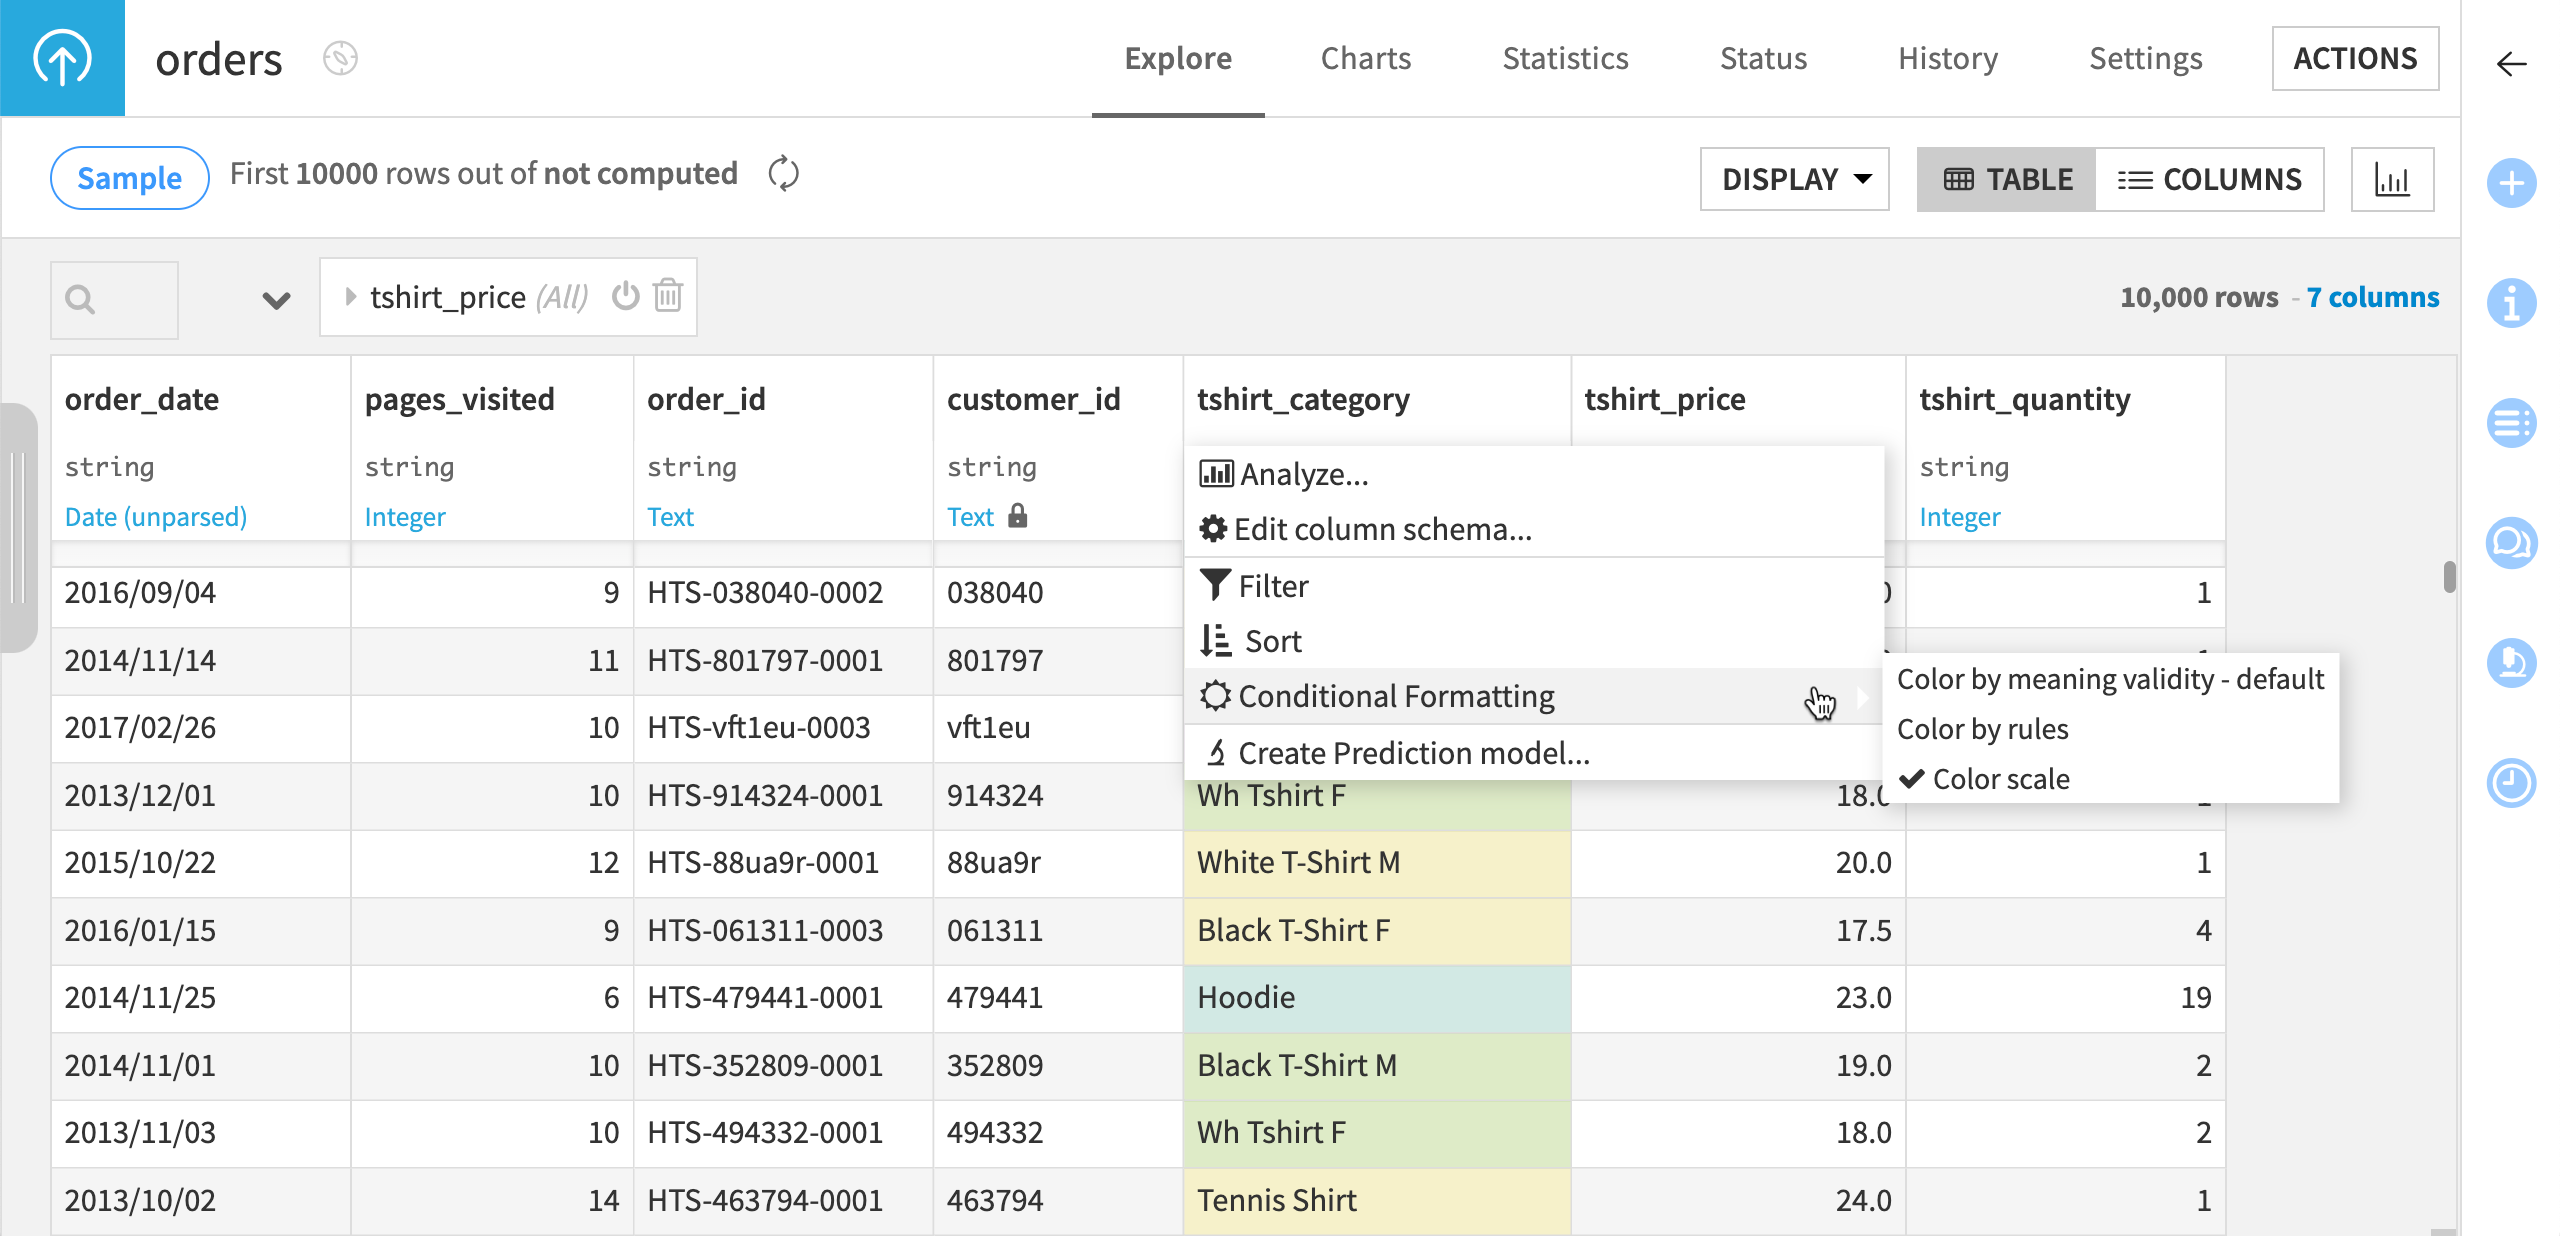
|
View summary statistics |
|
Sampling methods#
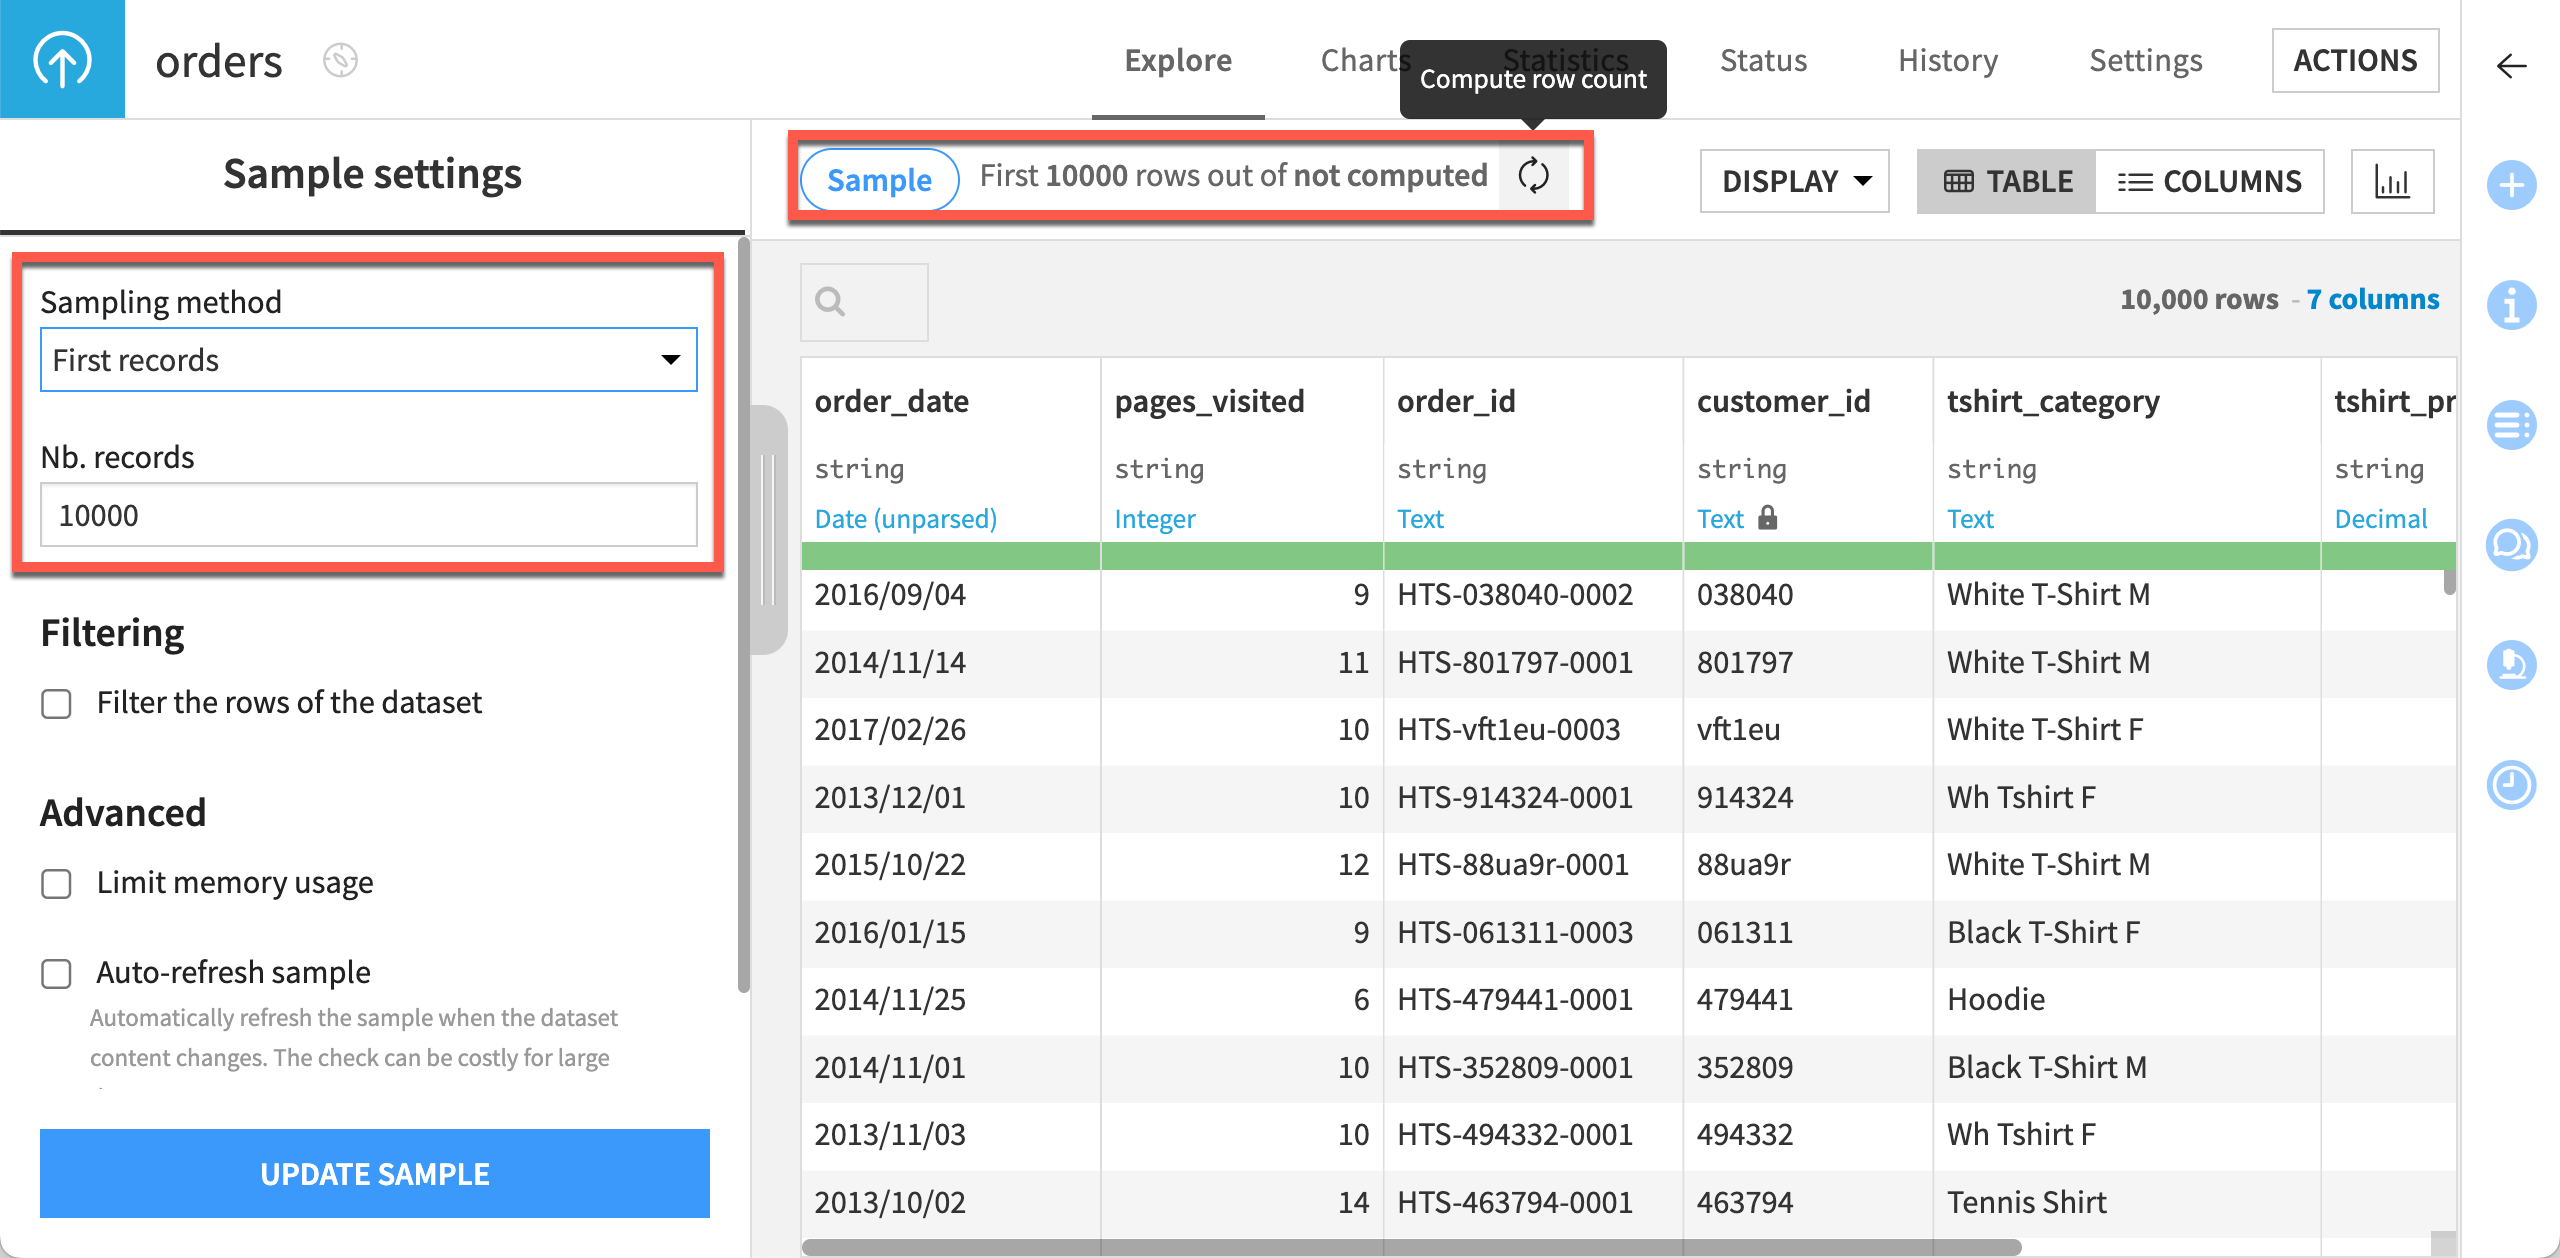
By default, the sample Dataiku uses for any dataset includes the first 10,000 rows. You can see this information at the top of the Explore tab of the dataset. Next to it, Dataiku also indicates the total number of rows in your dataset.
Although taking the first 10,000 rows is the fastest sampling method, the sample may be biased depending on the composition of the dataset.
Depending on your needs, there are a number of different sampling methods available, such as random, stratified, or class rebalancing, to name a few. Clicking on the Sample button on top of the page opens the Sampling settings panel. There, you can select a sampling method and/or increase the number of rows to include in the sample.
Caution
The tradeoff for a potentially more representative sample is the time needed for Dataiku to make a full pass or sometimes two full passes of the data.
Next steps#
In this article, you learned about sampling in Dataiku, and how this allows for immediate visual feedback while exploring data no matter how large the dataset. Continue learning about the basics of Dataiku by exploring the Analyze window.

