
Tutorial | Top N recipe#
Try out the Top N recipe to identify the rows containing the largest or smallest values of a particular metric.
Get started#
Objectives#
In this tutorial, you will:
Extract the top and bottom
Nrows of a dataset according to a sorted metric.Calculate ranks based on this metric.
Compute the same for subsets of the dataset.
Prerequisites#
To complete this tutorial, you’ll need the following:
Dataiku 14.0 or later.
Create the project#
From the Dataiku Design homepage, click + New Project.
Select Learning projects.
Search for and select Top N Recipe.
If needed, change the folder into which the project will be installed, and click Create.
From the project homepage, click Go to Flow (or type
g+f).
Note
You can also download the starter project from this website and import it as a ZIP file.
You’ll next want to build the Flow.
Click Flow Actions at the bottom right of the Flow.
Click Build all.
Keep the default settings and click Build.
Use case summary#
Let’s say we’re a financial company that uses some credit card data to detect fraudulent transactions.
The project comes with three datasets, described in the table below.
Dataset |
Description |
|---|---|
tx |
Each row is a unique credit card transaction with information such as the card that was used and the merchant where the transaction was made. It also indicates whether the transaction has either been:
|
merchants |
Each row is a unique merchant with information such as the merchant’s location and category. |
cards |
Each row is a unique credit card ID with information such as the card’s activation month or the cardholder’s FICO score (a common measure of creditworthiness in the US). |
Create the Top N recipe#
You have a prepared dataset of transactions, but the next phase of analysis calls for a leaderboard. You’ll need to find the largest transactions.
Start by creating a Top N recipe from the tx_prepared dataset.
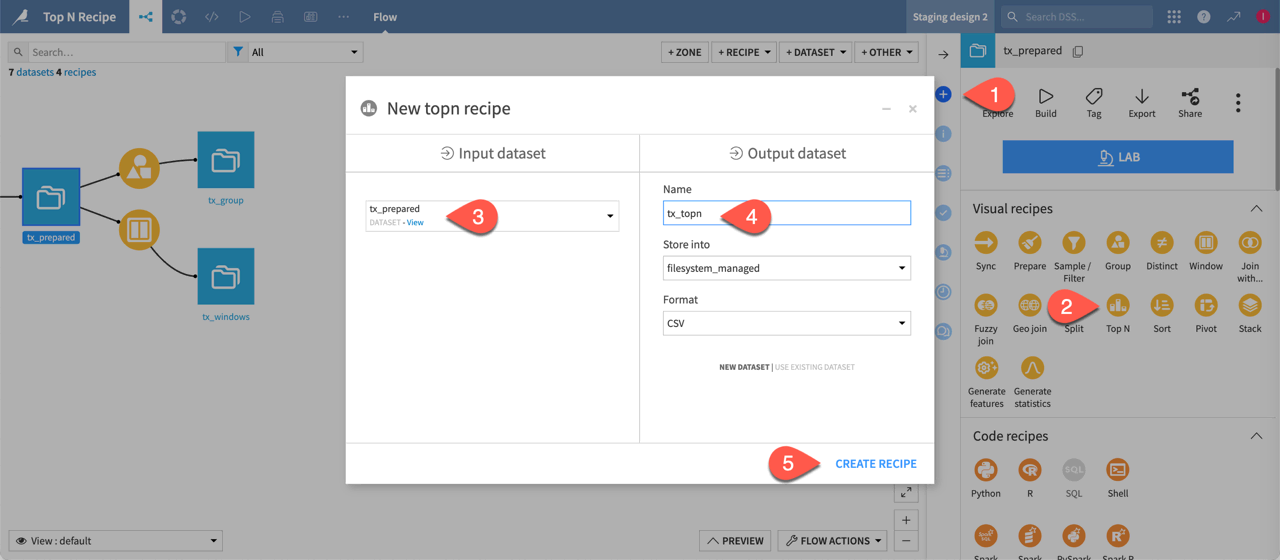
From the Flow, select the tx_prepared dataset.
In the Actions tab of the right panel, select the Top N recipe from the visual recipes section.
Name the output dataset
tx_topn.Click Create Recipe.
Retrieve the top N rows#
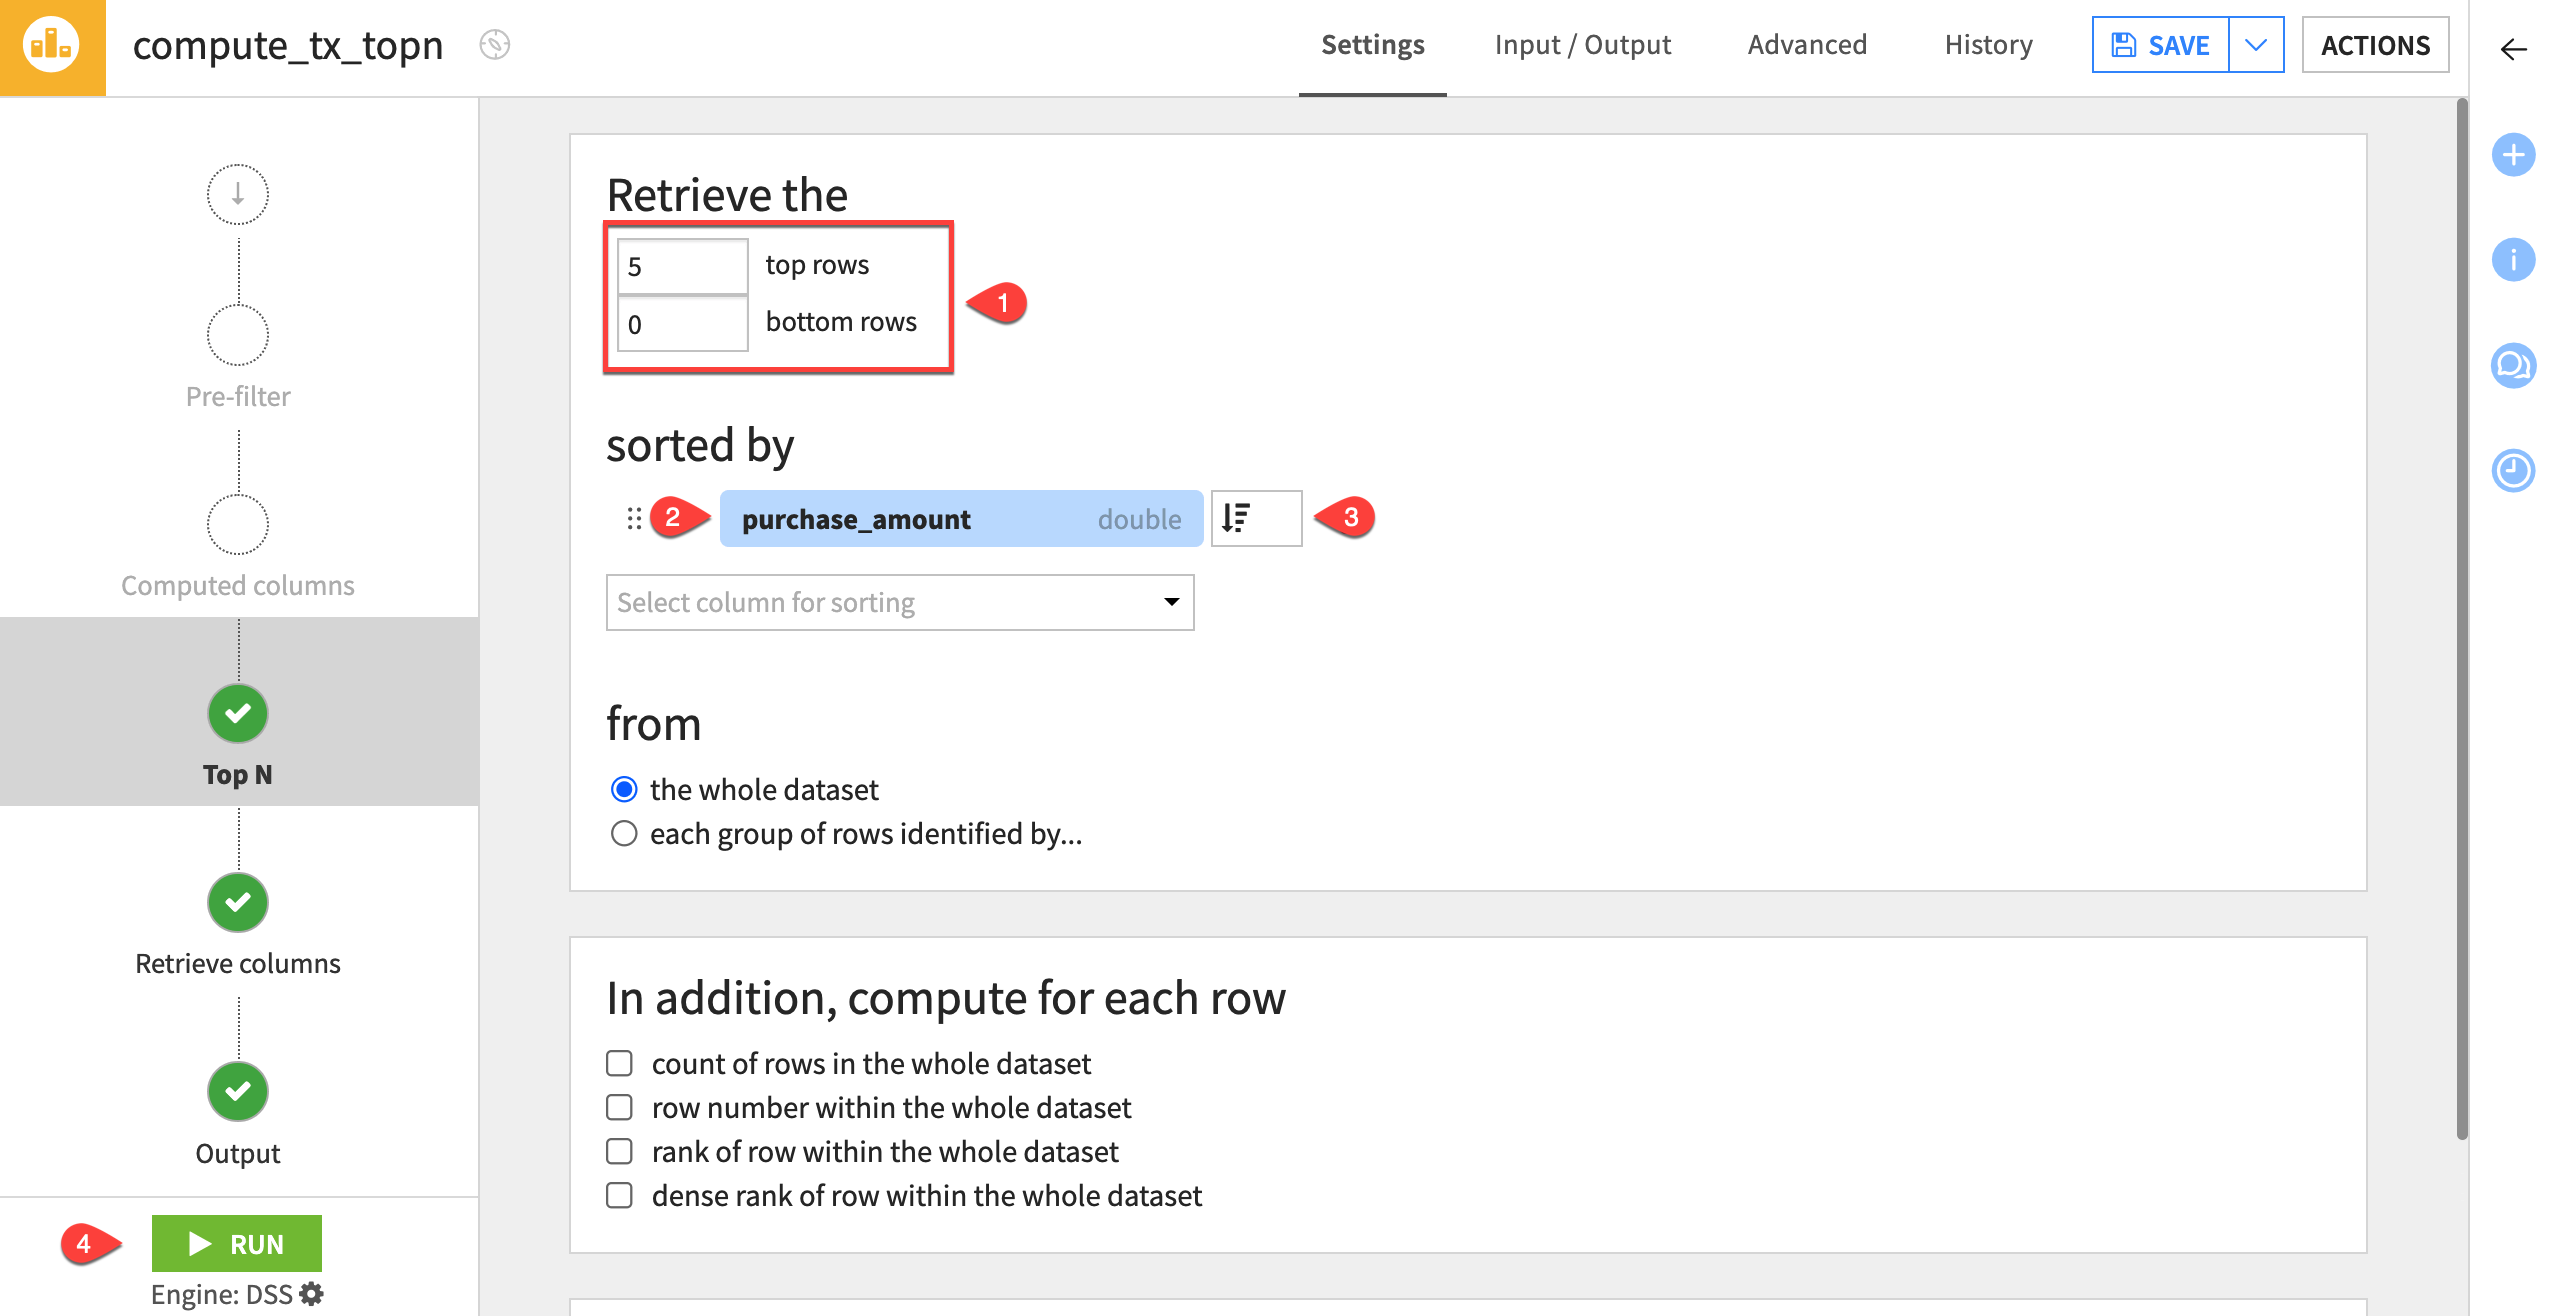
Filter the whole dataset for the rows representing the five largest purchases.
Retrieve the
5top rows and0bottom rows.Select the purchase_amount column for sorting.
Change the sort order to descending (
 ) so the most expensive orders appear at the top of the dataset.
Click Run to execute the recipe, and open the output dataset.
Verify the output has only five records in descending order in terms of purchase_amount.
Rank and filter by groups#
The Top N recipe also supports grouping. This can be convenient instead of turning to other possible tools like the Group, Window, and Sort/Filter recipes.
Modify the previous example to find the five largest purchases per item category.
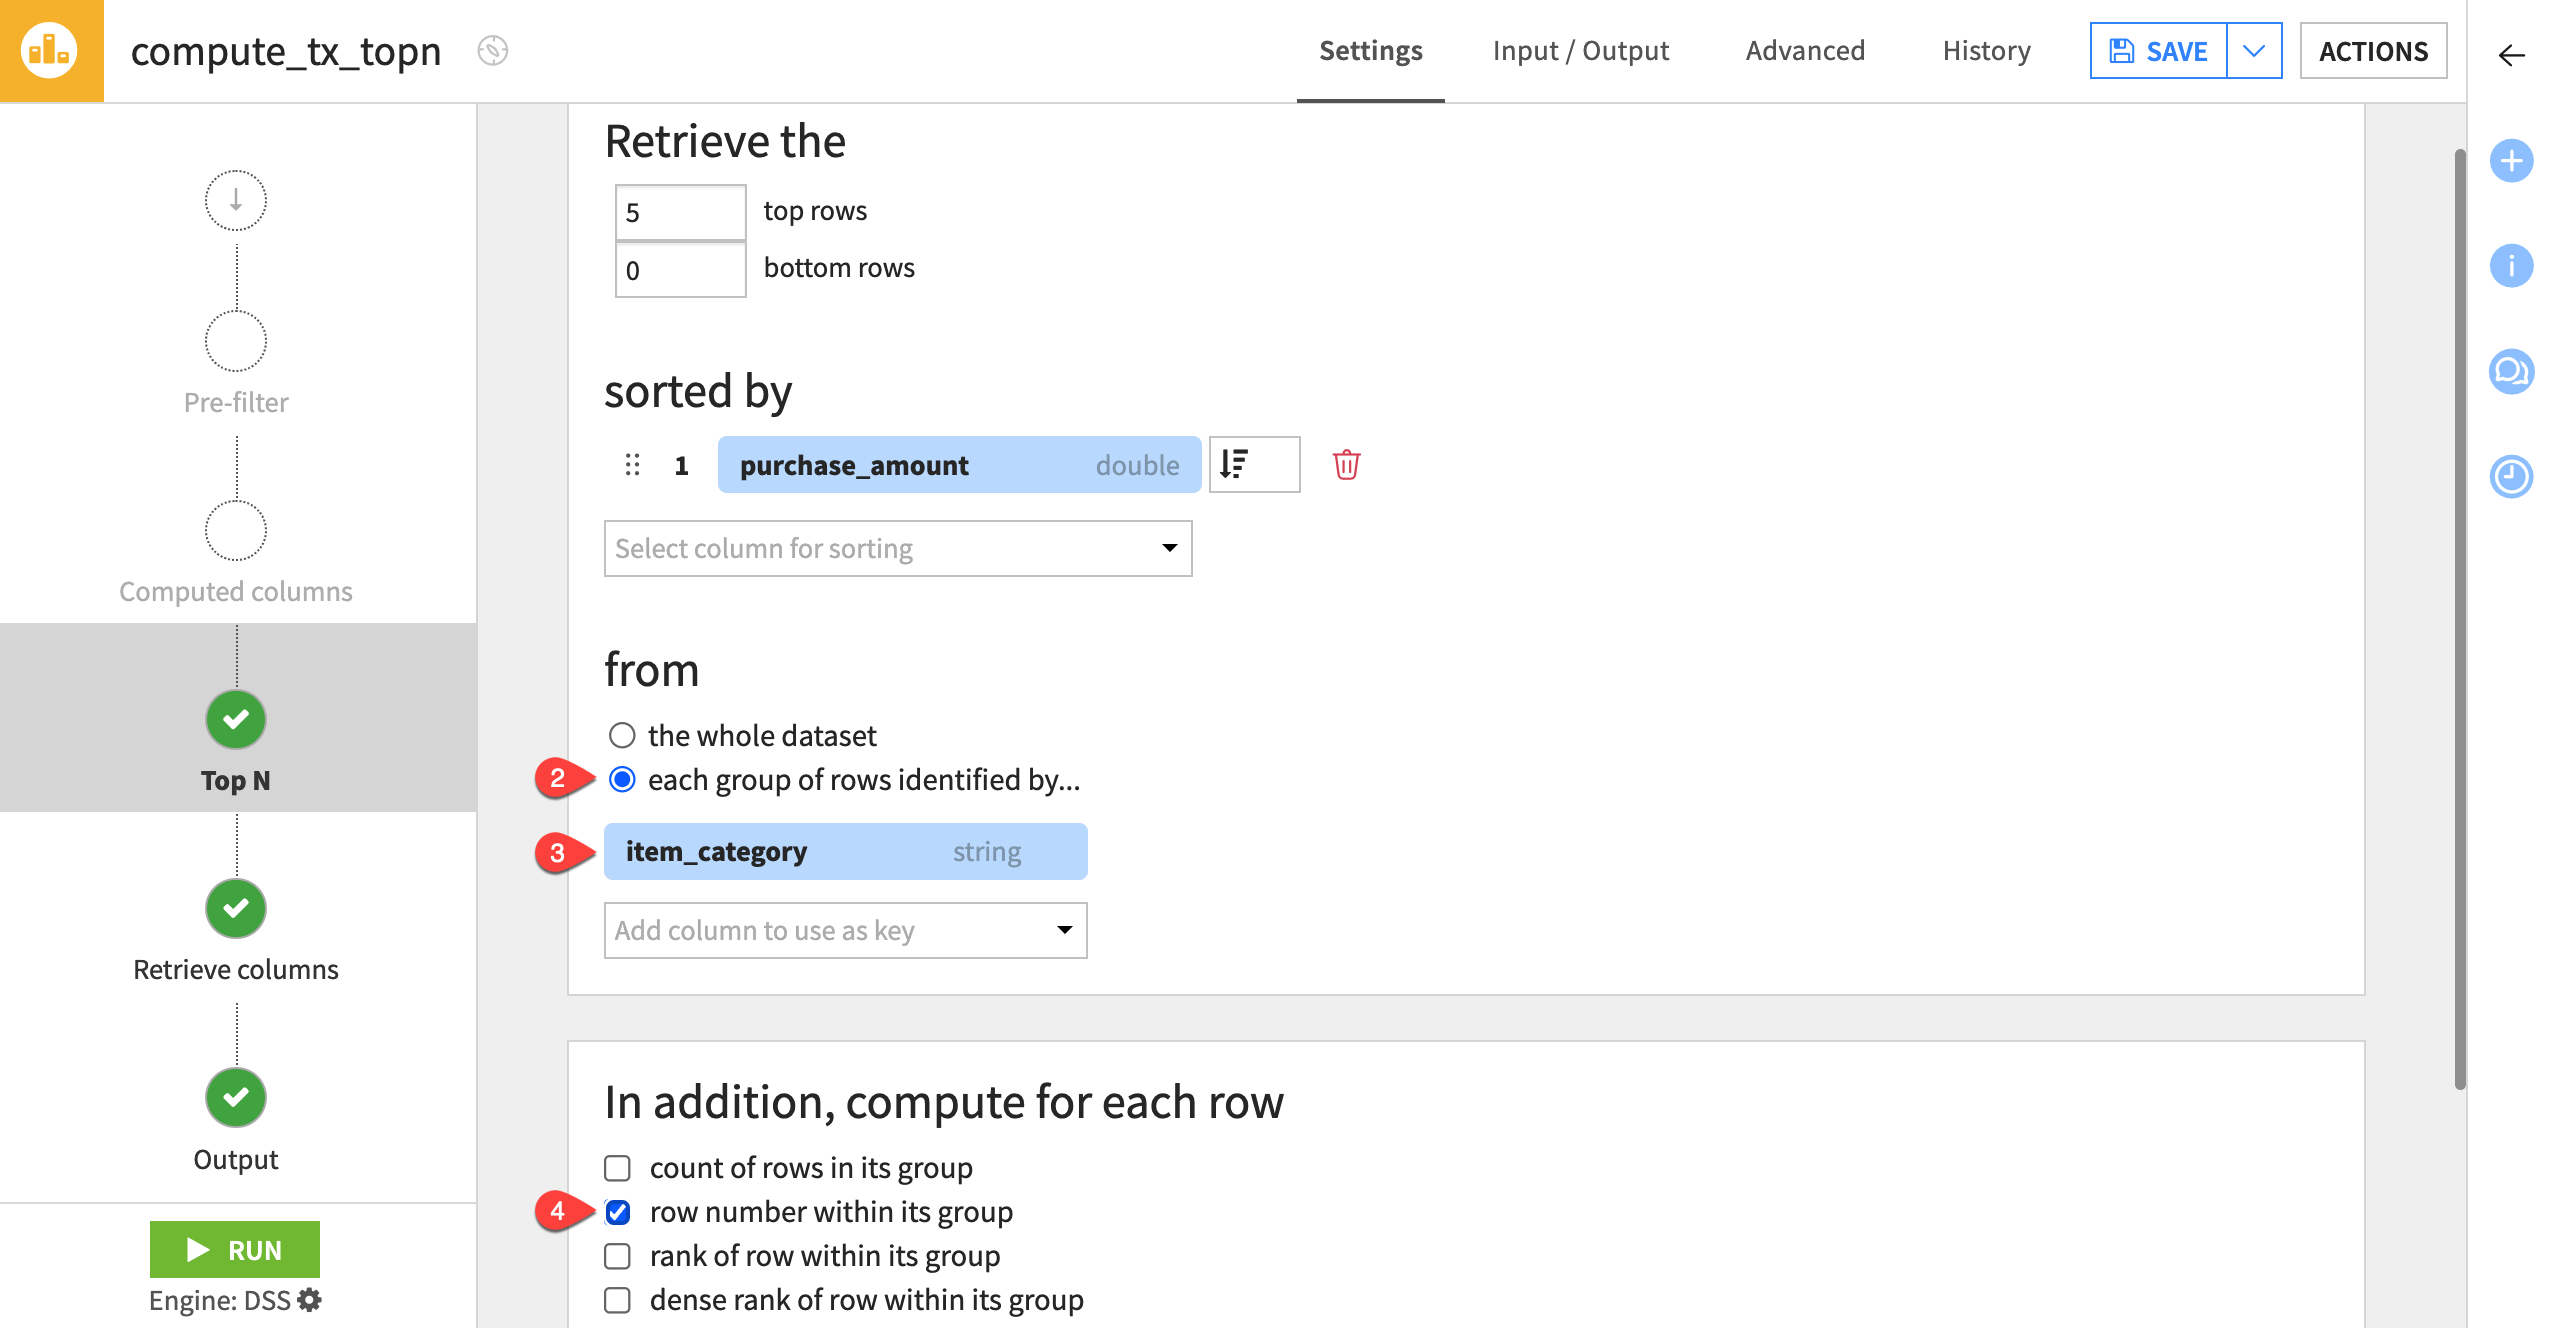
Click Parent Recipe to reopen the Top N recipe.
Under from, select each group of rows identified by.
Choose item_category as the key column.
Under In addition, compute for each row, check the row number within its group checkbox.
Retrieve a subset of columns#
The Top N recipe also allows you to select which columns to retain in the output schema.
The leaderboard would look cleaner with only columns pertaining to the analysis. You can discard the others:
Navigate to the Retrieve columns step.
Change the Mode to Select columns.
Move all columns into the Available columns section using the double left chevron (
 ).
).Move item_category and purchase_amount back to the Selected columns section using the right chevron (
 ).
).Click Run to execute the recipe, and open the output dataset.
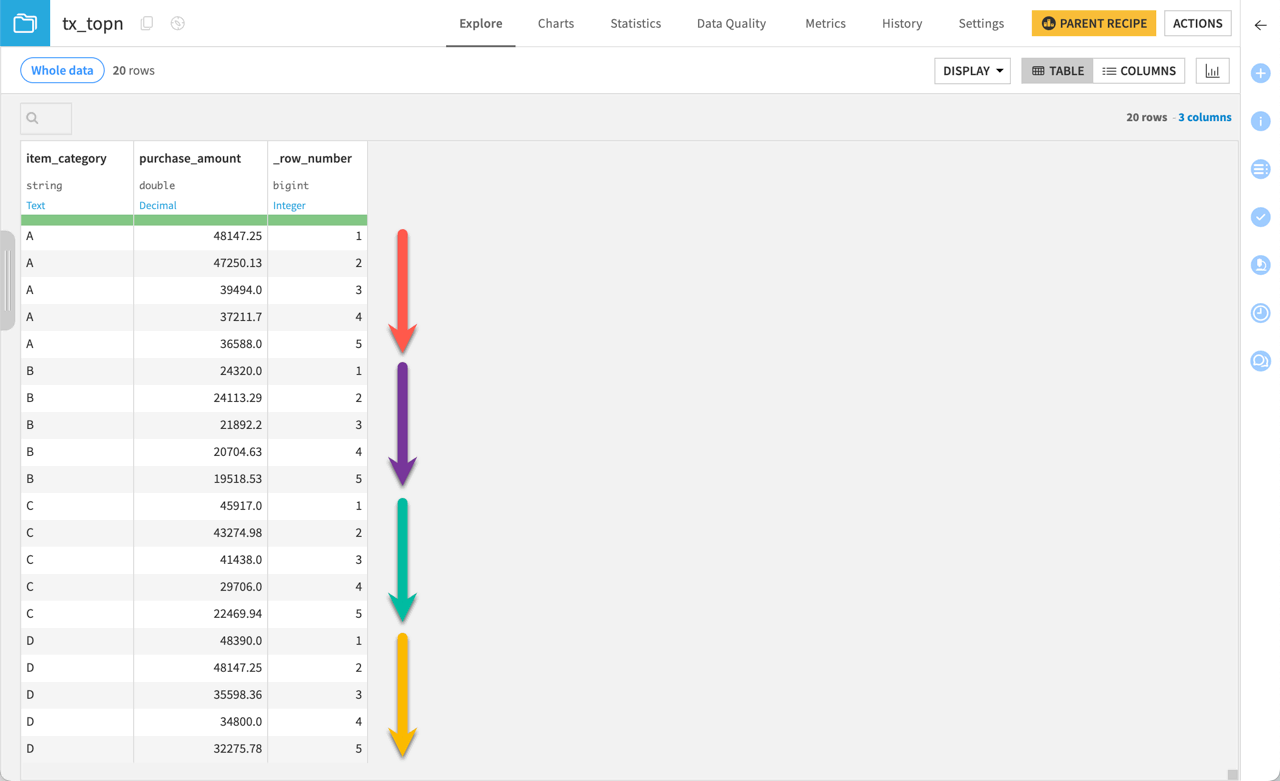
You’ll see that for each category — A, B, C, and D — there are five purchase amounts that decrease within their grouping. You can confirm from the _row_number values that each grouping has five values.
Next steps#
You just practiced using the Top N recipe to find the most expensive transactions in the dataset.
See also
For more information on this recipe, see Top N: retrieve first N rows in the reference documentation.
Continue to the Tutorial | Pivot recipe to learn more about how you can create pivot tables using another visual recipe.