
Tutorial | Pivot recipe#
The Pivot recipe transforms datasets into pivot tables, which are tables of summary statistics. You might also refer to this operation as reshaping from long to wide format.
Get started#
Objectives#
In this tutorial, you will:
Create a pivot table using the visual Pivot recipe.
Understand how the Pivot recipe computes a schema using a pre-filter step.
Prerequisites#
To complete this tutorial, you’ll need the following:
Dataiku 14.0 or later.
Create the project#
From the Dataiku Design homepage, click + New Project.
Select Learning projects.
Search for and select Pivot Recipe.
If needed, change the folder into which the project will be installed, and click Create.
From the project homepage, click Go to Flow (or type
g+f).
Note
You can also download the starter project from this website and import it as a ZIP file.
You’ll next want to build the Flow.
Click Flow Actions at the bottom right of the Flow.
Click Build all.
Keep the default settings and click Build.
Use case summary#
Let’s say we’re a financial company that uses some credit card data to detect fraudulent transactions.
The project comes with three datasets, described in the table below.
Dataset |
Description |
|---|---|
tx |
Each row is a unique credit card transaction with information such as the card that was used and the merchant where the transaction was made. It also indicates whether the transaction has either been:
|
merchants |
Each row is a unique merchant with information such as the merchant’s location and category. |
cards |
Each row is a unique credit card ID with information such as the card’s activation month or the cardholder’s FICO score (a common measure of creditworthiness in the US). |
Create the Pivot recipe#
In this exercise, you’ll focus on reshaping the tx_prepared dataset from long to wide format using the bins in the cardholder_fico_range column. This column categorizes FICO scores (a US rating system of creditworthiness) into four bins (bad, excellent, fair, and good).
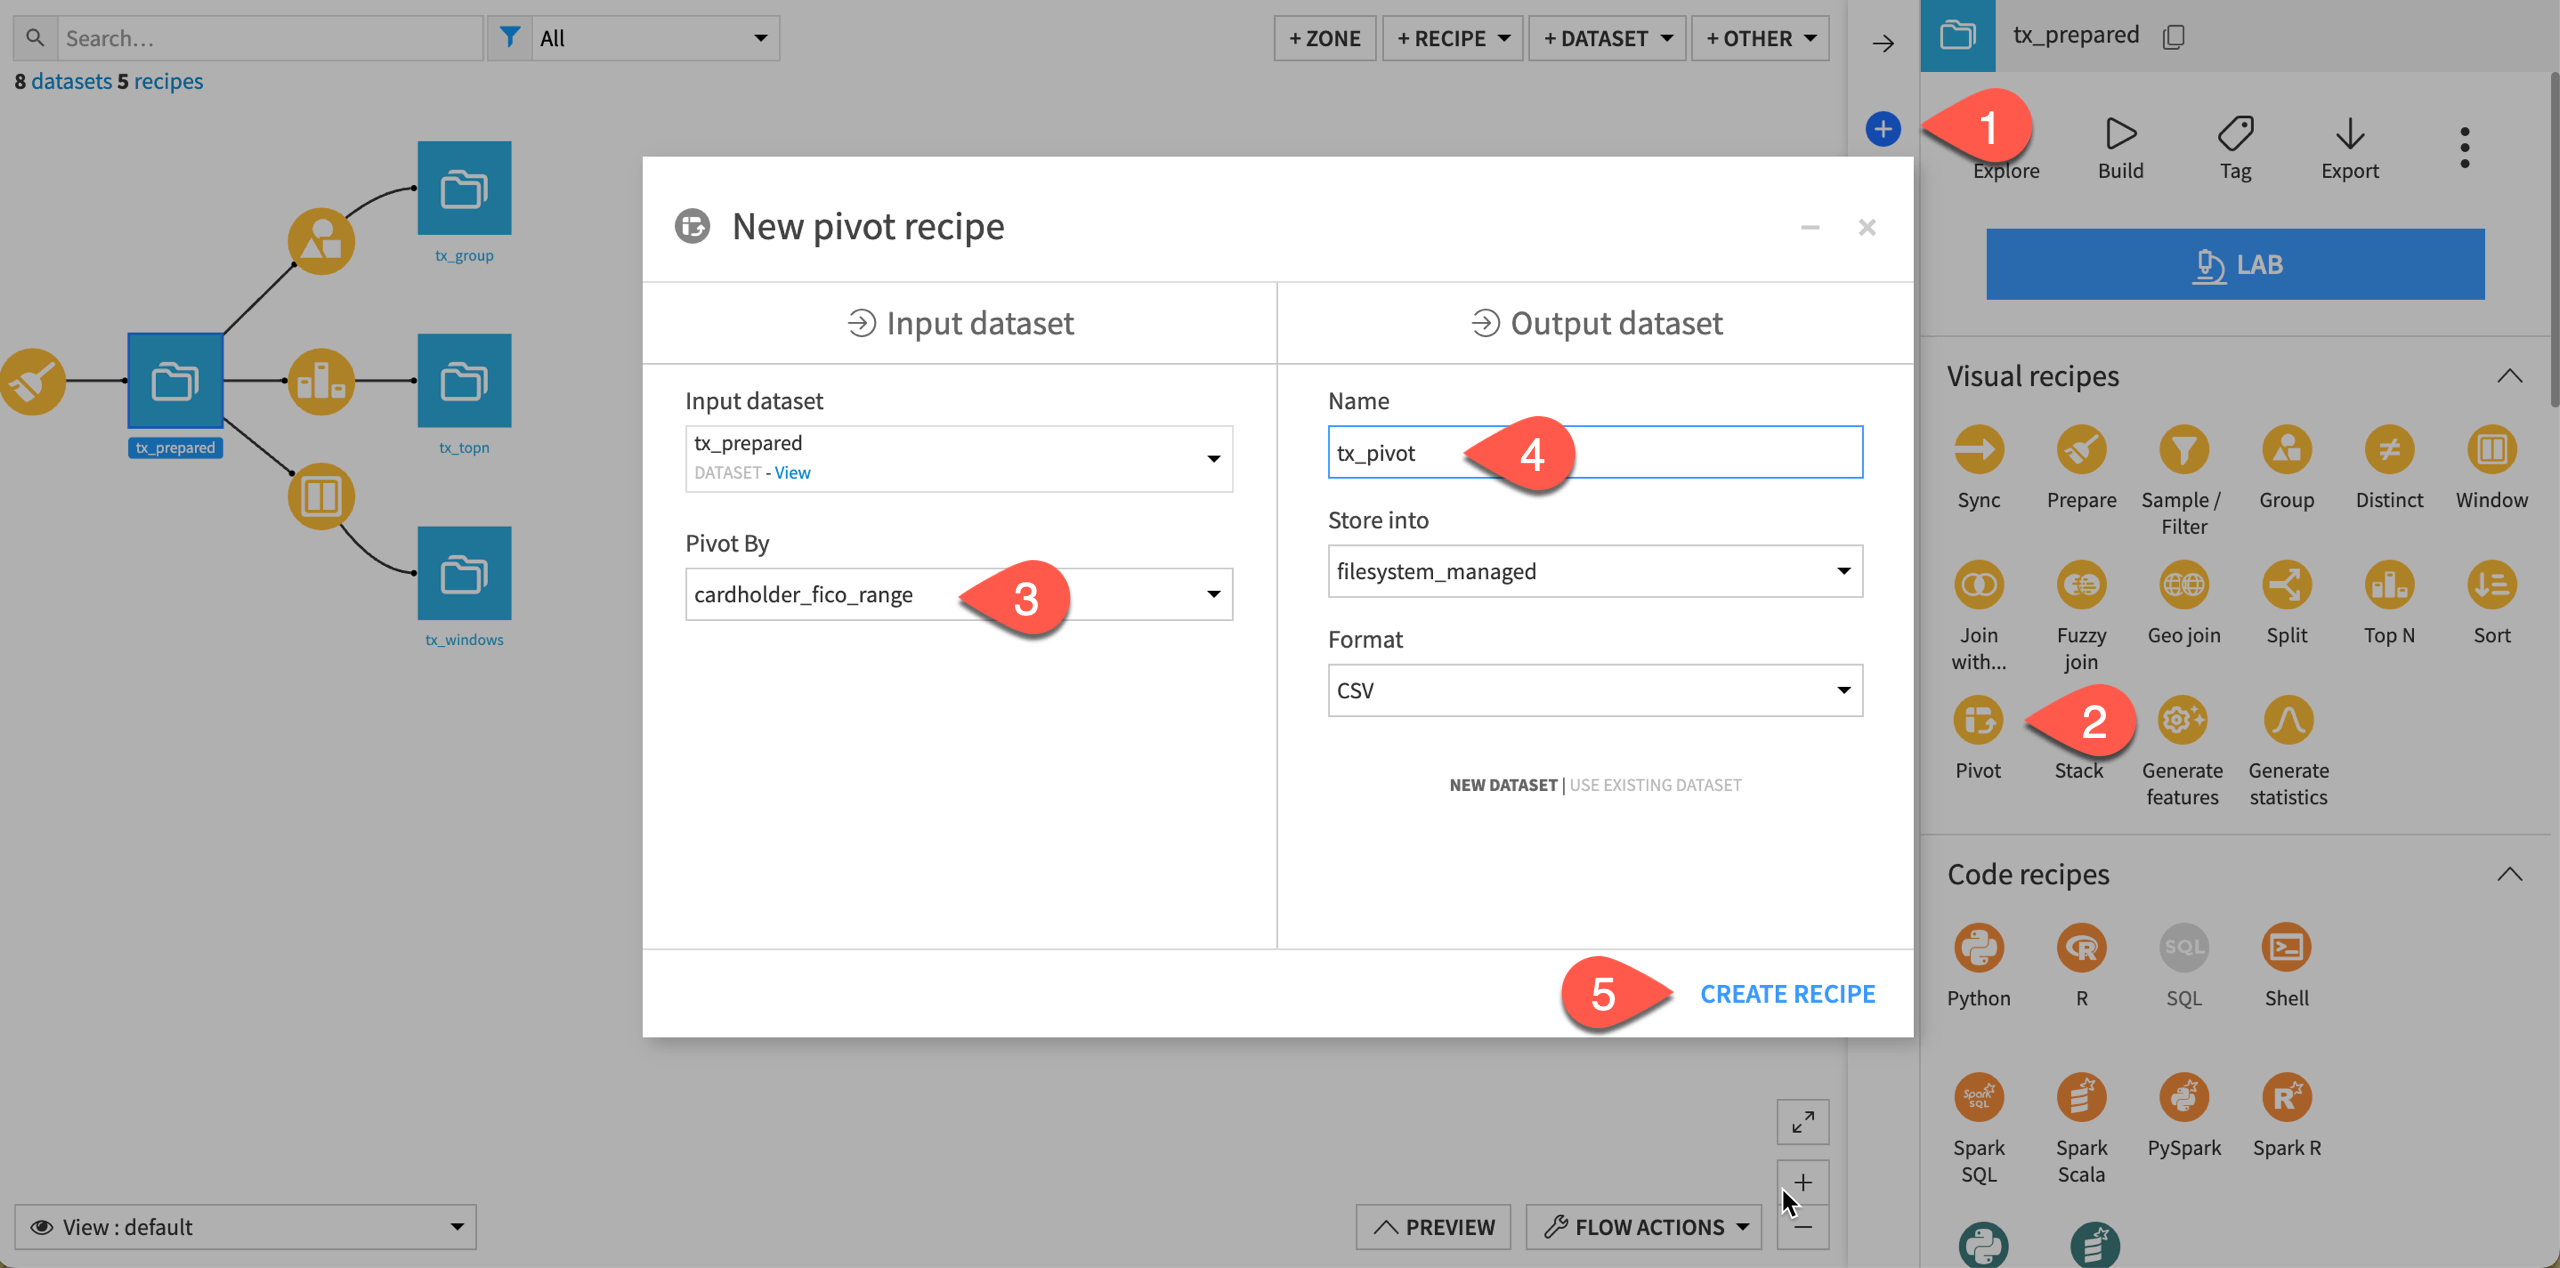
From the Flow, select tx_prepared.
In the Actions tab on the right, select Pivot from the menu of visual recipes.
In the dialog, choose to Pivot by the column cardholder_fico_range.
Name the output dataset
tx_pivot.Click Create Recipe.
Configure the Pivot step#
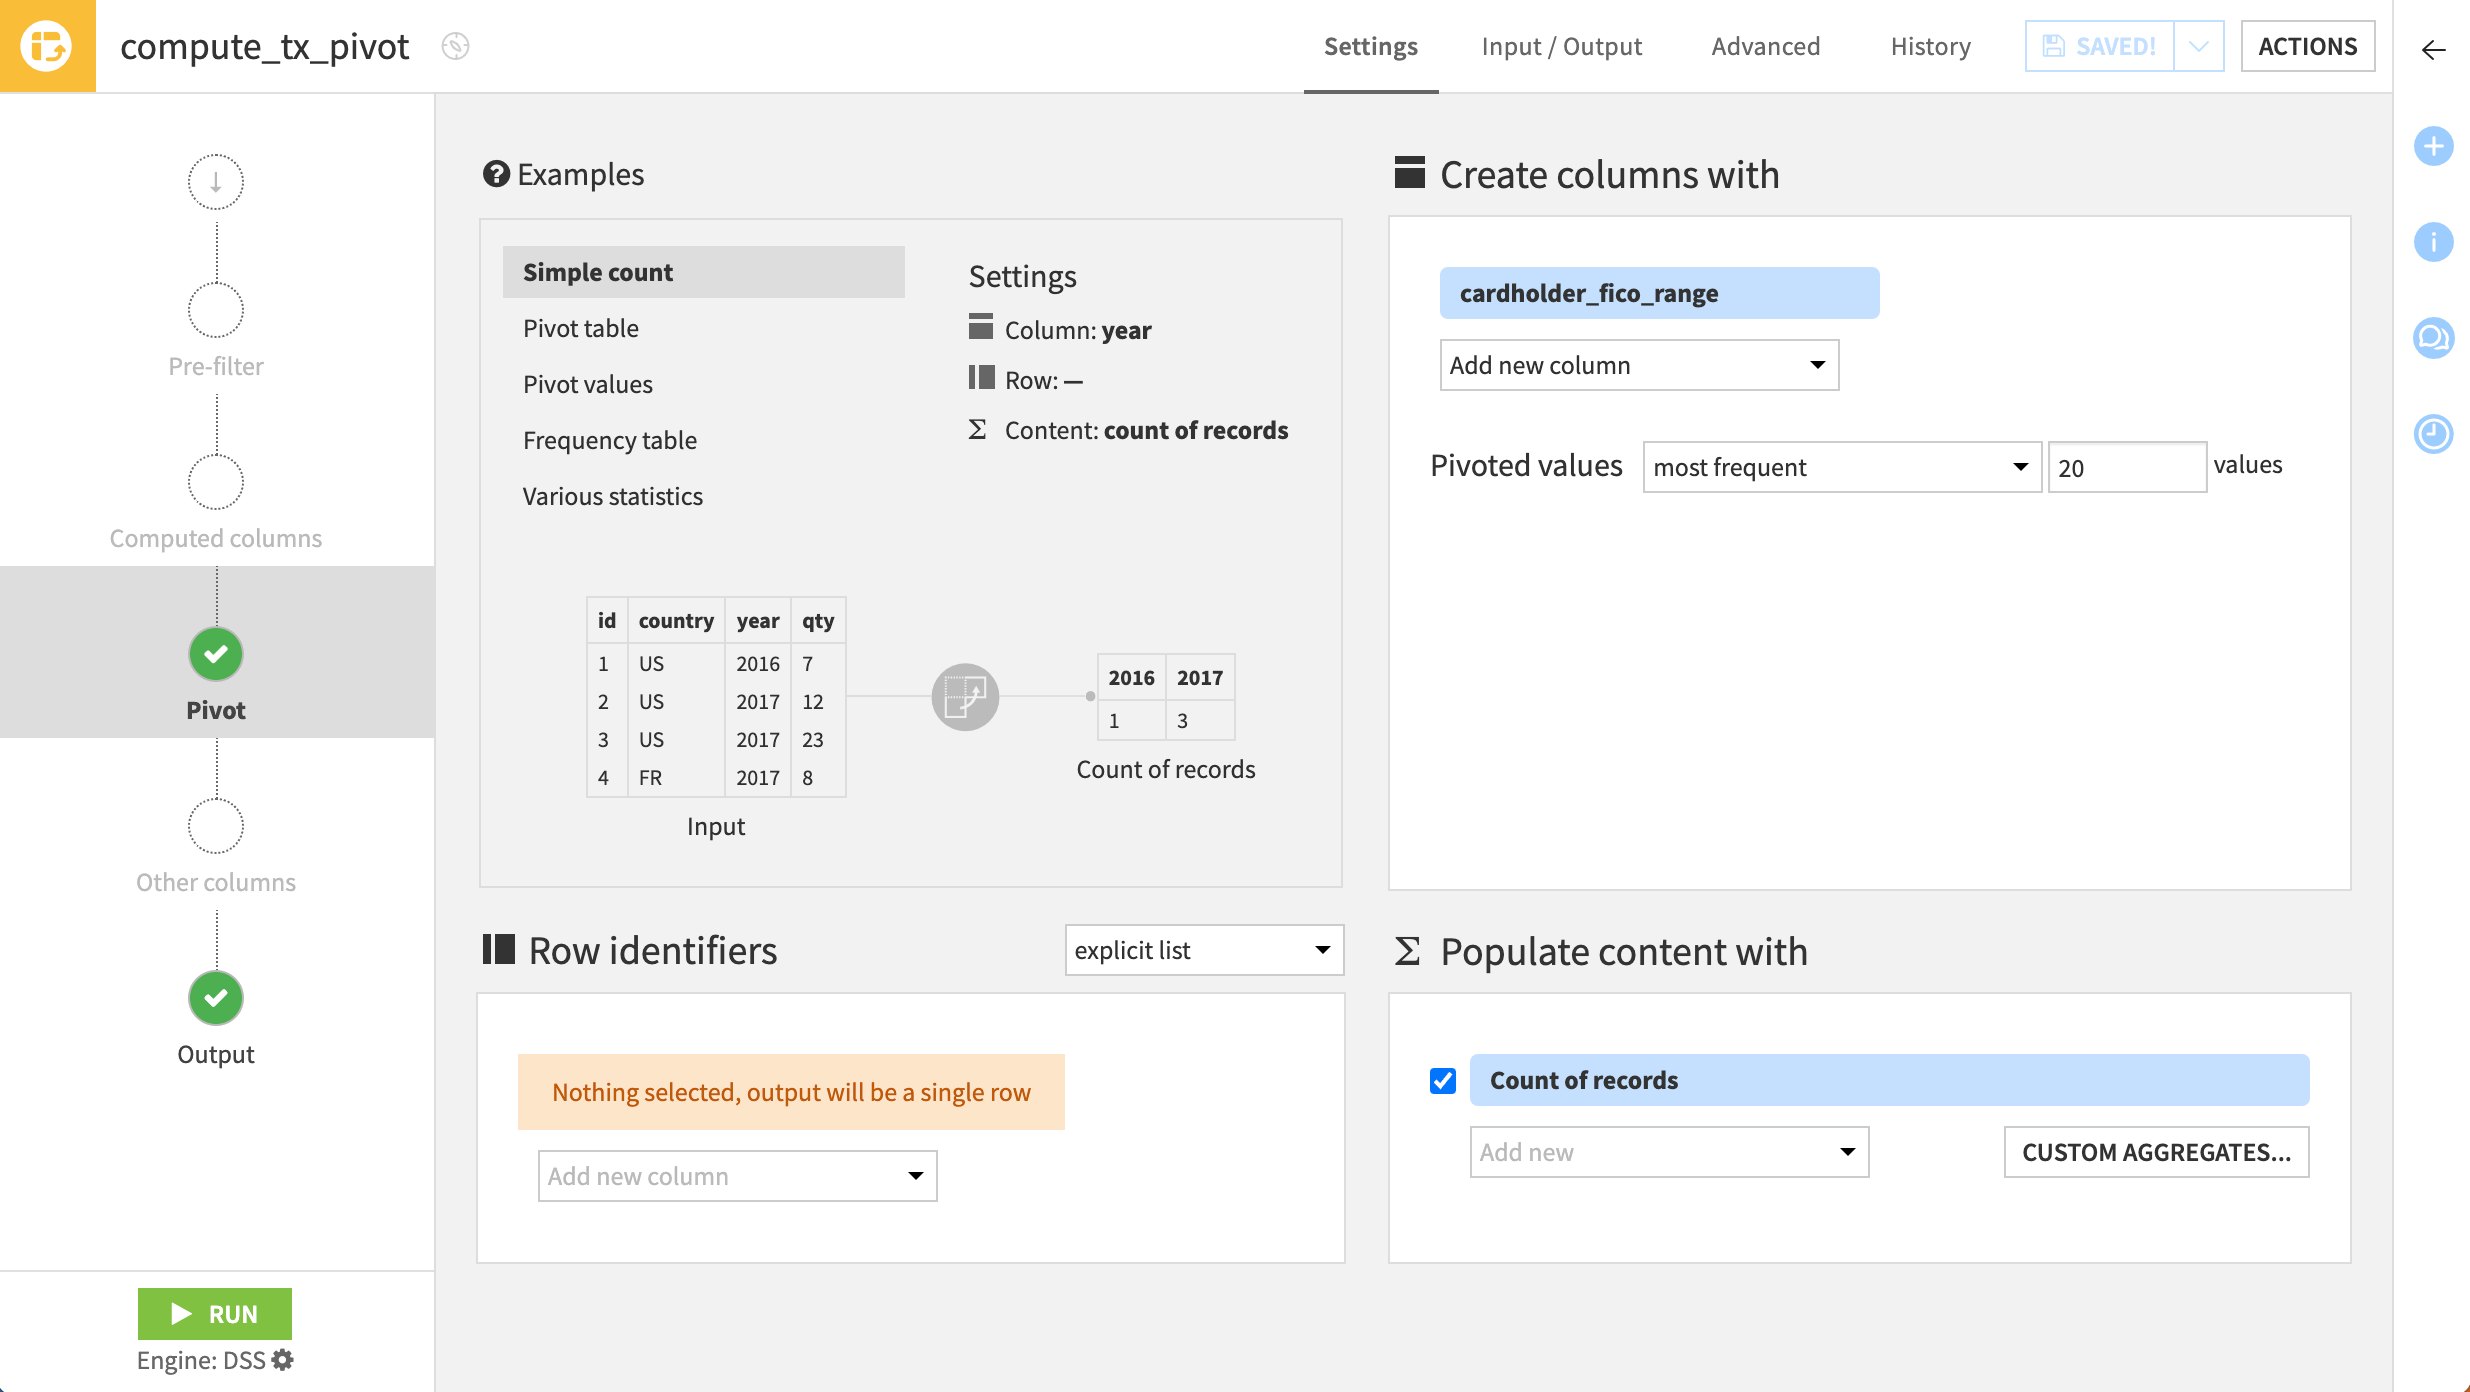
On the Pivot step, cardholder_fico_range already populates the Create columns with field at the top right because of the choice in the recipe’s initial creation.
For each distinct value of this pivot column, the Pivot recipe will create a new column for each aggregation specified in the Populate content with section in the bottom right.
This includes Count of records by default. Before adding any row identifiers or more aggregations, first see how the four distinct values in the selected pivot column get transposed into columns.
On the Pivot step, make no changes.
Navigate to the Output step, and observe how the schema couldn’t be inferred. You’ll explore this soon.
Click Run at the bottom left, and open the output dataset when the recipe finishes running.
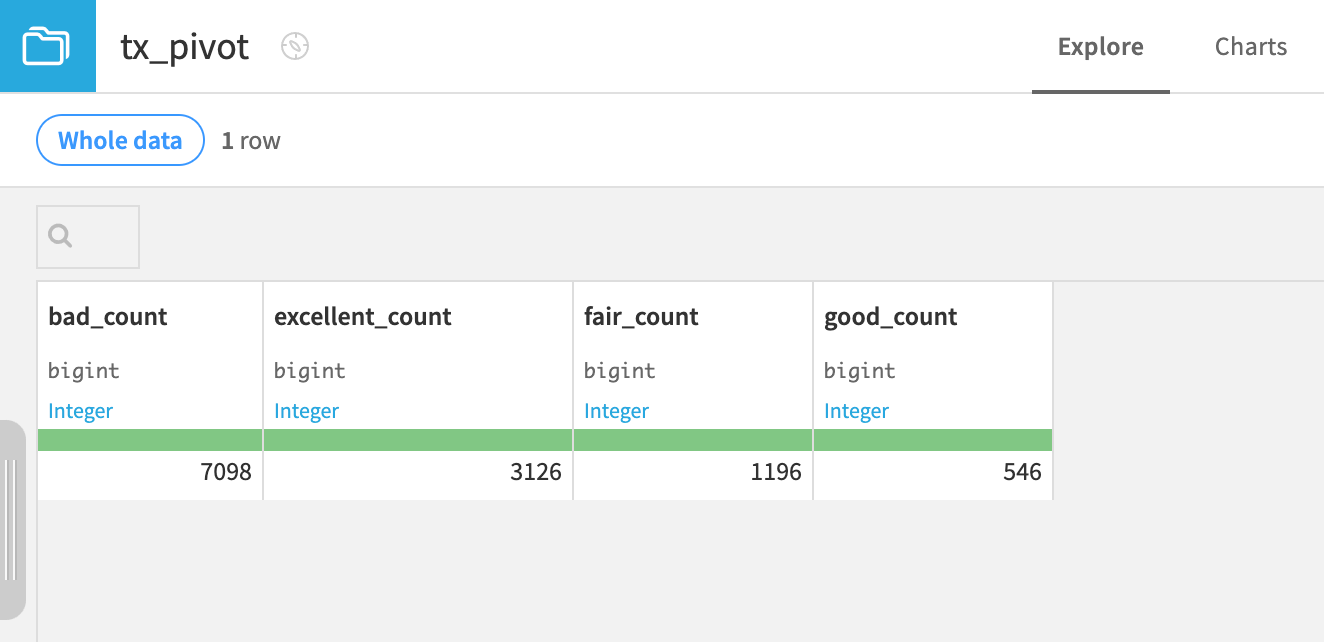
Without selecting any row identifiers, the output to this Pivot recipe is one row. Thus far, the output only includes the record counts for each bin. Because the pivot column has four distinct values and one aggregation, the output dataset has four columns.
Add a row identifier#
What’s typically more useful is to add row identifiers. This field makes it possible to produce aggregations according to specific groups.
Click Parent Recipe to return to the Pivot step.
On the Pivot step, select authorized_flag as a row identifier.
Click Run at the bottom left, and open the output dataset when the recipe finishes running.
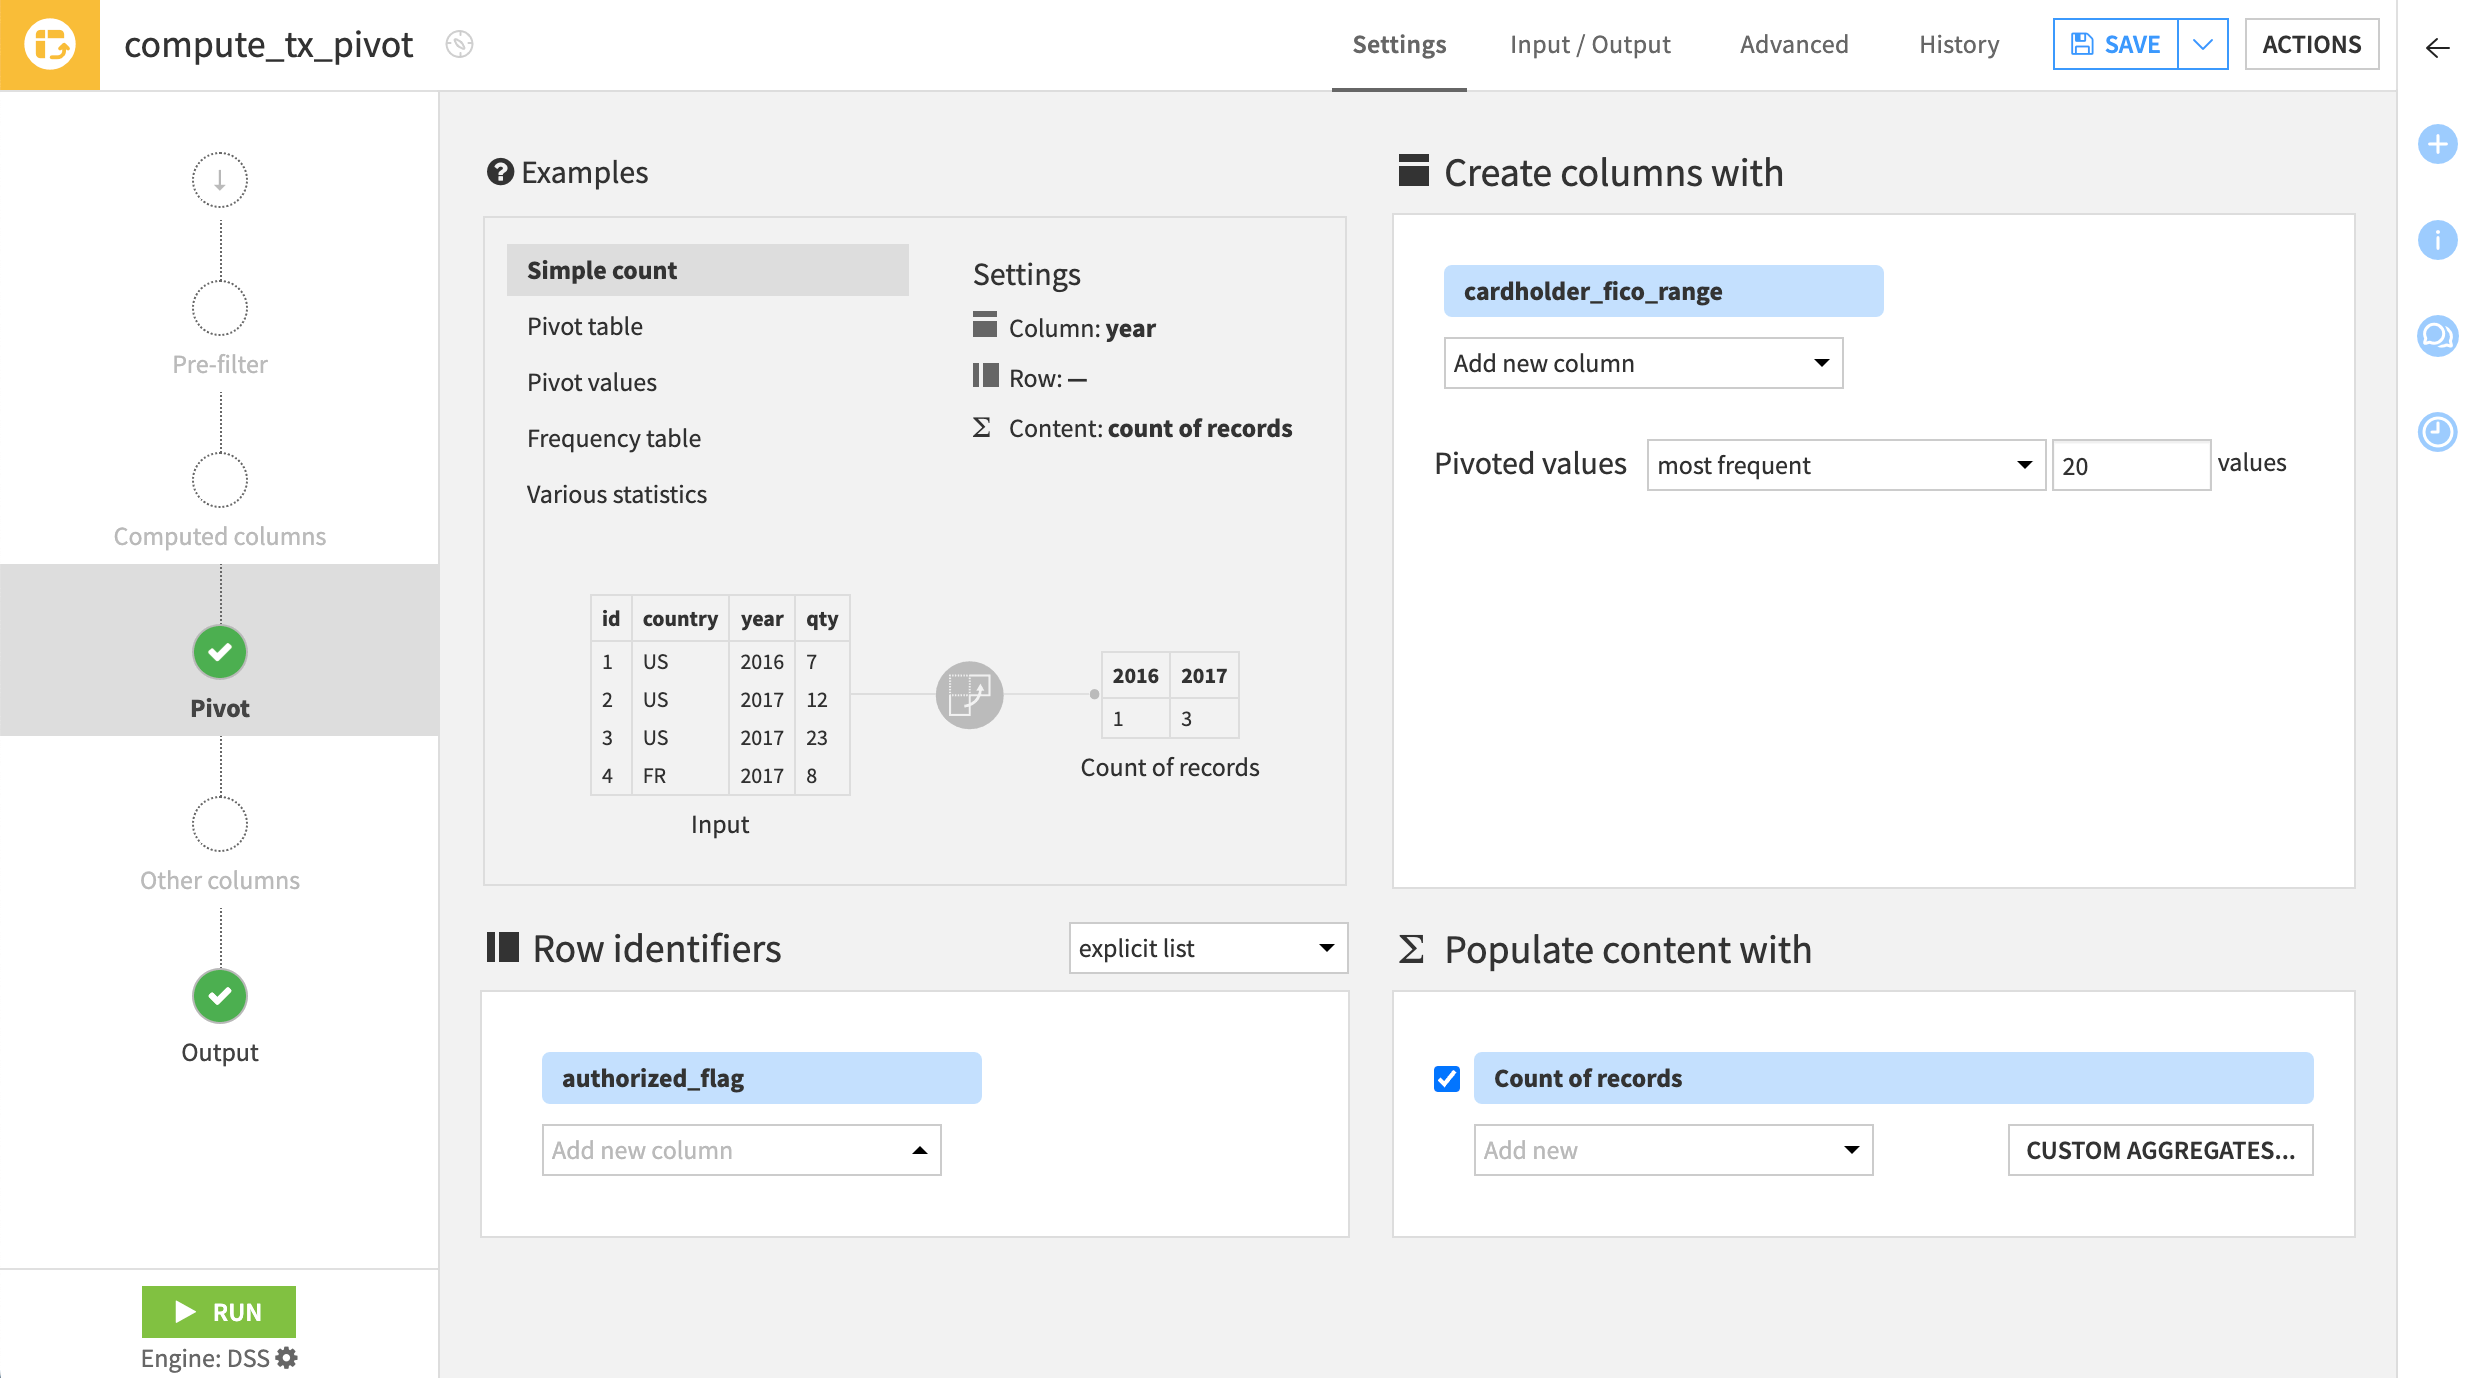
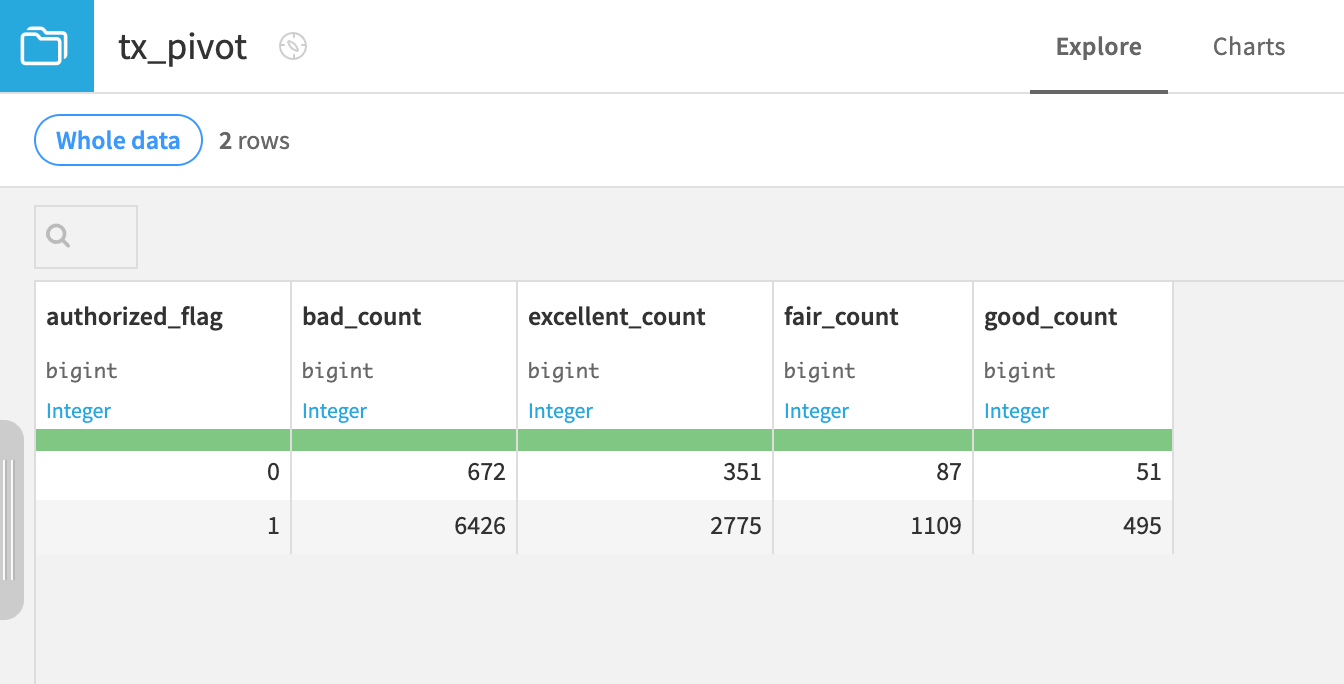
Because authorized_flag has two distinct values, the output now has two rows. It produces a table of counts by FICO score for both authorized (1) and unauthorized (0) transactions.
Tip
To go further on your own, experiment adding additional row identifiers, such as item_category!
Populate content with aggregations#
Now select an additional aggregation: the average purchase_amount of authorized and unauthorized transactions across FICO categories.
Click Parent Recipe to return to the Pivot step.
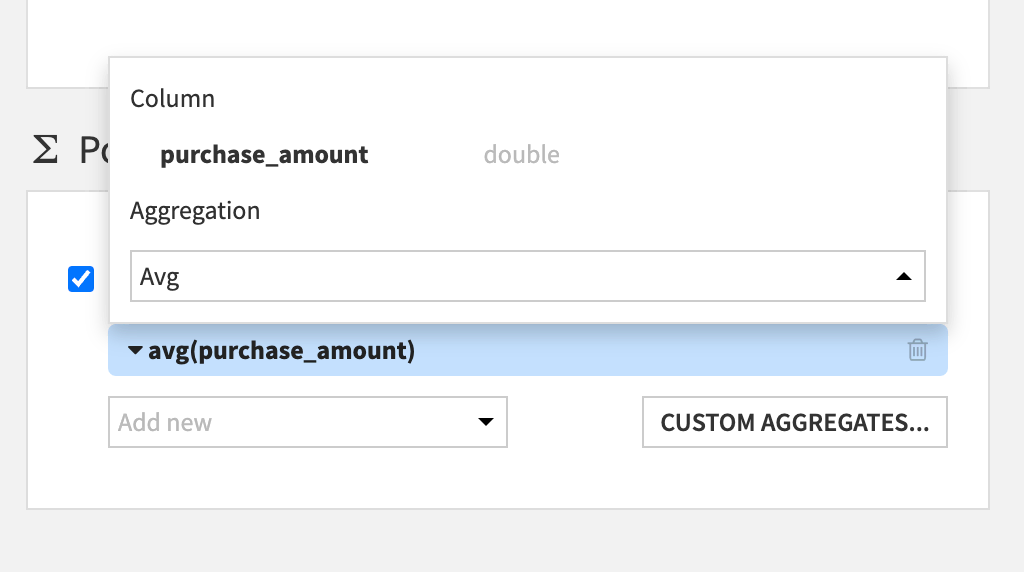
On the Pivot step, in the Populate content with tile, click Add new, and select purchase_amount.
Click on count(purchase_amount) to change the aggregation. Switch to Avg.
Click Run at the bottom left, and open the output dataset when the recipe finishes running.
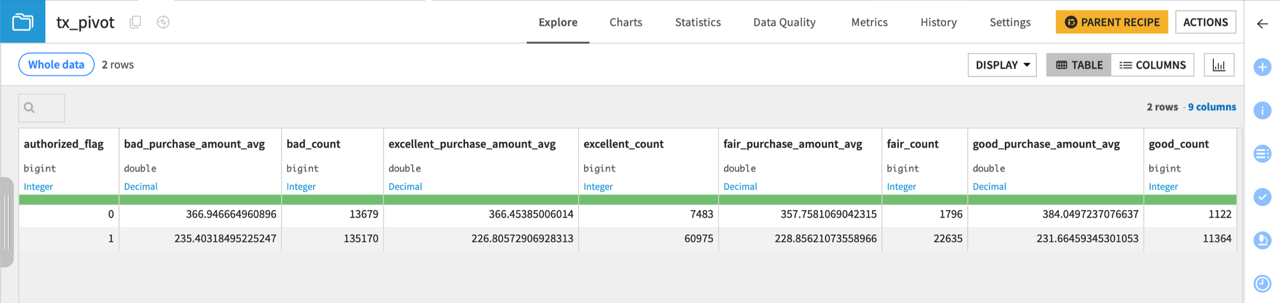
The addition of one aggregation has added four columns to the output dataset (one for each distinct value of the pivot column).
When new values appear#
The Pivot recipe is a two-pass algorithm:
On the first pass, it finds the values for new output columns and generates the dataset schema.
On the second pass, it populates the pivot table.
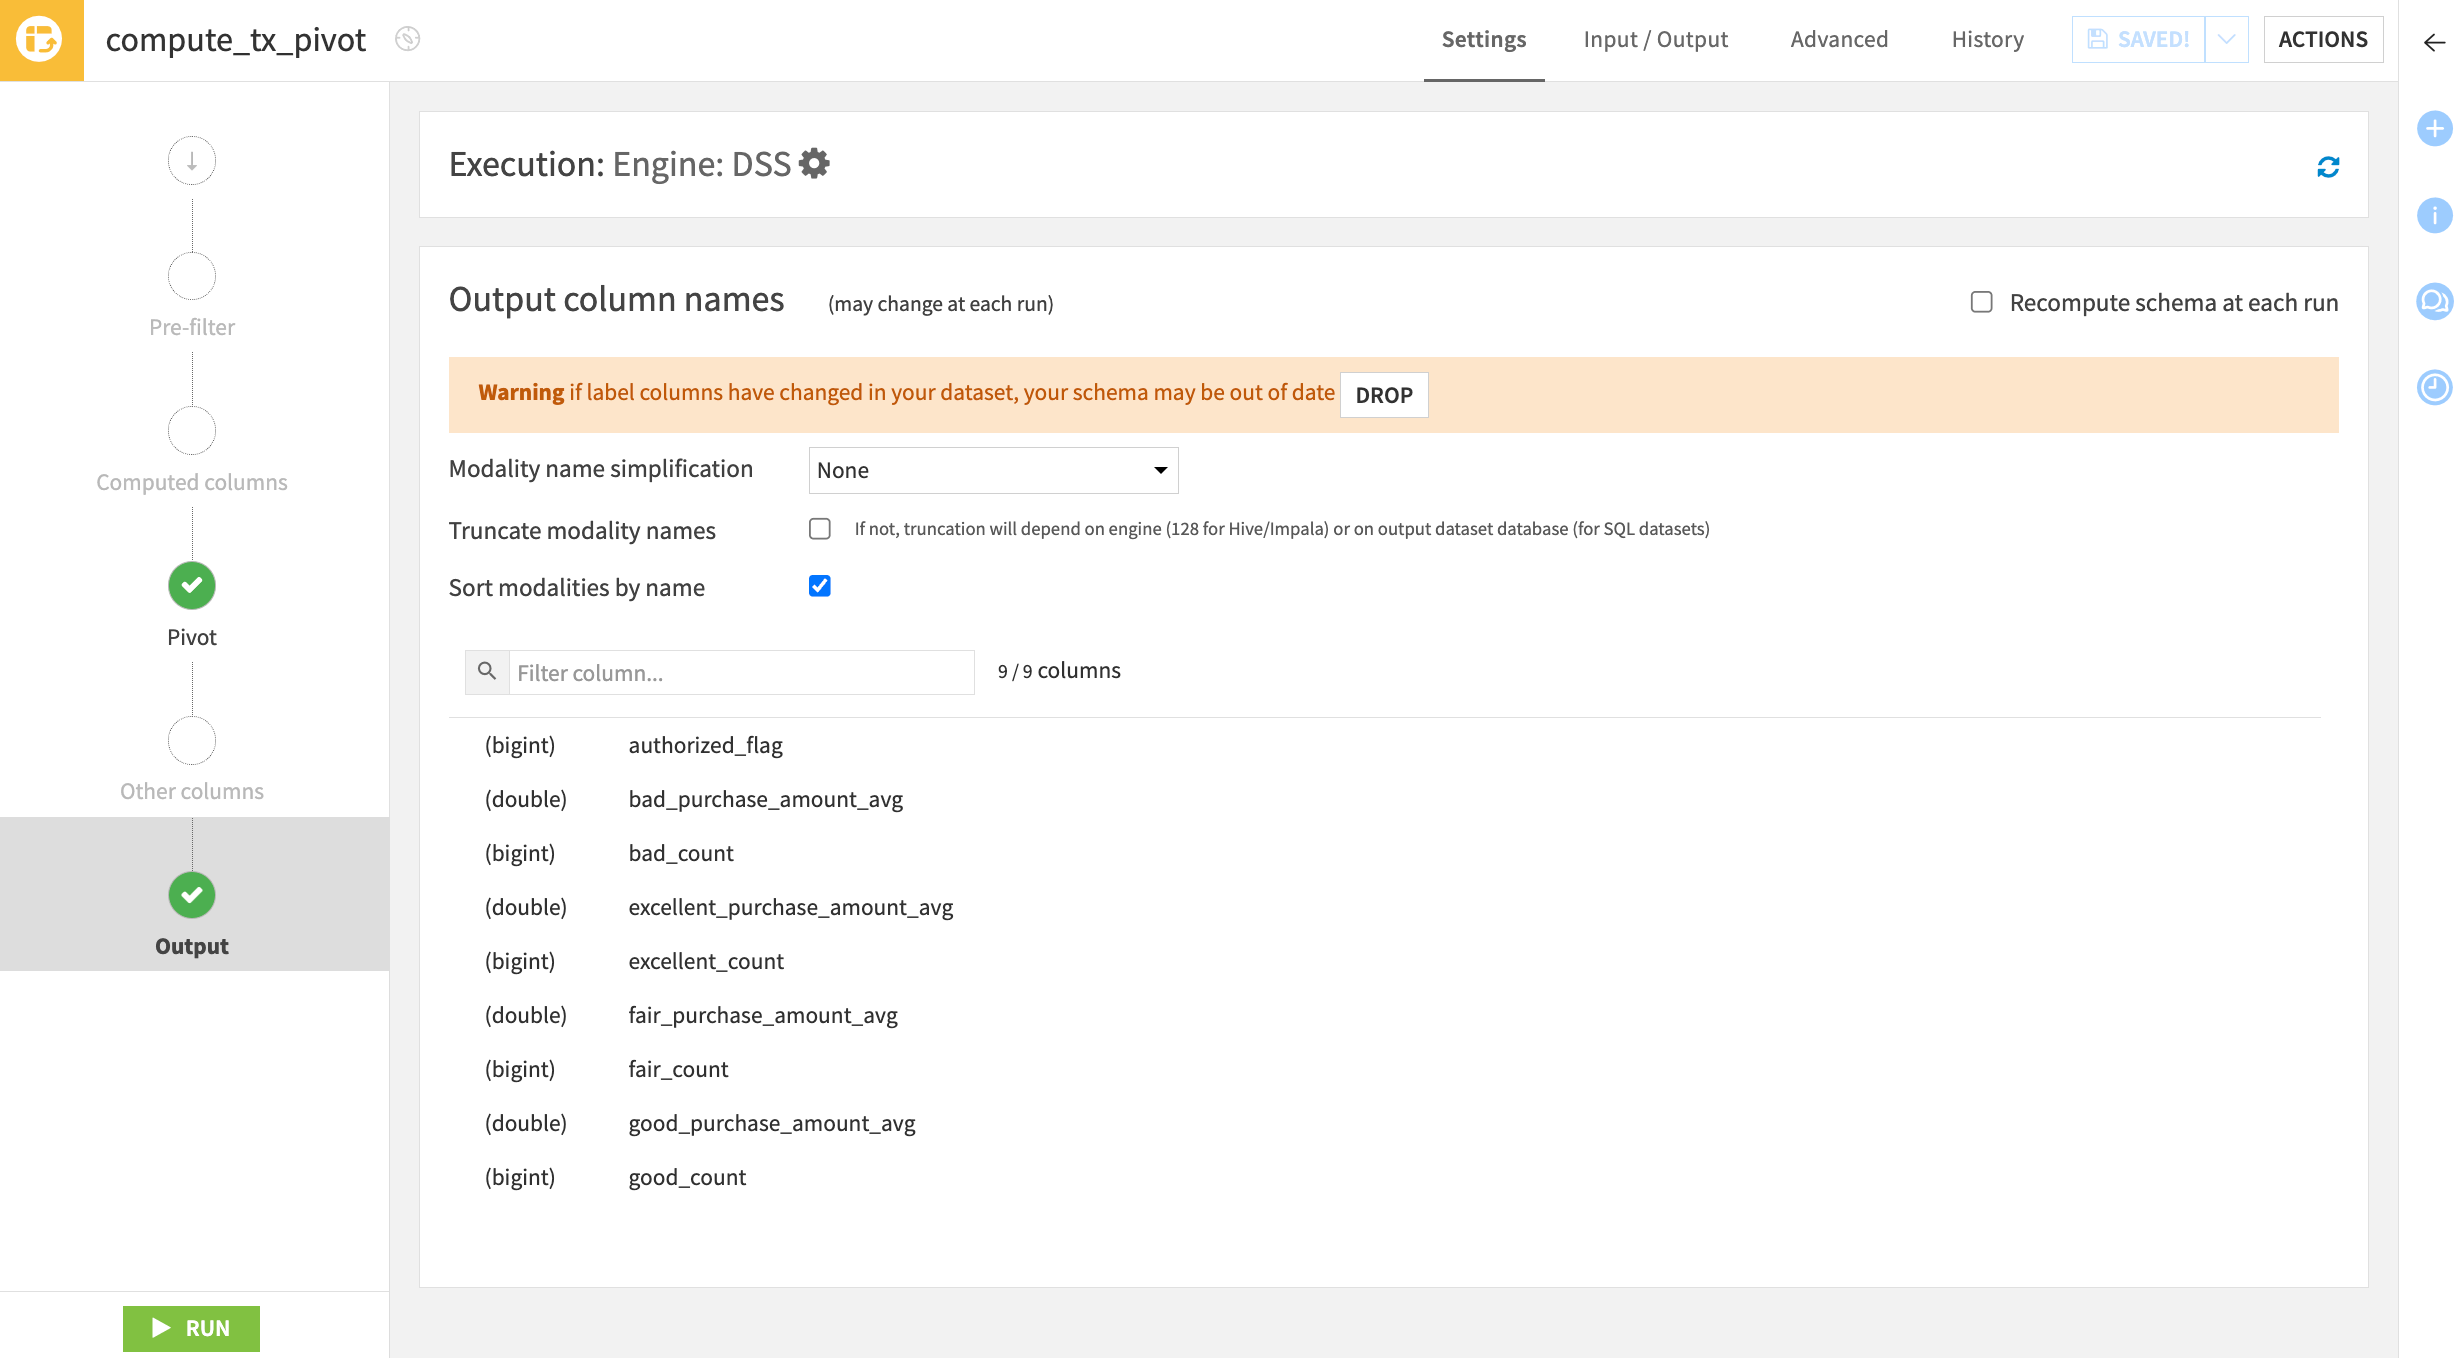
If you return to the recipe’s Output step, you can see the output column names listed — the same as many other visual recipes.
Click Parent Recipe to return to the Pivot step.
Navigate to the Output step on the left.
What’s different is that in most visual recipes, only the column names of the input dataset impact the schema of the output dataset. In the Pivot recipe, however, the actual values in the pivot column impact the output schema.
In this case, the four distinct values in the cardholder_fico_range column (bad, fair, good, and excellent) determine the number of columns in the output dataset. But what happens if the latest version of the dataset includes another FICO range value — such as extraordinary?
By default, rebuilding the dataset skips the first pass described above. It doesn’t look for any new values of the pivot column and repopulates the table (the second pass).
Two options exist for updating the schema from the Output step of the Pivot recipe:
Manually drop the existing schema by clicking the Drop button.
Select Recompute schema at each run to automatically update every time the tx_pivot dataset is built.
Caution
With this second method, an updated schema can break the Flow if the following recipes expect the old schema.
Apply a pre-filter to the Pivot recipe#
These options will become clearer through the use of a pre-filter. If there are too many distinct values in the column to pivot by, the number of columns in the output dataset can grow out of control.
Important
By default, the Pivot recipe pivots only the 20 most frequently occurring values. The Pivot recipe can create a maximum of up to 200 columns.
Define a pre-filter to keep only rows where the card holder’s FICO range is bad or fair. This way, the first pass of the Pivot recipe’s algorithm will only find two instead of four values.
Navigate to the Pre-filter step of the Pivot recipe.
Toggle the Filter On, and choose to keep rows that satisfy the condition:
cardholder_fico_range EqualsbadOrcardholder_fico_range Equalsfair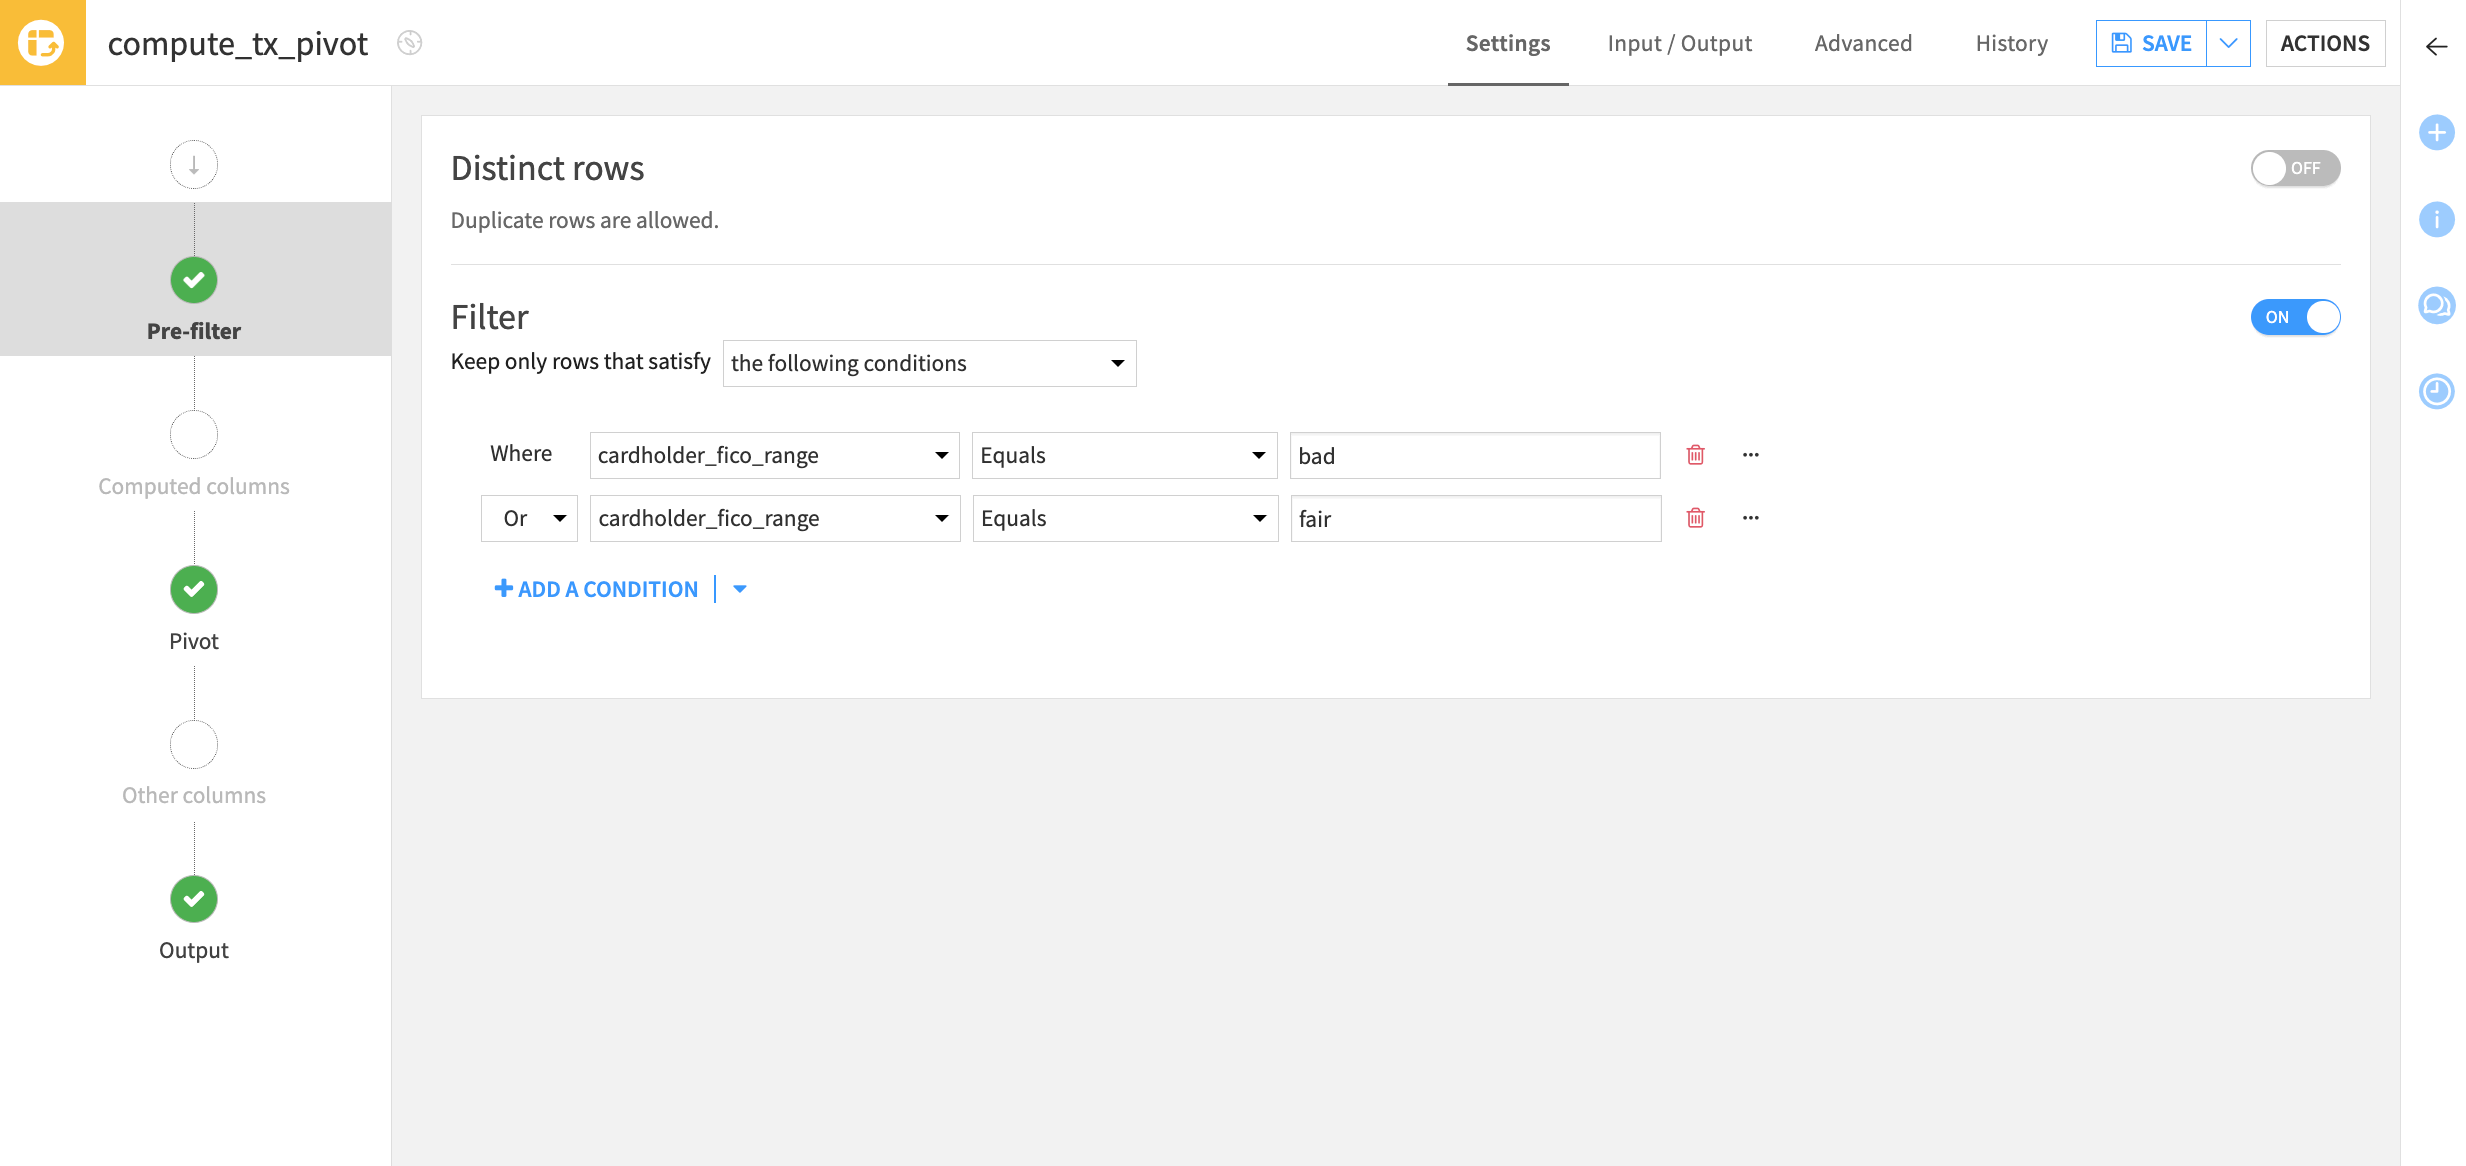
Before running the recipe, navigate to the Output step.
Notice the warning that if label columns have changed, then the schema may be out of date. After setting the pre-filter, the dataset will have only
badandfairvalues in the pivot column. However, the good_* and excellent_* columns remain in the schema.Click Run to execute the recipe again without dropping the existing schema or recomputing it. Then, open the output dataset.
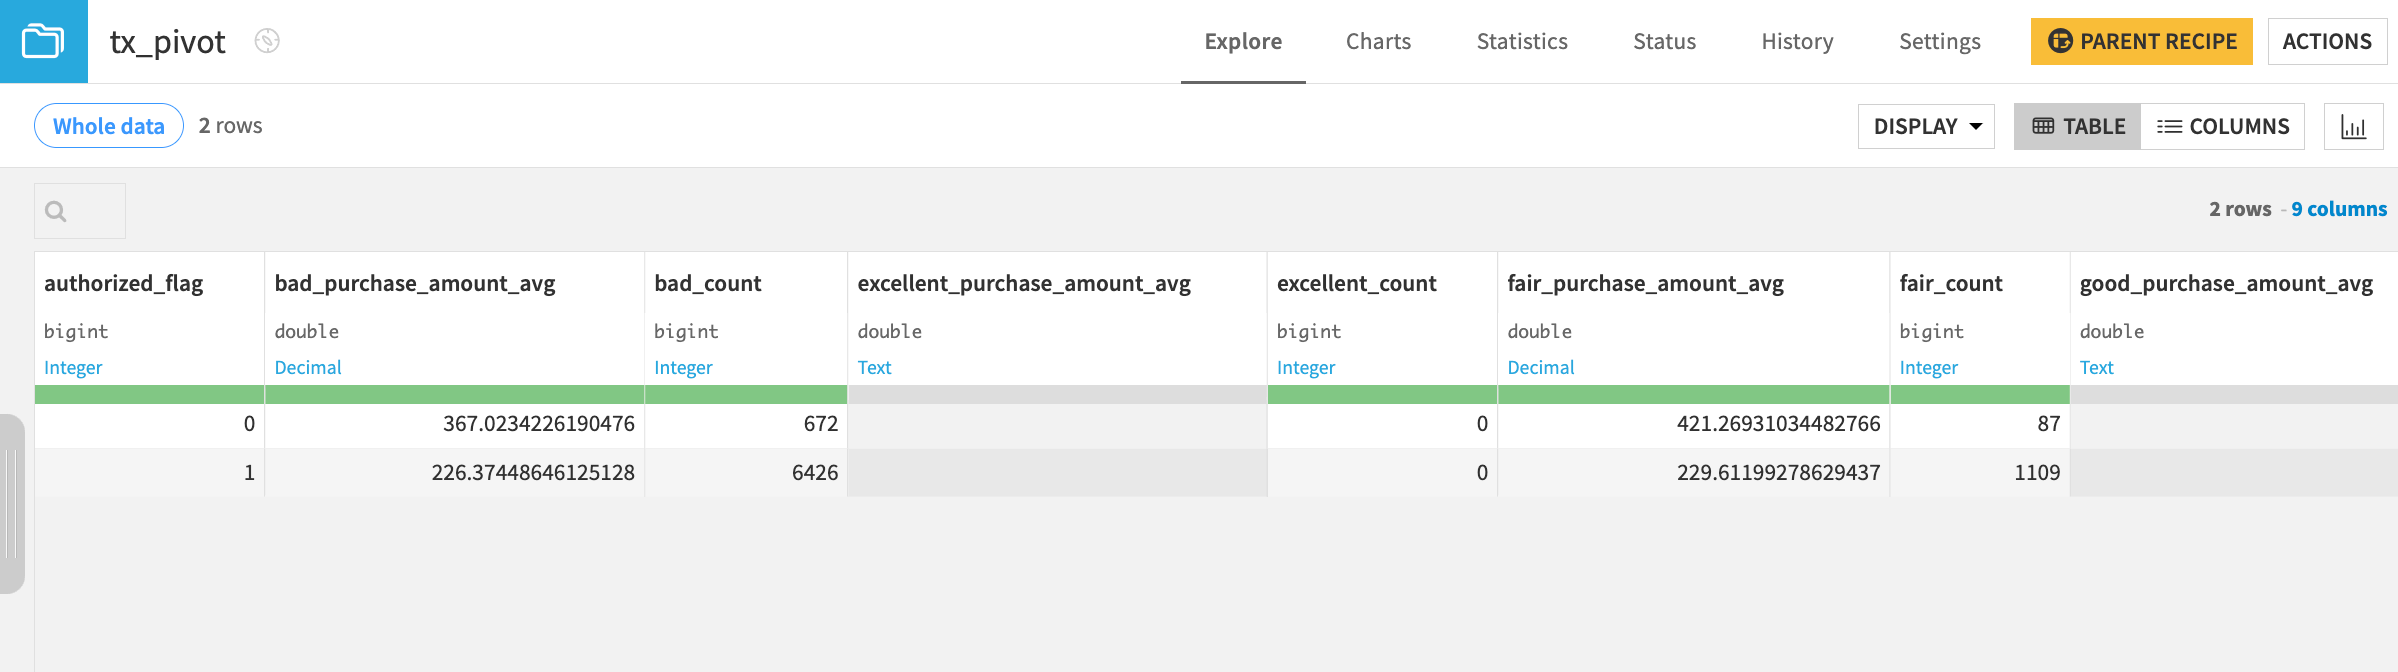
Tip
The good_* and excellent_* columns remain in the output dataset, but the values are empty. Often this may be a fine outcome. The Flow didn’t break!
Drop the existing schema of a Pivot recipe#
To remove the empty columns, drop the existing schema before re-running the recipe.
Click Parent Recipe to return to the Pivot step.
Navigate to the Output step.
Click Drop to manually update the schema, and Confirm.
Click Run again, and open the output dataset.
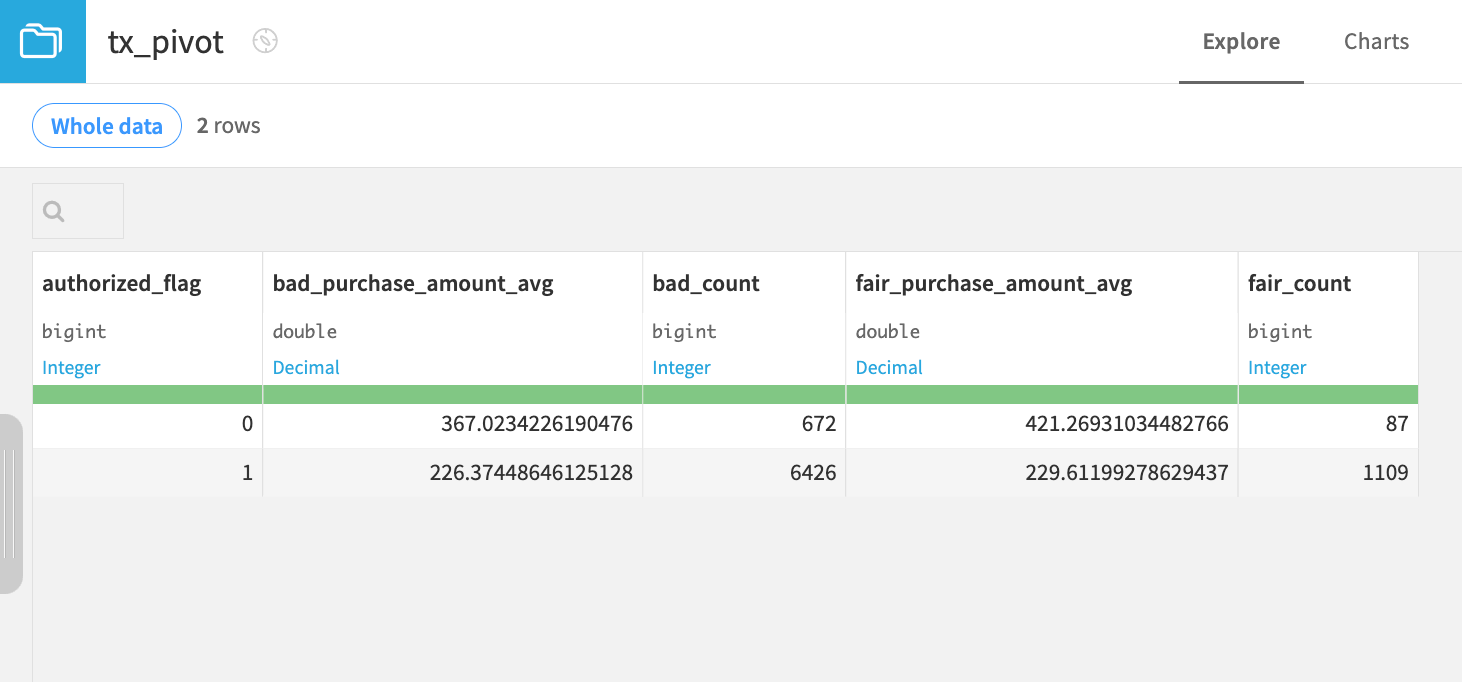
The schema of the output dataset now only contains columns for the bad and fair values of the cardholder_fico_range column.
Important
After dropping the good_* and excellent_* columns, if there were further downstream datasets, you’d need to check for incompatible schemas.
Next steps#
In this tutorial, you learned how to create pivot tables to report summary statistics using the Pivot recipe in Dataiku. You also learned how to apply a pre-filter in a Pivot recipe to understand how the recipe computes the output schema.
See also
For more information on this recipe, see Pivot recipe in the reference documentation.
There are still many other visual recipes. Try the Distinct recipe next!