
Concept | Metrics & checks (pre-12.6)#
Watch the video
Important
This article applies to Dataiku versions 12.5 and before. For versions 12.6 and later, data quality rules have replaced checks on datasets.
This article introduces:
The challenges of automation
The nature of metrics and checks
Why they’re crucial for automation
How to leverage them in Dataiku
Automation challenges#
The lifecycle of a data or machine learning project doesn’t end once a Flow is complete. To maintain workflows and improve models, you must continuously feed them new data. Automation allows you to do this more efficiently by reducing the amount of manual supervision.
However, as you automate workflows, you’re exposed to some risks, such as ingesting poor quality data without knowing it, which could affect output datasets, models, and dashboards.
For instance, a workflow could break as an extra column is added to an input dataset. Or, your model could stop capturing the pattern in the data and become obsolete.
While automation promises to save time, it also creates the need to implement key metrics and checks, so that projects don’t break and remains relevant.

Defining metrics#
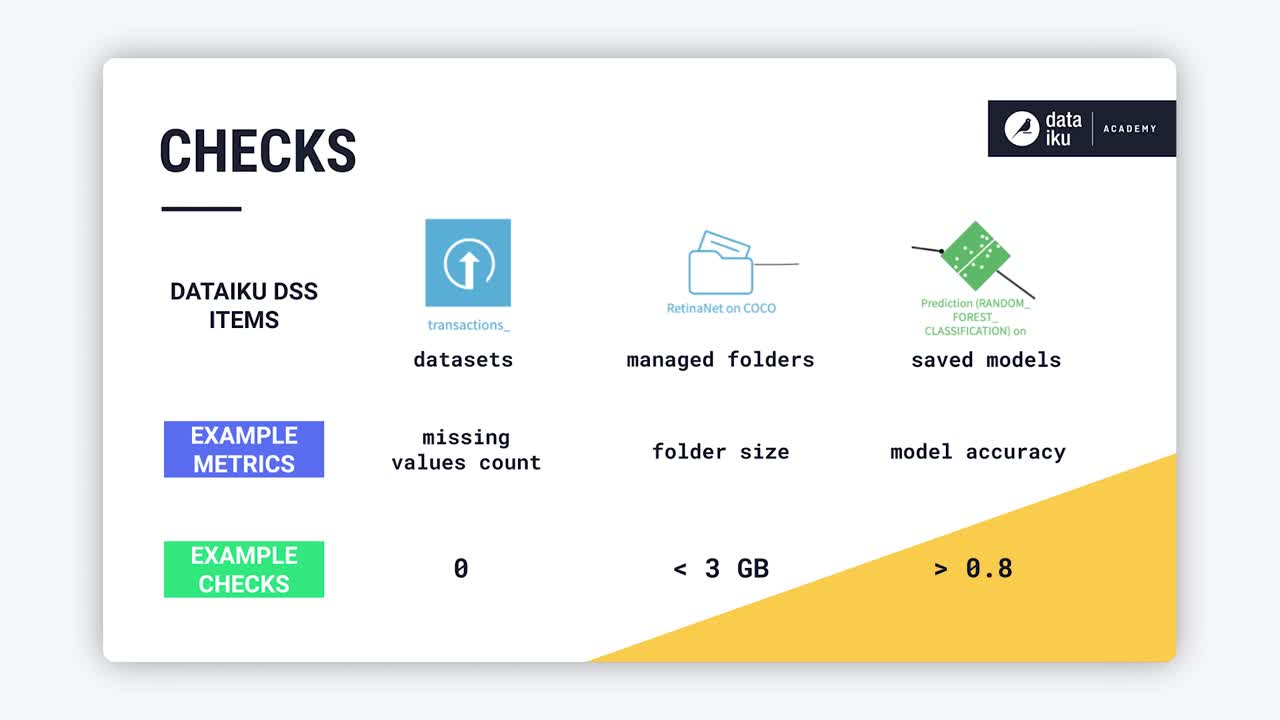
Metrics are metadata used to take measurements on the following Flow items:
Datasets
Managed folders
Saved models
They allow you to monitor the evolution of a Dataiku item. For example, you could compute:
The number of missing values of a column
The size of a folder
The accuracy of a model
You can also set metrics on partitioned objects and compute them on a per-partition basis.
Defining checks#
Metrics are often used in combination with checks to verify their evolution.
For instance, you could check that:
There are no missing values for a given column.
The size of a folder doesn’t exceed 3GB.
The model accuracy doesn’t fall below 0.8.

Checks return one of the four following status updates after each run:
EMPTY if the metric’s value hasn’t been computed.
ERROR if the check condition hasn’t been respected.
WARNING if the check fails a soft condition but not a hard one.
OK if the check shouldn’t raise any concern.

You can set metrics and checks to be computed automatically after a rebuild, if desired.

You can trigger some actions depending on the outcome of checks. For example:
Retraining a model.
Sending a report.
Refreshing a dashboard, etc.

You can achieve this through scenarios.
Viewing metrics#
Now, see in practice how you can leverage metrics and checks in Dataiku. You’ll work on a dataset containing credit card transaction data.
You can access metrics and checks from the Status tab on a dataset, a managed folder, or a machine learning model.
The Status tab presents the default “Last Value” view of the metrics, which is a “tile view” displaying the latest value of each selected metric.

Clicking on the value of a metric will bring up a modal box with the history of this value.
You can also switch to other views of the metrics, such as the History view, which is a “ribbon” view displaying the history of all selected metrics.
For partitioned datasets, you’ll have more views to visualize metrics on a per-partition basis.
Since there can be many available metrics on an item, you must select the metrics you want to add to the displayed screen tiles on the Metrics page.
Adding metrics#
Within the Status tab of a dataset, there is an “Edit” subtab. From here, you can customize and extend the list of available metrics using:
Built-in probes
Custom code
Plugins
For now, we’ll focus on built-in probes. We will explore building probes with custom code or via plugins in another lesson.
A probe is a component that can compute several metrics on an item. Each probe has a configuration that indicates what the probe should compute.
For instance, the Column statistics probe can compute the minimum and maximum value of a column, such as purchase_amount.

In addition to column statistics, you can also find probes to compute the most frequent values of a specific column, the percentiles of a specific column, or statistics about data validity.
Data validity metrics are to be used in association with user-defined meanings which complement the description of the column and optionally provide a list or a pattern for the valid values.
You can also use a cell value probe to retrieve the values of one or more cells from the dataset as metrics, with historization. This allows you to filter the rows on specific conditions and display dataset values for selected columns.
You can define more customized metrics using Python code or via a plugin. A later lesson will detail the use of these custom metrics.
You can also edit the engine computation settings used to compute the metrics.
Adding checks#
Now that you’ve defined a metric, you can set checks to validate that the latest computed value doesn’t raise any concerns.
The Checks page is similar to the Metrics page. You can choose between different views of the checks status, and select which checks to display.

Similar to metrics, you can built checks from the Edit tab, from built-in visual probes, custom code, or plugins.
In this case, you want to check that the minimum value of purchase_amount is positive, as this was the initial assumption. You can do this with a numerical range check on the metric Min of purchase_amount.

You can set a soft minimum to return a warning if not respected or a hard minimum to trigger an error.
As for a metric, you can set the option to automatically run the check after each rebuild, if desired.
You can now save your settings and test the check. You can see that it’s working, but it returns an error. We had incorrectly assumed that the purchase_amount value is always positive, while in fact the minimum of purchase_amount is negative.
This could mean that we’ve unconsciously ingested invalid data, or, in our case, simply that we’ve made an incorrect assumption about the nature of the data. Either way, the failed check brings attention to a potential inconsistency in our data.
Metrics & checks on other objects#
Although not covered in this article, you can use metrics and checks on managed folders and saved models. The nature of metrics and checks in those use cases will differ from the one you’ve seen with datasets. However, the rationale remains similar.

Next steps#
To learn more about metrics and checks, including through hands-on exercises, please register for the free Academy course on this subject found in the Advanced Designer learning path.
You can also learn more about metrics and checks in the reference documentation.