
Concept | Window recipe#
Watch the video or read the summary below.

The Window recipe allows for computing grouped aggregations over a specific window frame for cumulative sums, moving averages, ranks, and more.
Use case#
The Group recipe allows you to calculate grouped aggregations. For example, given a dataset of credit card transactions, you can compute the mean of a distinct customer’s purchases. When doing so:
The resulting dataset has exactly one row per distinct customer.
All values belonging to a distinct customer go into the mean calculation.
The schema of the output includes only the group key columns and requested aggregations.
For many kinds of analytical questions, these are important limitations. Often you need to compute aggregations relative to other rows within a group. For example, instead of one mean computed over all purchases from a customer, you want the mean to only consider a customer’s last five purchases.
The Group recipe is unable to answer these kinds of questions. For grouped aggregations that must reference relative rows, you need a window function. The table below documents many of the common situations where a window function is necessary:
Use case |
Examples |
|---|---|
Cumulative metrics |
Running account balance; year-to-date sales |
Moving statistics |
7-day moving average; rolling maximum or minimum values |
Comparing to relative rows |
Change in purchase amount from the previous transaction; days since the previous transaction |
Ranking |
Largest transaction per card; top 3 customers by spend |
Percentiles and relative standing |
Top 10% customers; quartile assignment |
First, last, and nth values |
First purchase amount; most recent balance |
Detecting changes in state |
Customer changed address; product price changed |
Gap analysis |
Days since previous purchase; time between website visits |
Share-of-total calculations |
Transaction as a percentage of cardholder spend; product as a percentage of category sales |
To give one concrete example:
The dataset on the left is a simplified dataset of distinct transactions.
The dataset on the right computes the cumulative sum of purchases, for a customer, at a particular date.
date |
customer |
amount |
|---|---|---|
2020-07-12 |
Carol |
2 |
2020-07-10 |
Carol |
3 |
2020-01-25 |
Alice |
1 |
2020-01-05 |
Bob |
4 |
2020-07-21 |
Alice |
6 |
2020-10-01 |
Carol |
5 |
date |
customer |
amount |
amount_sum |
|---|---|---|---|
2020-01-25 |
Alice |
1 |
1 |
2020-07-21 |
Alice |
6 |
7 |
2020-01-05 |
Bob |
4 |
4 |
2020-07-10 |
Carol |
3 |
3 |
2020-07-12 |
Carol |
2 |
5 |
2020-10-01 |
Carol |
5 |
10 |
Take a moment to dissect the output:
Unlike the Group recipe output, the schema of the input dataset remains — plus the requested aggregation.
Instead of the number of rows reduced to the number of distinct groups, the number of rows in the output remains the same as the input.
Within each group (the distinct customer), the rows are in ascending date order.
The amount_sum column includes that row’s current row — plus all previous rows for that customer. For example, the amount_sum value in the last row is
10: the sum of Carol’s previous purchases (3,2) and the current row’s purchase (5).
Windowed aggregations with other technologies#
Depending on your previous experience with data tools, you may have already computed grouped aggregations — specific to a window.
Technology |
Tool/Function |
|---|---|
Excel |
Running totals with |
SQL |
|
Python (pandas) |
|
R (tidyverse) |
|
You could perform the same SQL, Python, or R operation with a code recipe. However, in Dataiku, you’ll often want to reach for the visual Window recipe for this kind of data transformation.
Window recipe configuration#
Configuring the Group recipe had two important components: the group key and the requested aggregations. The Window recipe builds on top of these, but allows for more complex grouping properties.
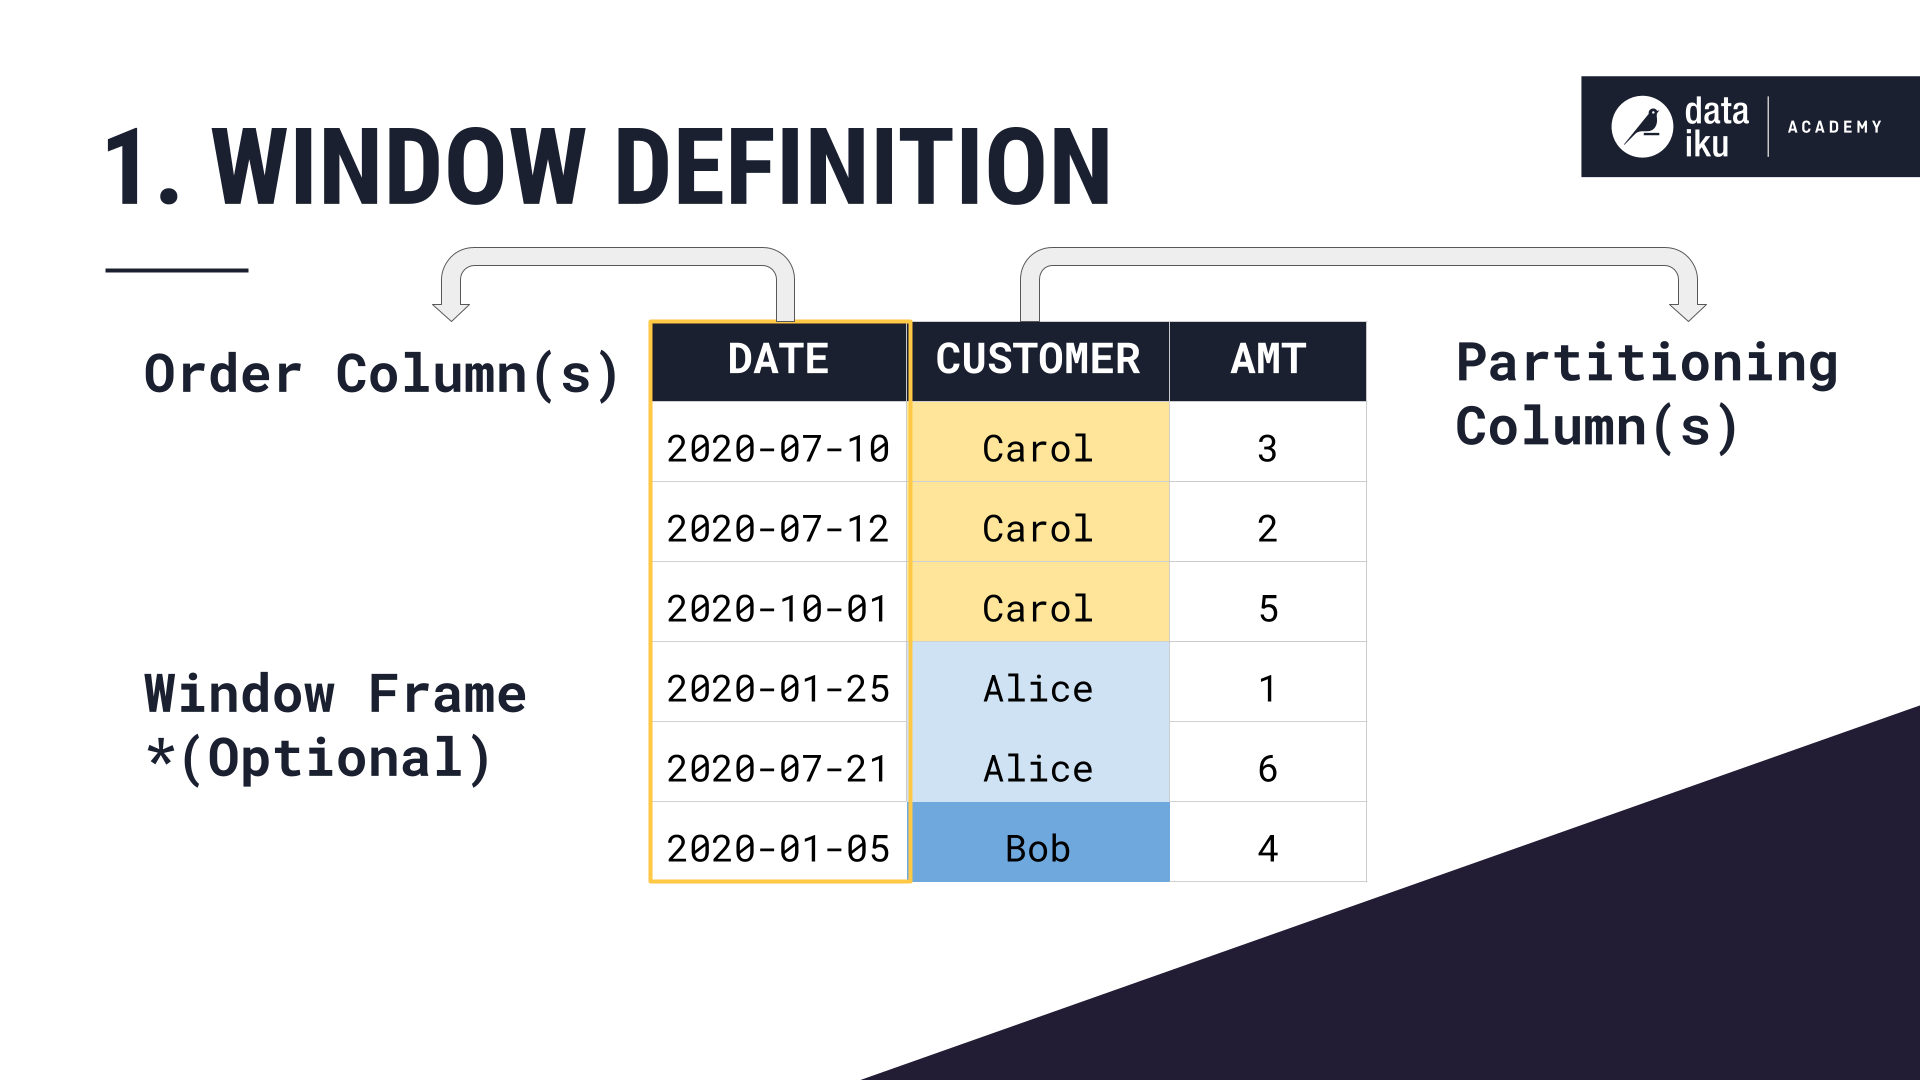
Window definition step#
The first step to configuring the Window recipe is defining all aspects of the window frame.
Field |
Defines |
Example |
|---|---|---|
Partitioning Columns (1) |
Distinct subsets (group keys) |
customer |
Order Columns (2) |
The ordering principle within the window frame |
date (ascending) |
Window Frame (3) |
The rows to include in computations |
All amount values up to and including the current row |
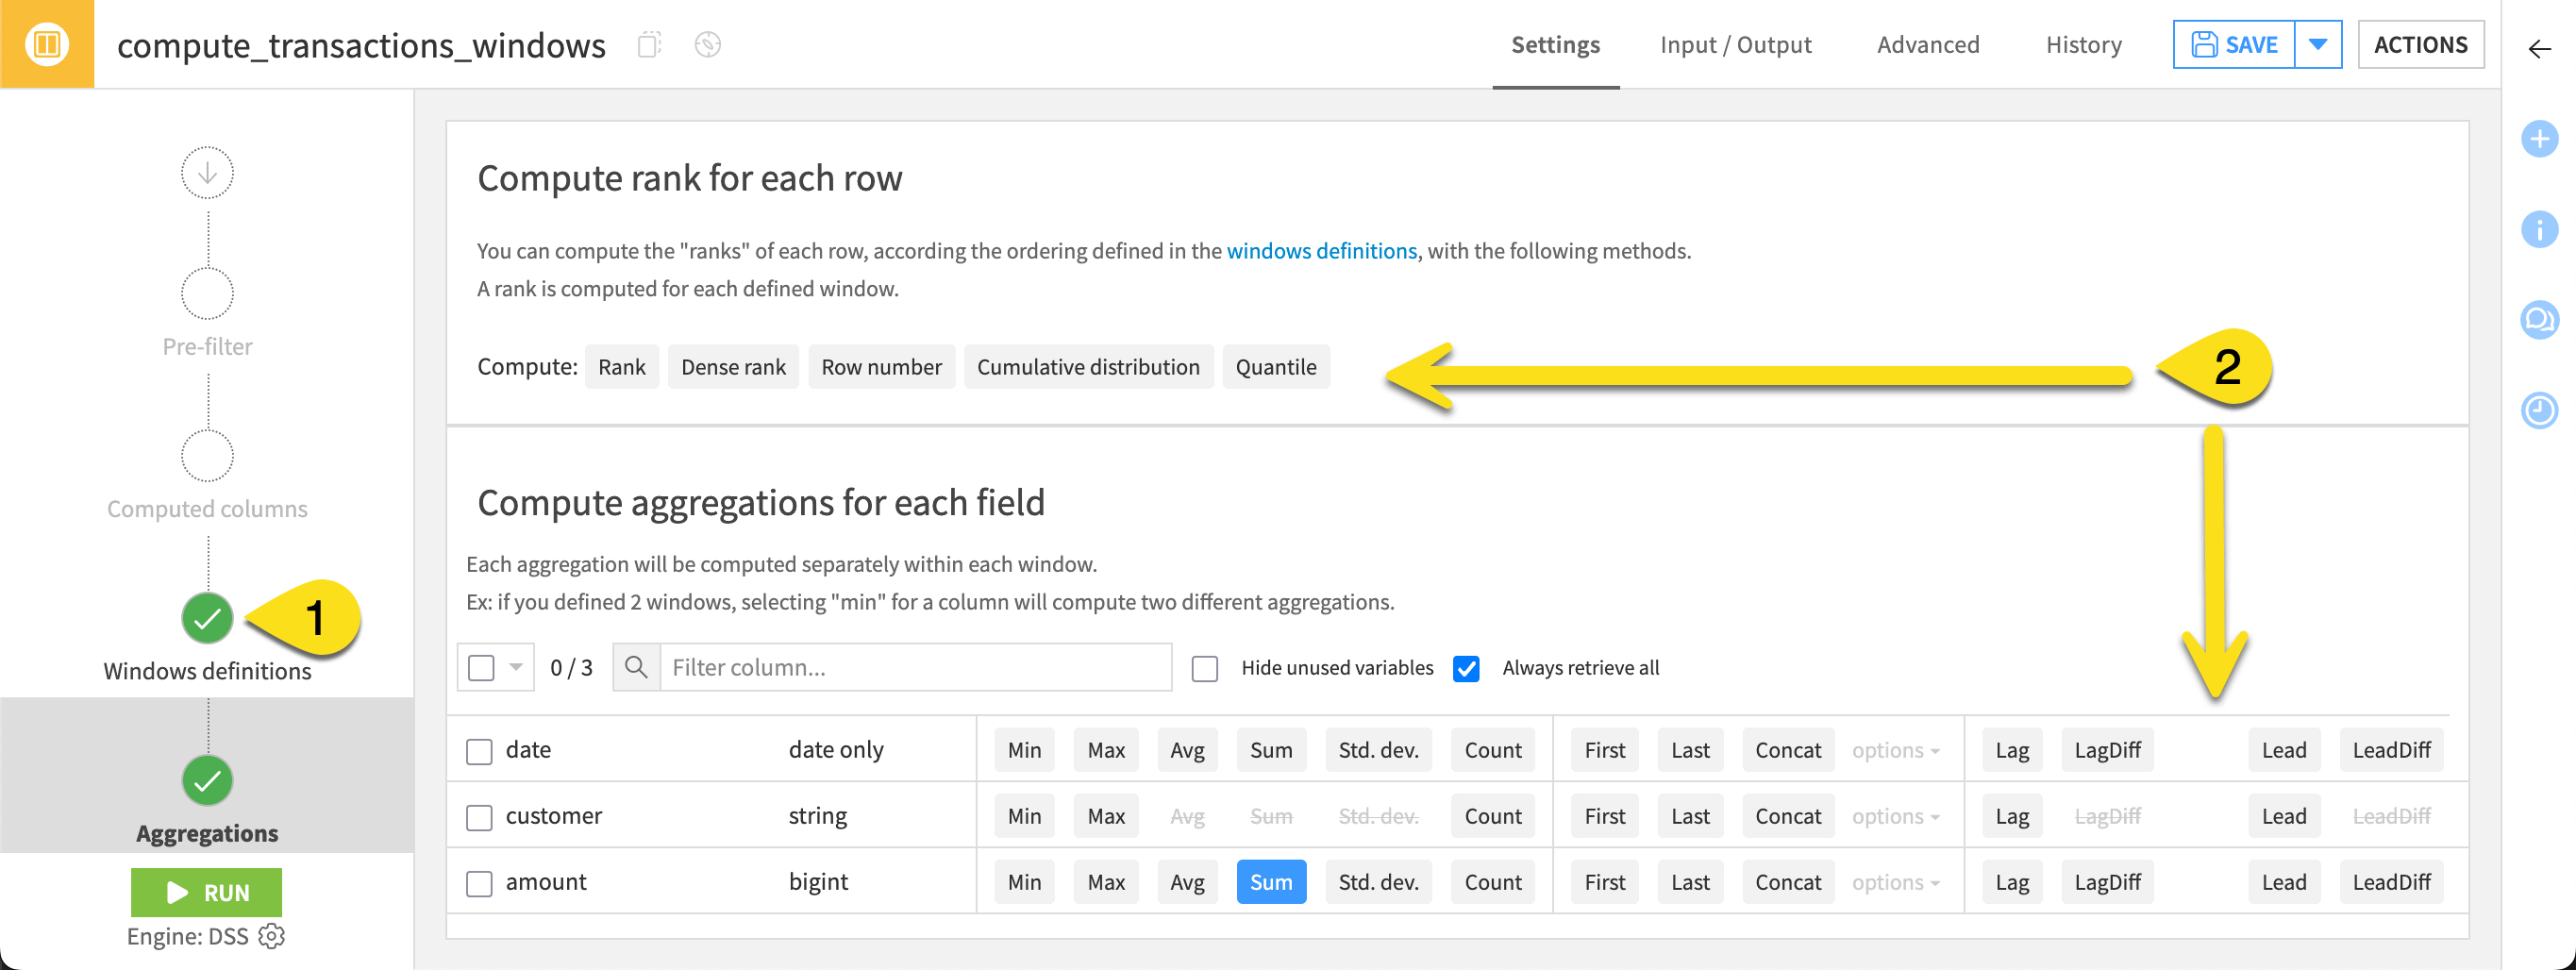
Aggregation step#
Similar to the Group recipe, the second step is defining the aggregations. Many will be the same (minimum, maximum, average, sum). However, two aspects are new:
The requested aggregations are computed with respect to the window frame defined on the Window definition step.
The Window recipe also offers additional aggregations for lag and lead, as well as a variety of ranking functions.
Next steps#
Continue learning about this recipe by working through the Tutorial | Window recipe article.
Tip
You can find this content (and more) by registering for the Dataiku Academy course, Visual Recipes. When ready, challenge yourself to earn a certification!