
Tutorial | Clustering (unsupervised) models with visual ML#
Get started#
Clustering (Unsupervised ML) can be an effective technique to uncover patters in your data. Unlike in supervised machine learning, with this technique, there is no target variable to predict.
Objectives#
In this tutorial, you will:
Use an unsupervised machine learning approach for segmentation.
Deploy a clustering model from the Lab to the Flow to label clusters.
Prerequisites#
Dataiku 12.0 or later.
An Advanced Analytics Designer or Full Designer user profile.
Reverse geocoding / Admin maps plugin (included by default on Dataiku Cloud).
Knowledge of the recommended courses in the Core Designer and ML Practitioner learning paths is encouraged.
Create the project#
From the Dataiku Design homepage, click + New Project.
Select Learning projects.
Search for and select Clustering.
If needed, change the folder into which the project will be installed, and click Create.
From the project homepage, click Go to Flow (or type
g+f).
Note
You can also download the starter project from this website and import it as a ZIP file.
You’ll next want to build the Flow.
Click Flow Actions at the bottom right of the Flow.
Click Build all.
Keep the default settings and click Build.
Use case summary#
The starter project includes a small data pipeline of Dataiku web logs. For two months, this data contains information about website page views.
After the Prepare and Group recipes, each row of LogsDataiku_prepared_by_visitor_id contains information for one unique visitor, such as their IP address, their number of visits during the two month period, the specific pages they visited, and their device (browser vs. mobile).
Tip
In addition to reviewing the Prepare and Group recipes, see the charts on LogsDataiku_prepared to dive deeper into the data used here.
Train a clustering model#
Let’s use this web log data to cluster visitors into certain categories. Once we’ve segmented visitors into categories, we may be able to share this information with colleagues in departments like marketing or sales to be more targeted in their outreach efforts.
Unsupervised algorithms for clustering#
Before training any models, it’s worth reviewing unsupervised learning in general.
A clustering task consists of creating groups of objects that have high intraclass similarity and low interclass similarity. In other words, objects are similar to other objects in the same cluster, but dissimilar to objects in other clusters.
One usage for clustering algorithms is anomaly detection. This task can be seen as finding two classes in your data, separating the bulk of your observations from outliers. These will be identified as abnormal events because they don’t resemble the usual data.
In that case, the algorithm will separate your data in two unbalanced classes. Most of the data is clustered together as usual events, while anomalies are detected as outliers.
Unsupervised algorithms can also be used when you want to create subgroups within your data. You can train several clustering algorithms by varying the number of clusters, and see how many subgroups the algorithm can distinguish. This is what we’ll do in this tutorial!
Important
The most important thing to remember about unsupervised machine learning algorithms is that they can only be as good as the data they’re provided. The algorithm will do its best to separate clusters based on the features it’s given. If your features are varied in terms of real-life meaning or practical significance, you will get heterogeneous results.
Create an AutoML clustering task#
Given that the feature engineering has already been done in the Prepare and Group recipes, the next step is to define the basic parameters of the machine learning task at hand.
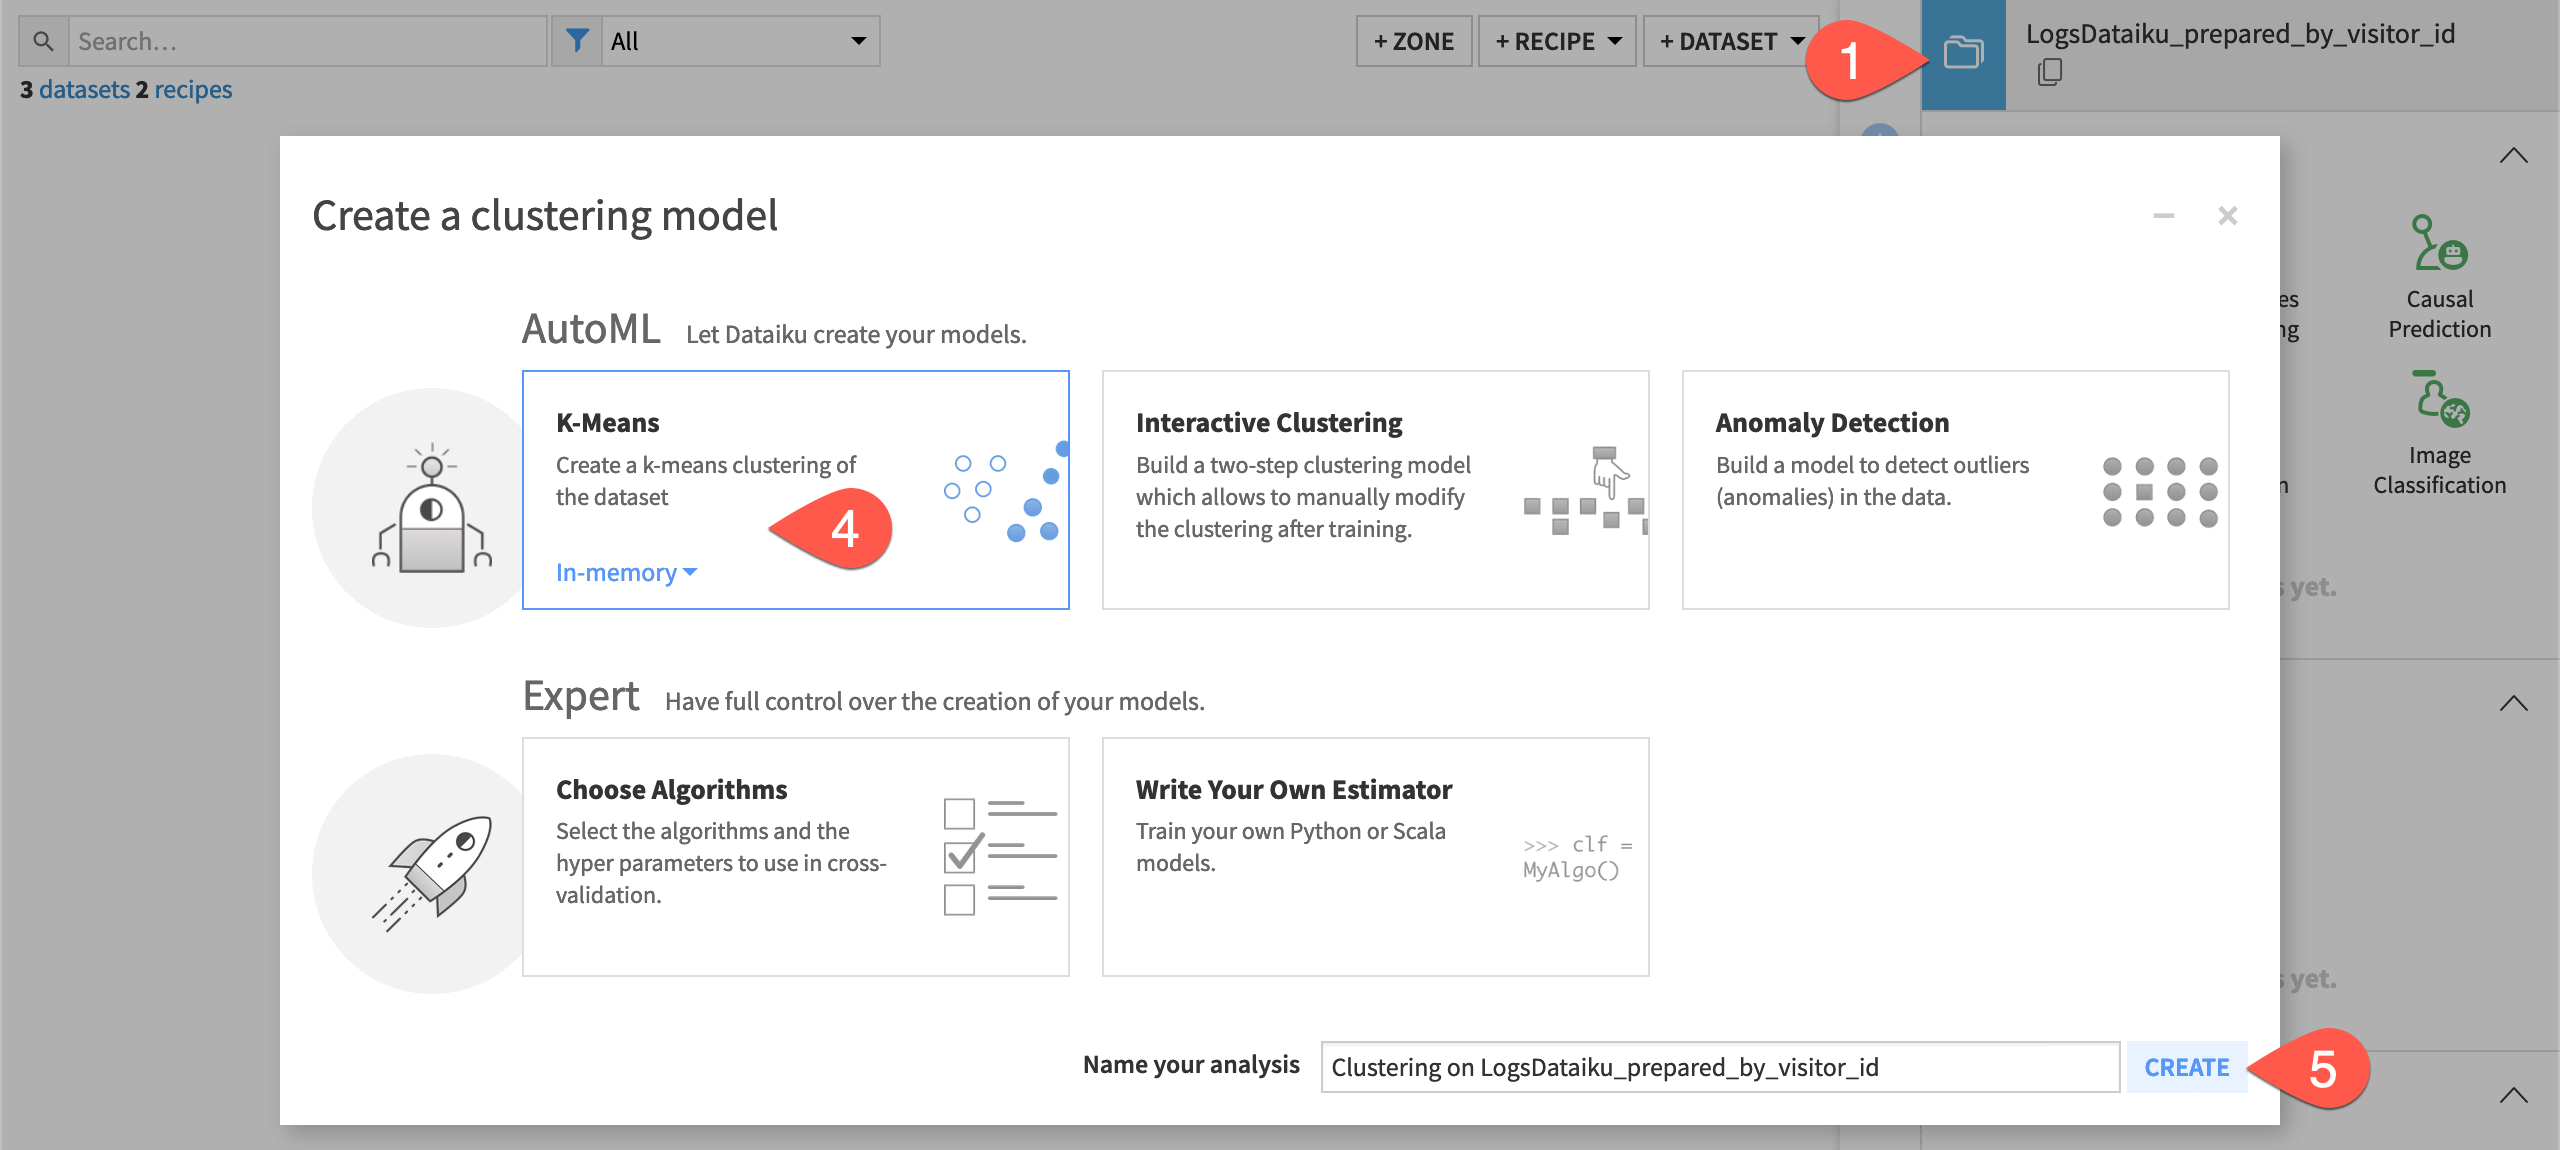
Select the LogsDataiku_prepared_by_visitor_id dataset.
Navigate to the Lab (
 ) tab of the right side panel.
Among the menu of visual ML tasks, select AutoML Clustering.
Leave the default K-Means selection.
Click Create.
Click Train to start the first model training session.
Review the model’s design#
Before looking at the initial results, let’s review the design of the first training session.
Compared to an AutoML prediction task, you’ll find many similar panels such as debugging (for ML Diagnostics), features handling, and runtime environment. The algorithms panel should also be familiar — only with a different set of algorithms.
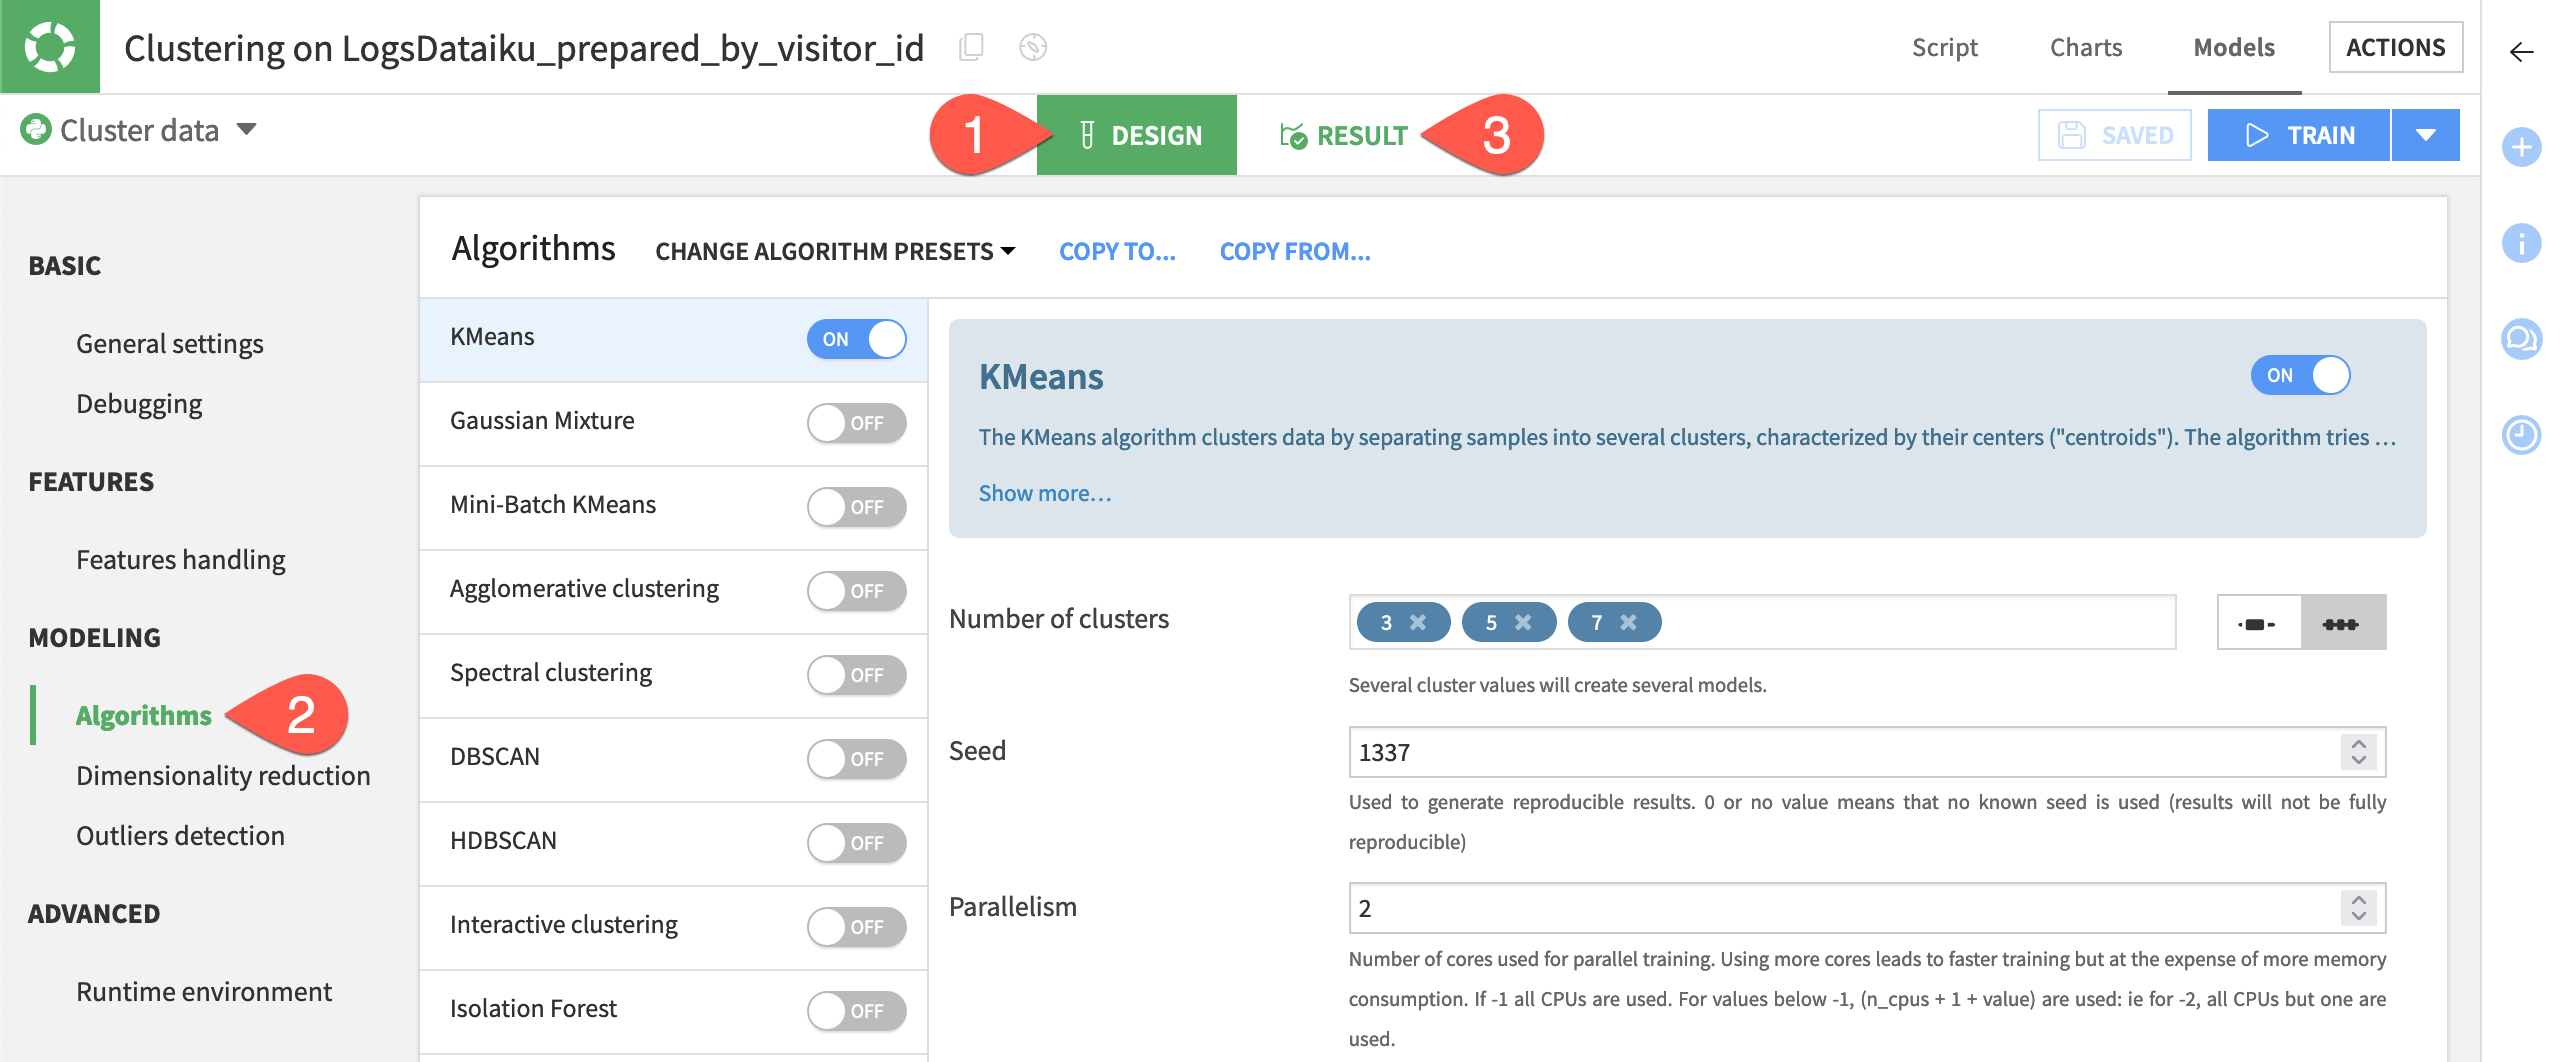
From the Result tab of the modeling task, click Design.
Review some of the model design panels, including Algorithms.
When ready, return to the Result tab.
Interpret cluster results#
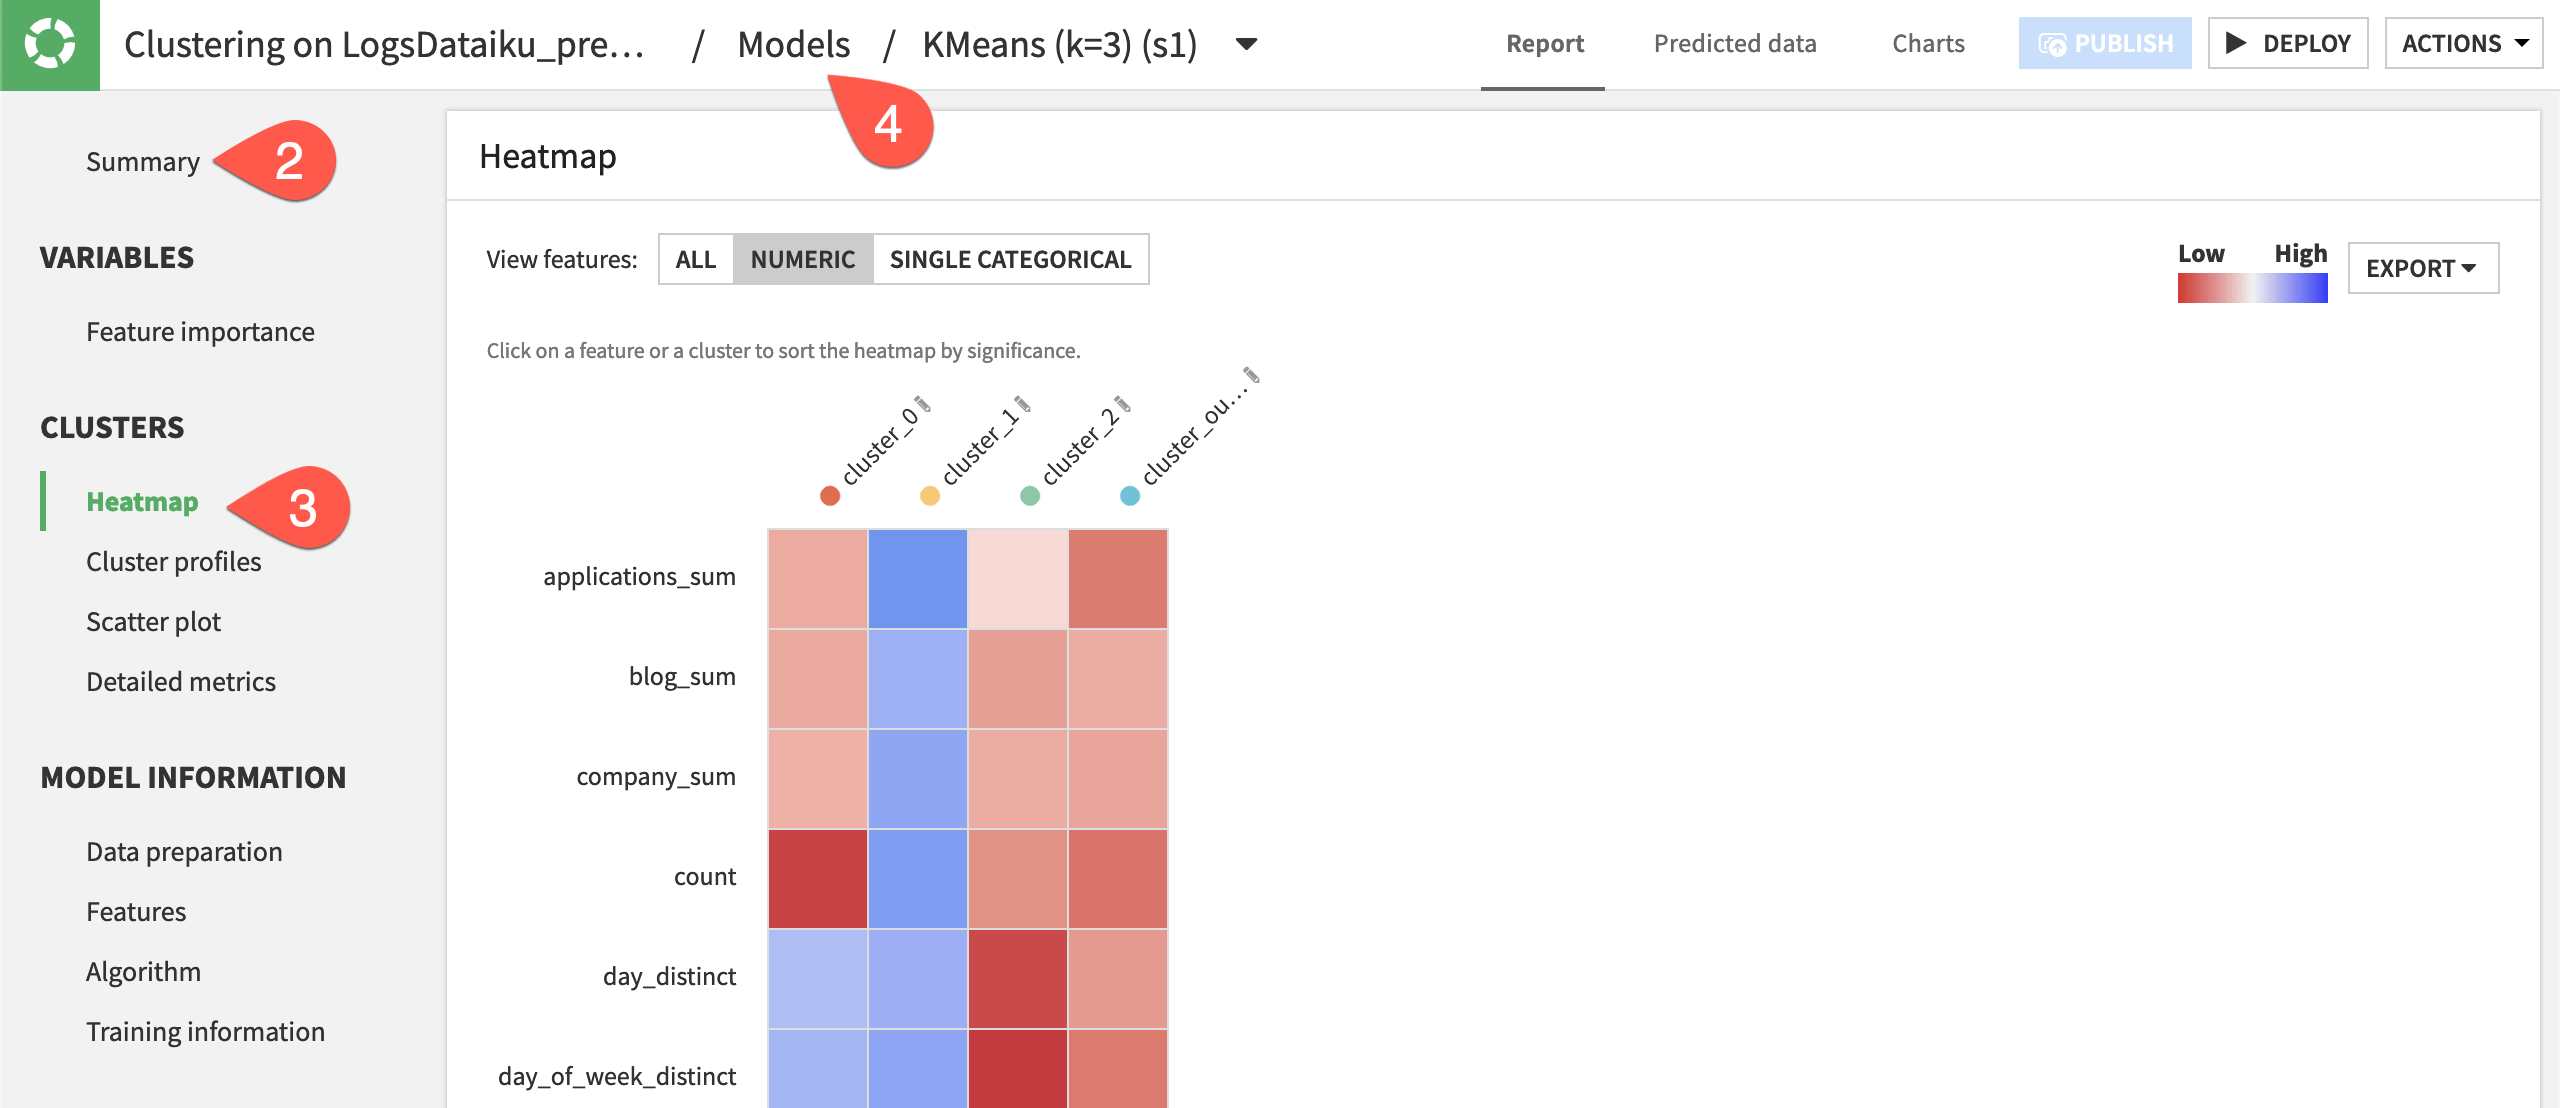
Using the K-means algorithm, the modeling task separated the data into 3, 5, and 7 clusters. Knowing the “best” number of clusters for your use case isn’t entirely obvious.
According to the silhouette metric, the best result was when k=3. A silhouette score closer to 1 indicates the sample is far away from the neighboring clusters.
Open the model report for when
k=3.Read the observations of the clusters in the Summary panel.
Explore the Heatmap and Cluster profiles panels.
When ready, return to the Result tab of the modeling task by clicking Models.
Name clusters#
Having only three clusters may not be sufficient for the level of segmentation required for our use case. Nearly 80% of visitors were lumped in a category we might describe as infrequent visitors. Although this high-level segmentation could be valuable, let’s explore the results for a model with more clusters.
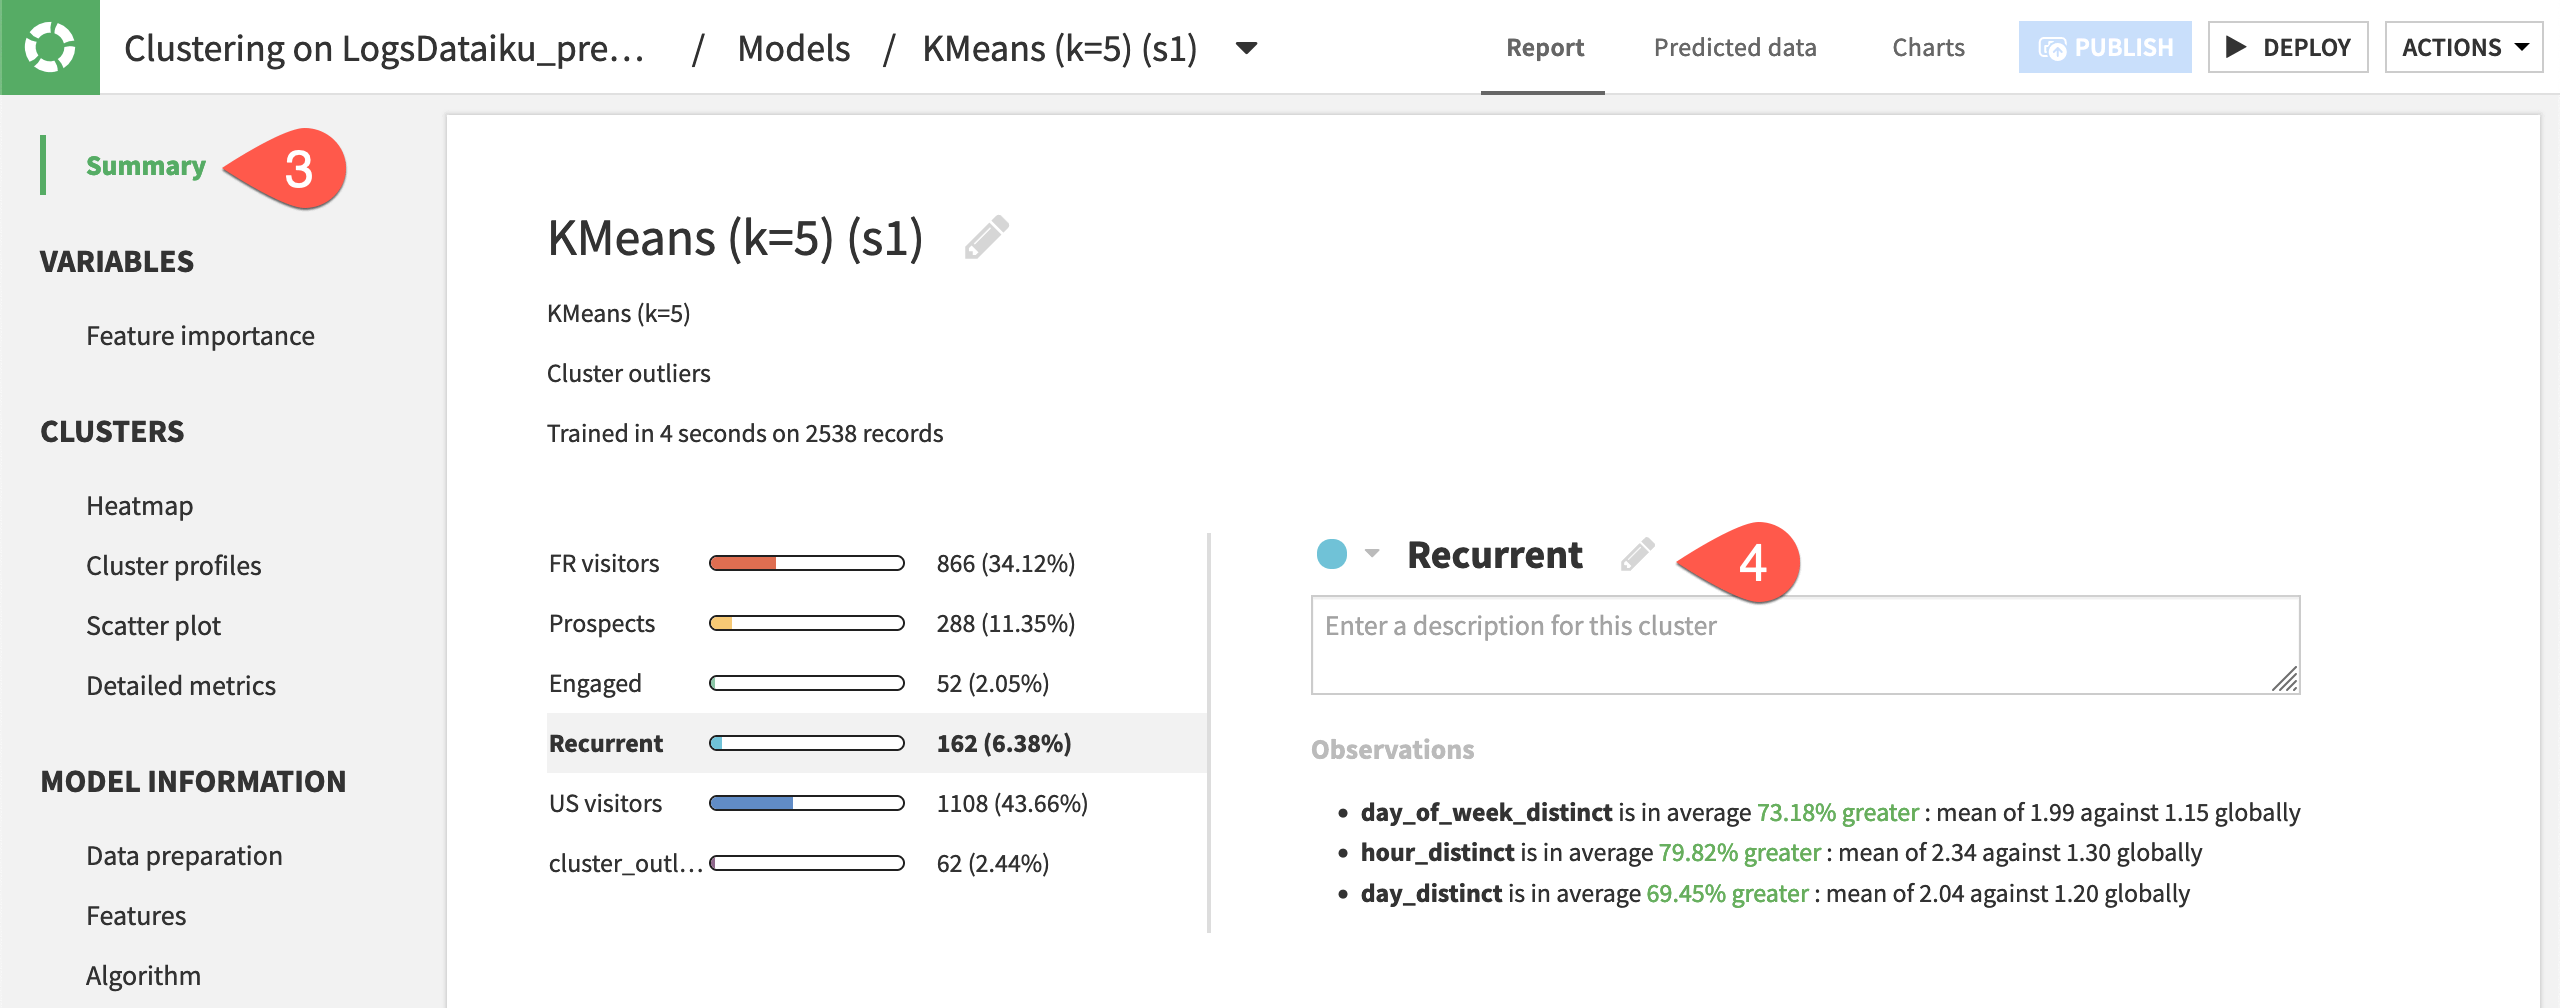
Open the model report for when
k=5.Review the summary, heatmap, and cluster profiles.
Return to the Summary panel.
For each of the numbered clusters, click the pencil icon to give a descriptive name. The table below has suggestions, but your results may differ.
Cluster |
New Name |
Key Observation |
|---|---|---|
cluster_0 |
FR visitors |
100% of the cluster has France for ip_address_country_first. |
cluster_1 |
Prospects |
products_sum is in average 56.12% greater. |
cluster_2 |
Engaged |
count is in average 377% greater. |
cluster_3 |
Recurrent |
*_distinct is in average X% greater. |
cluster_4 |
US visitors |
33.57% of the cluster has United States for ip_address_country_first. |
Deploy and apply a clustering model#
Although the model with three clusters may have a higher silhouette metric, one might argue the model with five clusters better supports a concrete business action. We’ll be able to deliver more targeted website visitor segments to various company departments.
Let’s deploy this model to the Flow, and use it to apply the cluster labels to the data.
Deploy a model from the Lab to the Flow#
We can deploy the model in two ways. Similar to what you’ve likely seen with a prediction model, we’ll deploy the model with a training recipe.
From the model report of the
k=5model, click Deploy.Under Deploy a retrainable model to the Flow, click Create.
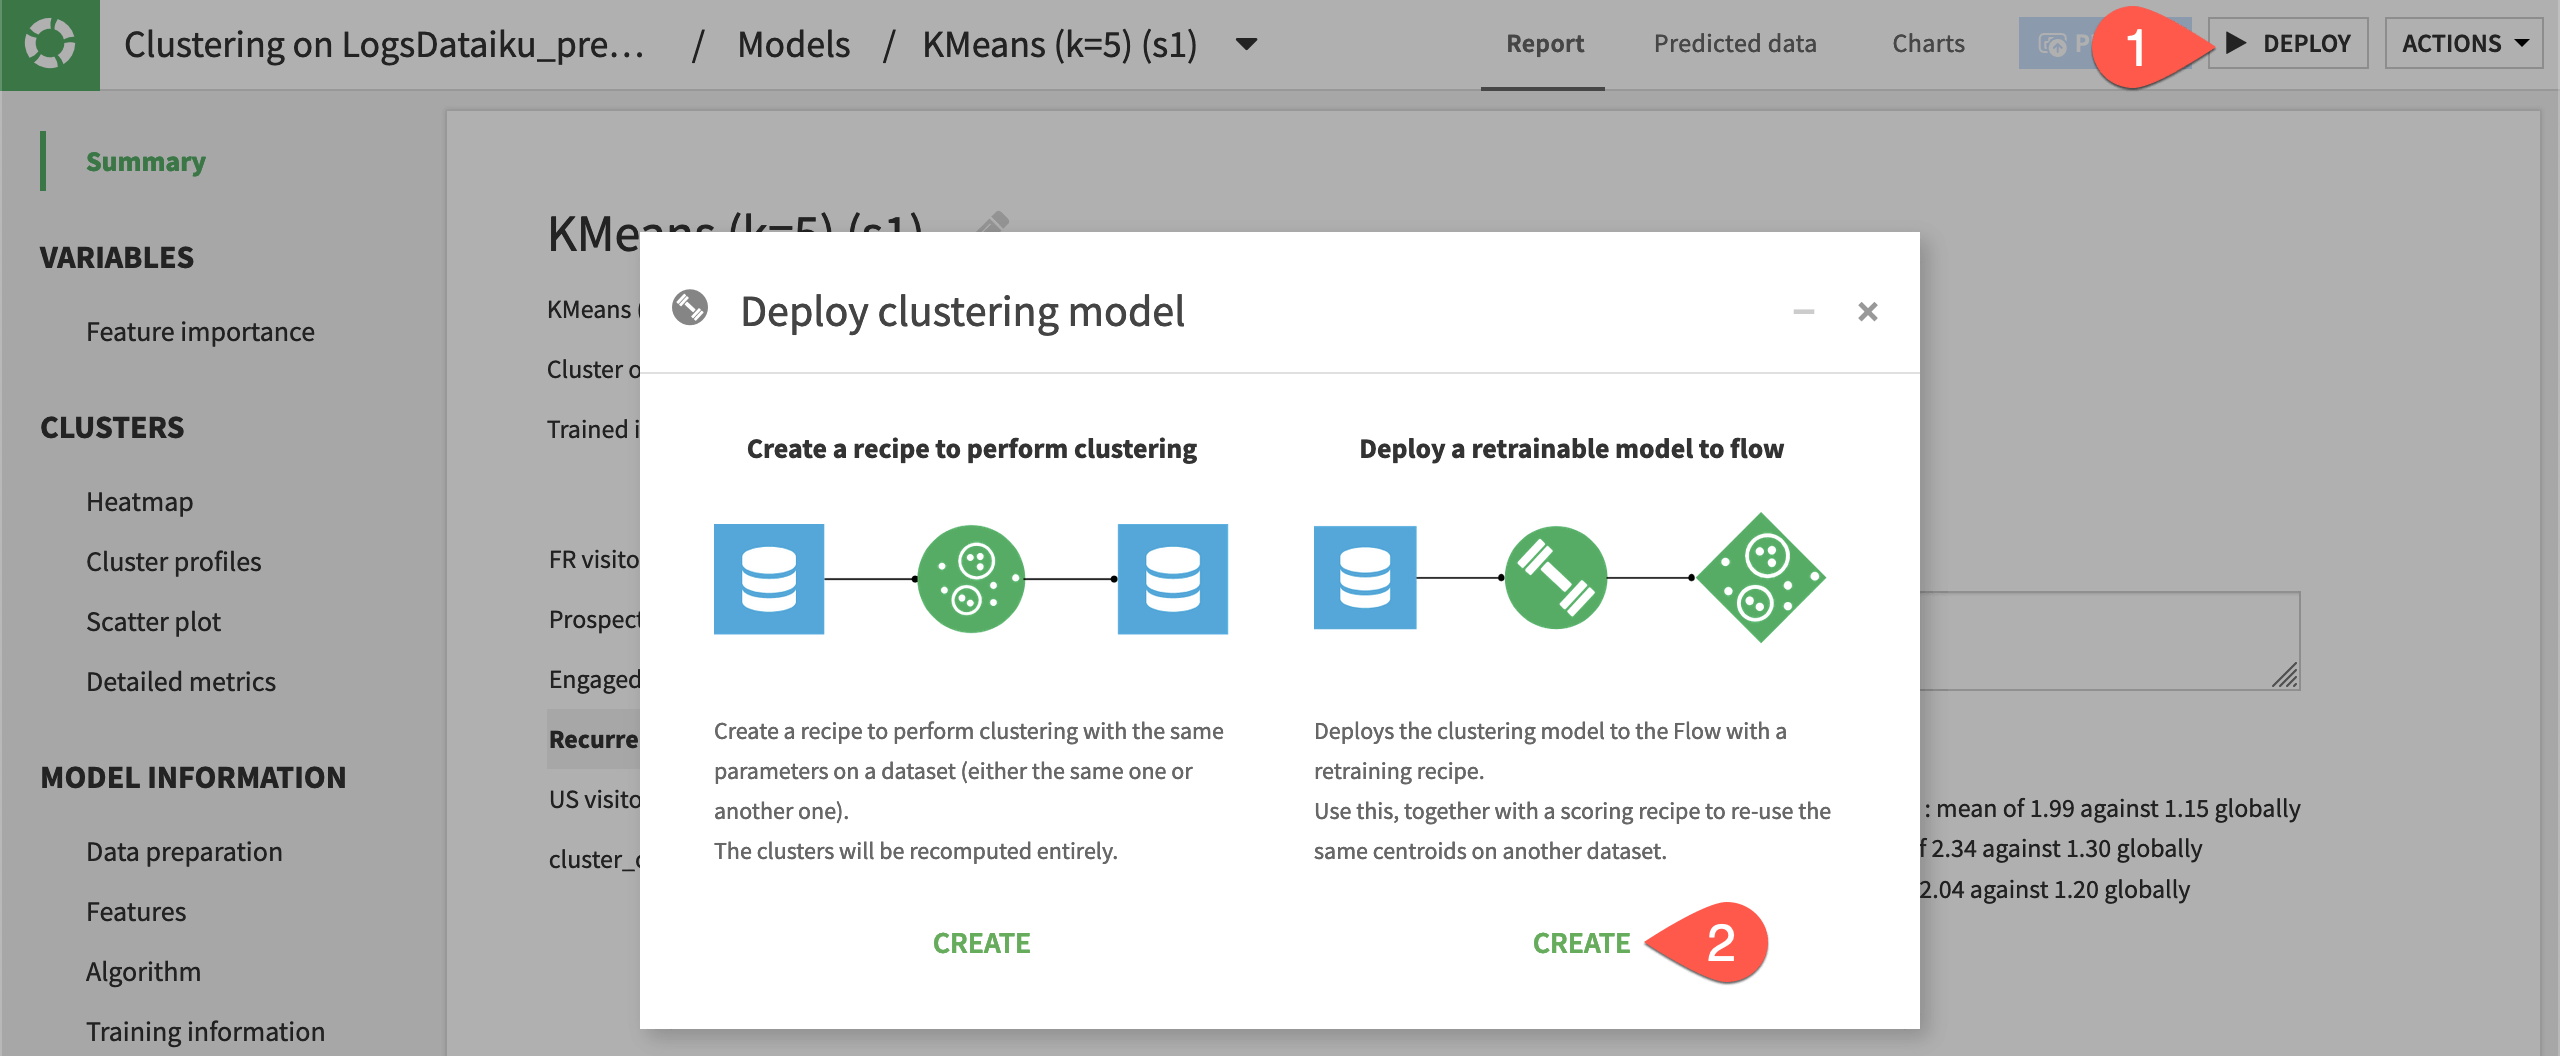
Click Create to confirm.
Apply the model to the data#
With a prediction model, we’d score data unseen by the model to generate predictions. With a clustering model however, we actually want to supply the training data to the model to add the cluster labels.
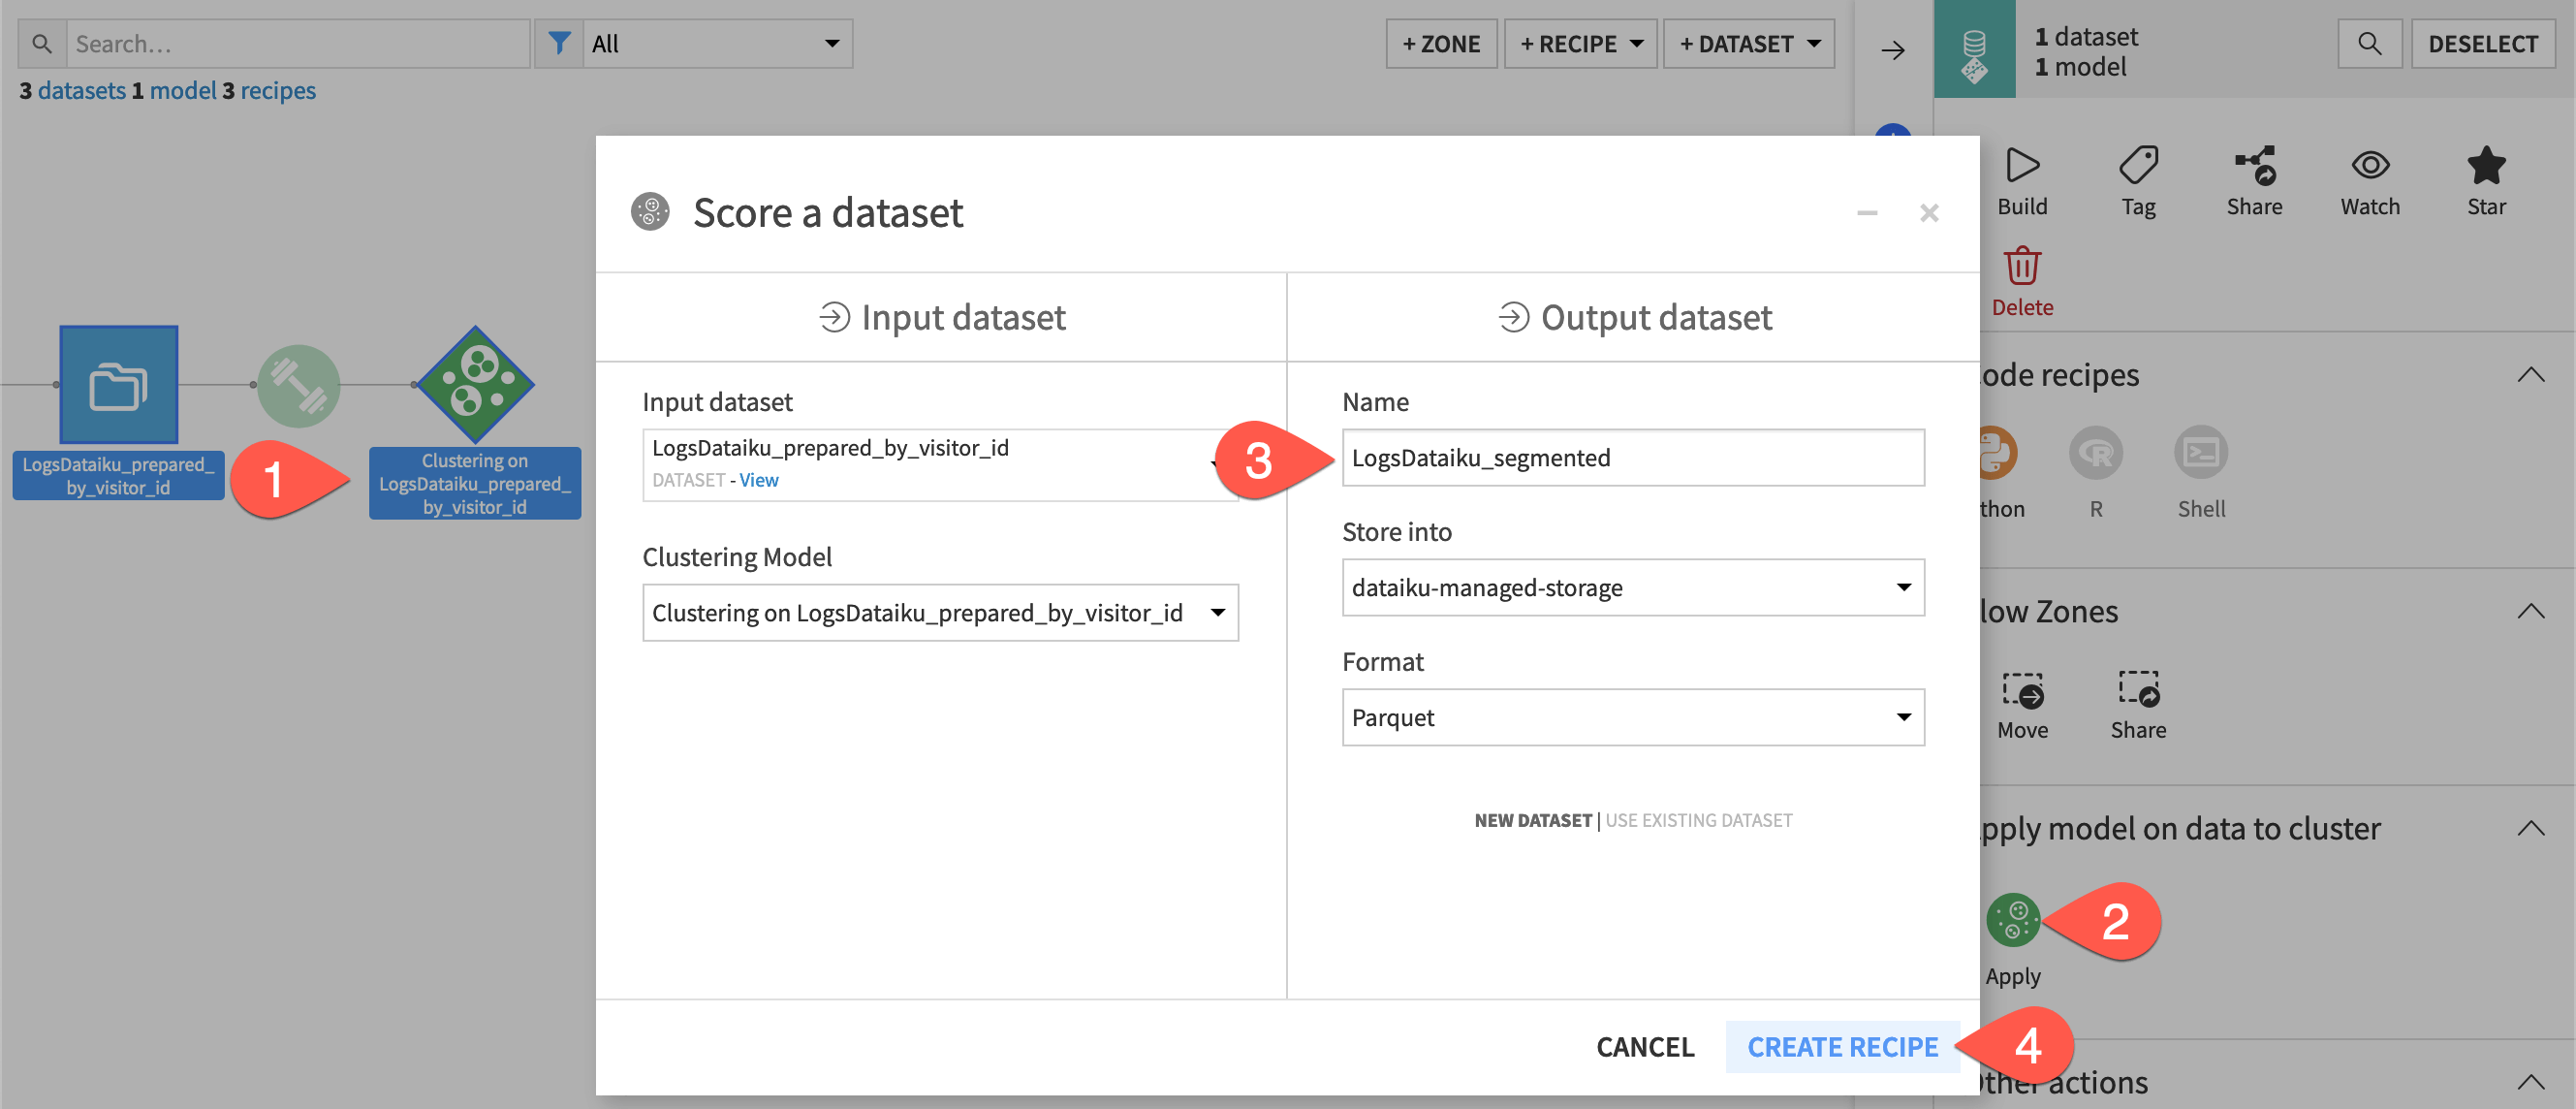
From the Flow, select the LogsDataiku_prepared_by_visitor_id dataset and the saved model.
From the Actions panel, select the Apply recipe.
Name the output dataset
LogsDataiku_segmented.Click Create Recipe.
Click Run.
Inspect the clustered output#
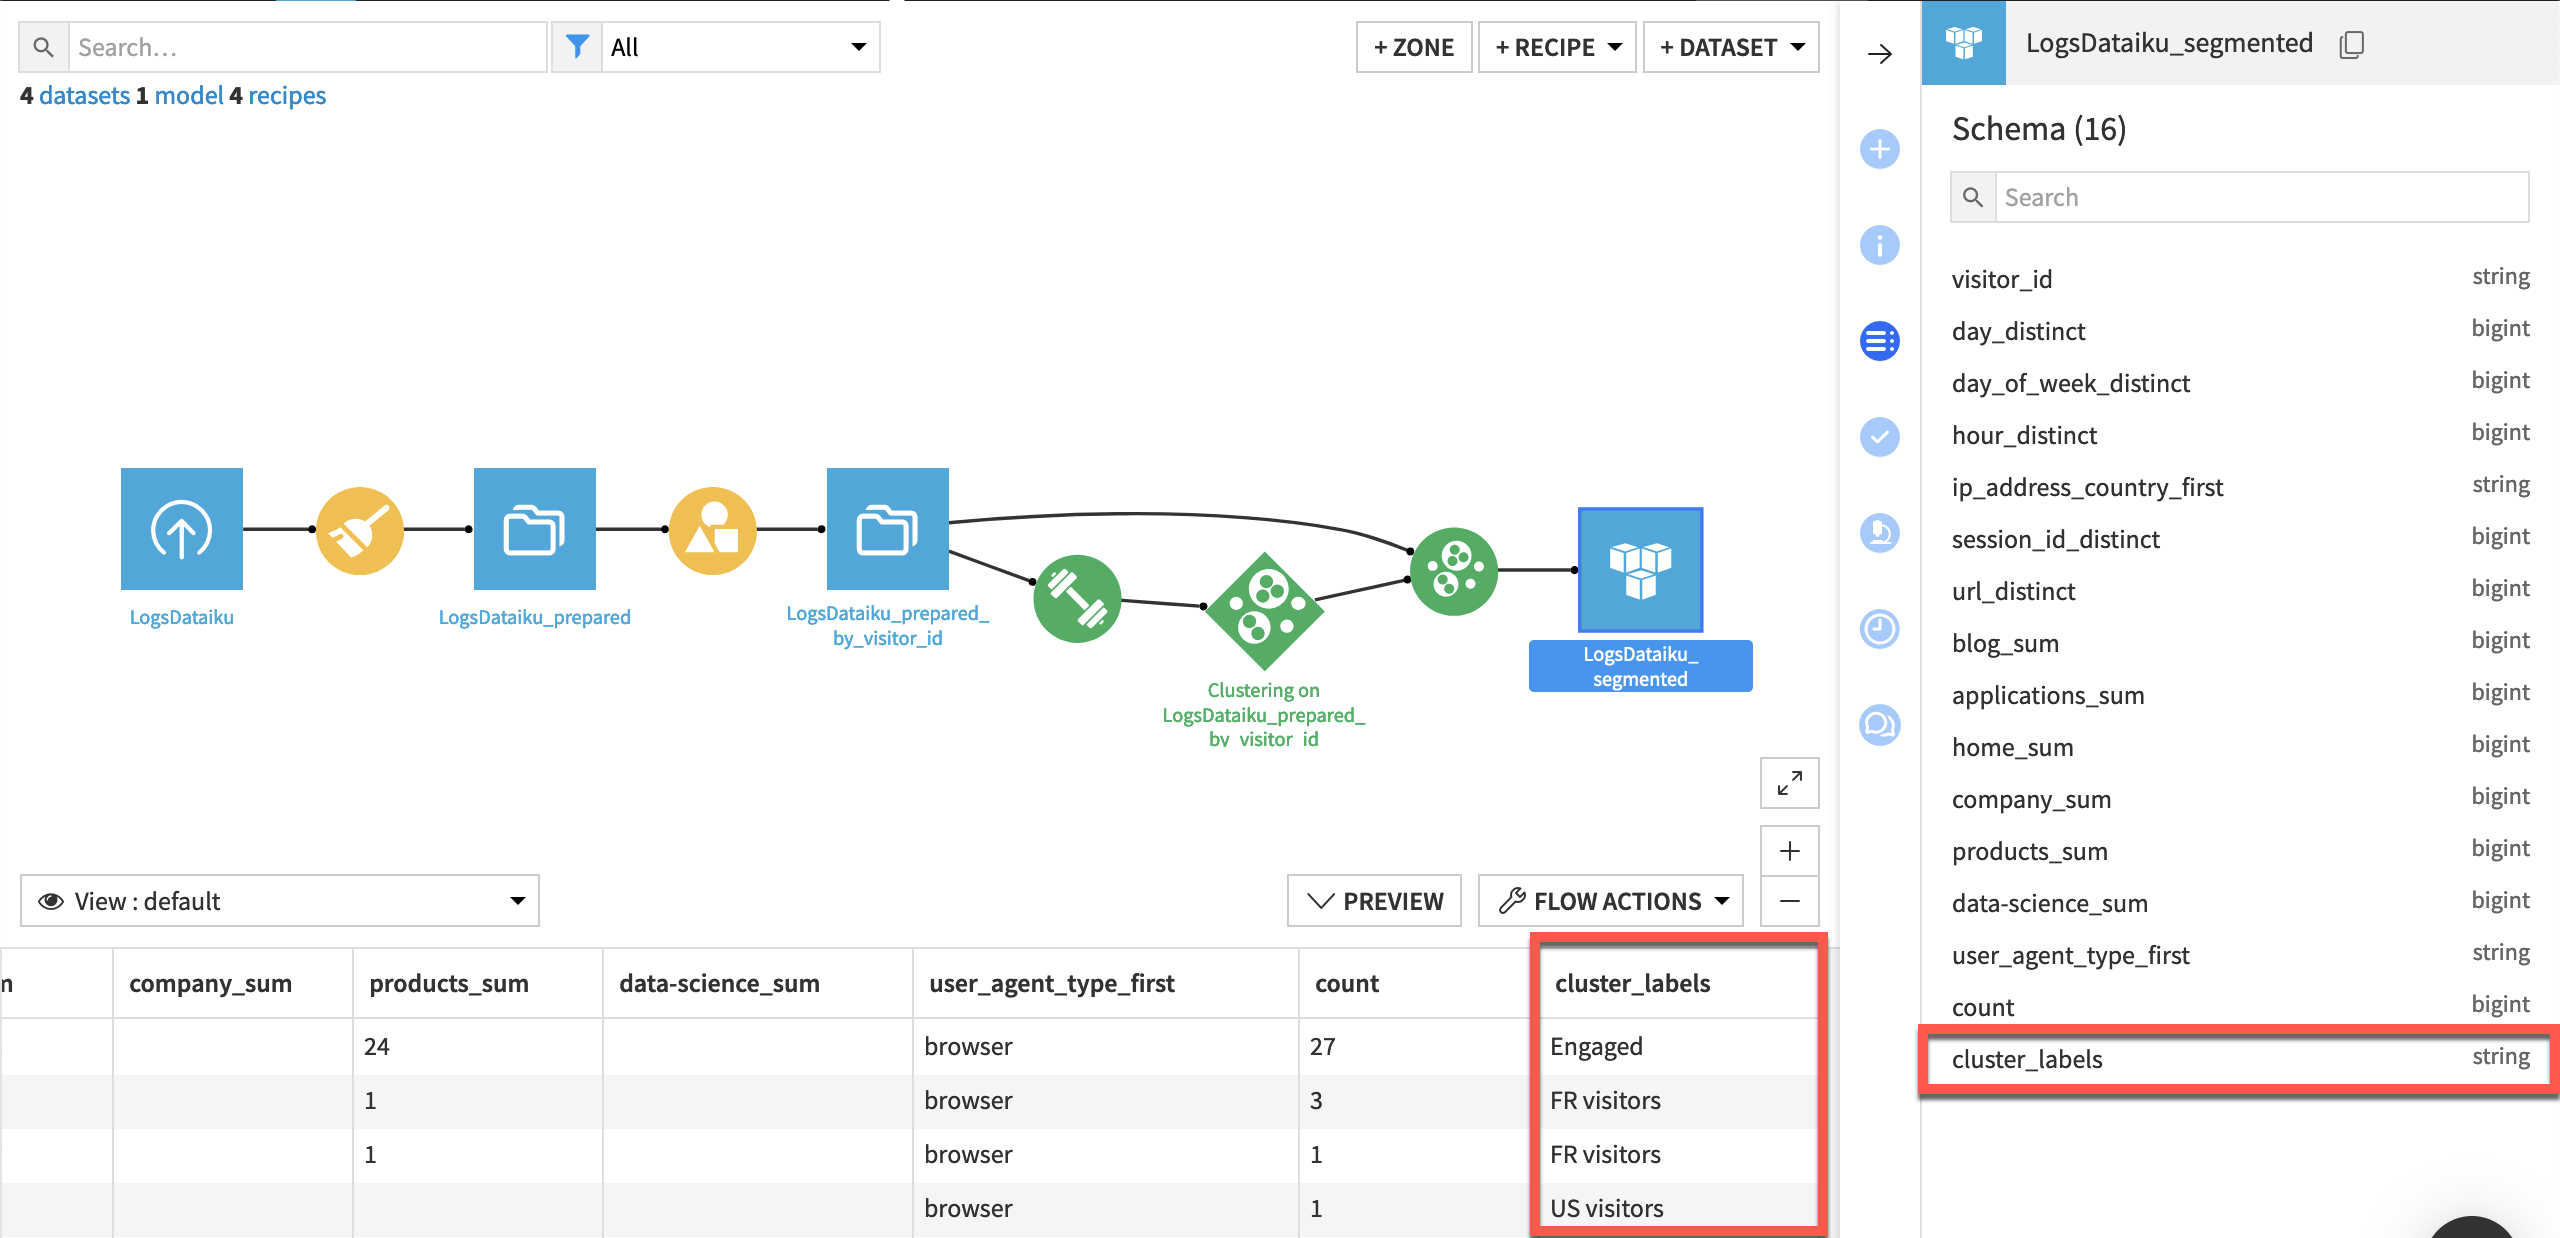
Take a few moments to study the output data.
Explore the LogsDataiku_segmented dataset.
Observe the addition of one new column: cluster_labels.
Tip
If you’re looking to take this project further, import this CRM data, join it with LogsDataiku_segmented using visitor_id as the key, and split it for distribution into separate channels.
Next steps#
Congratulations! You’ve built a clustering model to segment website visitors into categories.
See also
Learn more in the reference documentation on Clustering (Unsupervised ML).