
Concept | Sample/Filter recipe#
Watch the video or read the summary below.
At many points throughout an analytics pipeline, you may need to work with less data. Depending on your use case, you may need to reduce the number of rows in a dataset by:
Applying rules or conditions (filtering).
Selecting a random subset based on certain principles (sampling).
The Sample/Filter recipe provides a dedicated option to meet both needs.
Use case#
Whether a permanent step in a workflow, or something temporary that you later remove, many possible situations call for sampling or filtering data. If you imagine a dataset of credit card transactions, where each row is a unique transaction, you could find the Sample/Filter recipe helpful in any of the following situations:
Use case |
Example |
|---|---|
Accelerate development and testing |
Run a workflow on 1,000 transactions instead of 100 million while building a pipeline. |
Reduce downstream processing costs |
Sample transactions before sending them to an LLM recipe or another computationally expensive operation. |
Focus analysis on a target population |
Keep only transactions from a specific country, merchant category, or time interval. |
Debug pipeline behavior |
Filter to a small set of transactions that exhibit a known issue to trace how they move through a workflow. |
Create representative subsets of data |
Randomly sample transactions to perform exploratory analysis without processing the full dataset. |
Rebalance class distributions |
Create a more balanced sample for an ML classification task where one outcome is significantly more common than others. |
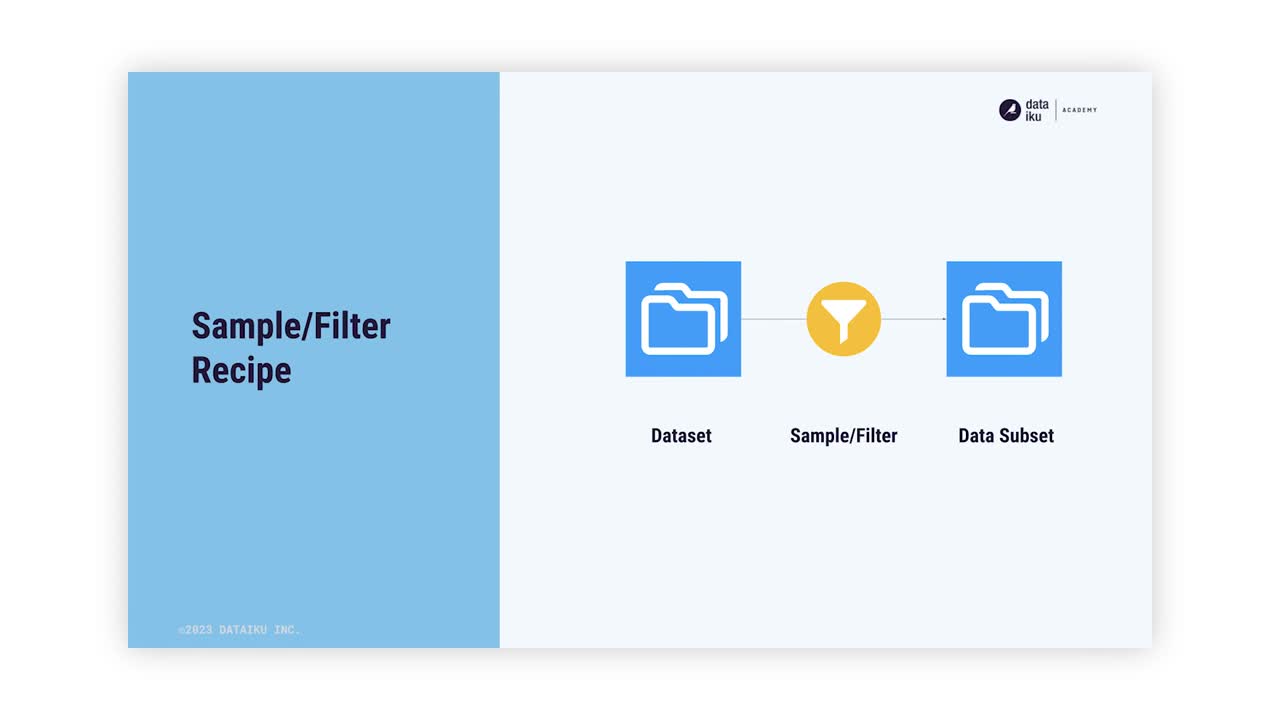
Though the dataset is too small to represent a realistic case, this example illustrates both core functions of the Sample/Filter recipe. The dataset on the left represents transactions. The dataset on the right is a random sample of transactions from July 2020.
Sampling and filtering with other technologies#
Sampling and filtering is a common need across many analytical tools. While syntax differs, the underlying operation is largely the same.
Technology |
Typical expression |
|---|---|
Excel |
Use filters to include or exclude rows based on conditions. Create samples by selecting the first rows, applying random sort orders, or using formulas such as |
SQL |
Use |
Python (pandas) |
Use boolean indexing to filter rows and |
R (tidyverse) |
Use |
Sampling and filtering with Dataiku#
Based on your exact need, it’s possible to sample and filter data in many places in Dataiku. First, in the Explore tab of a dataset, you can adjust the sample settings or apply filters using the column headers. However, these are temporary changes to the data displayed. They don’t impact the actual data in the Flow.
Second, you could always express sampling and filtering logic with a code recipe. However, many visual recipes also include Pre-filter and Post-filter steps before and after their core data transformation (such as Group, Pivot, Distinct, Window, etc.). Moreover, the Prepare recipe includes many processors for filtering.
These options are all valid in certain cases. Nevertheless, the Sample/Filter recipe is especially useful when the action of filtering or sampling itself is a meaningful step that deserves to be visible and documented in the Flow.
Sample/Filter recipe configuration#
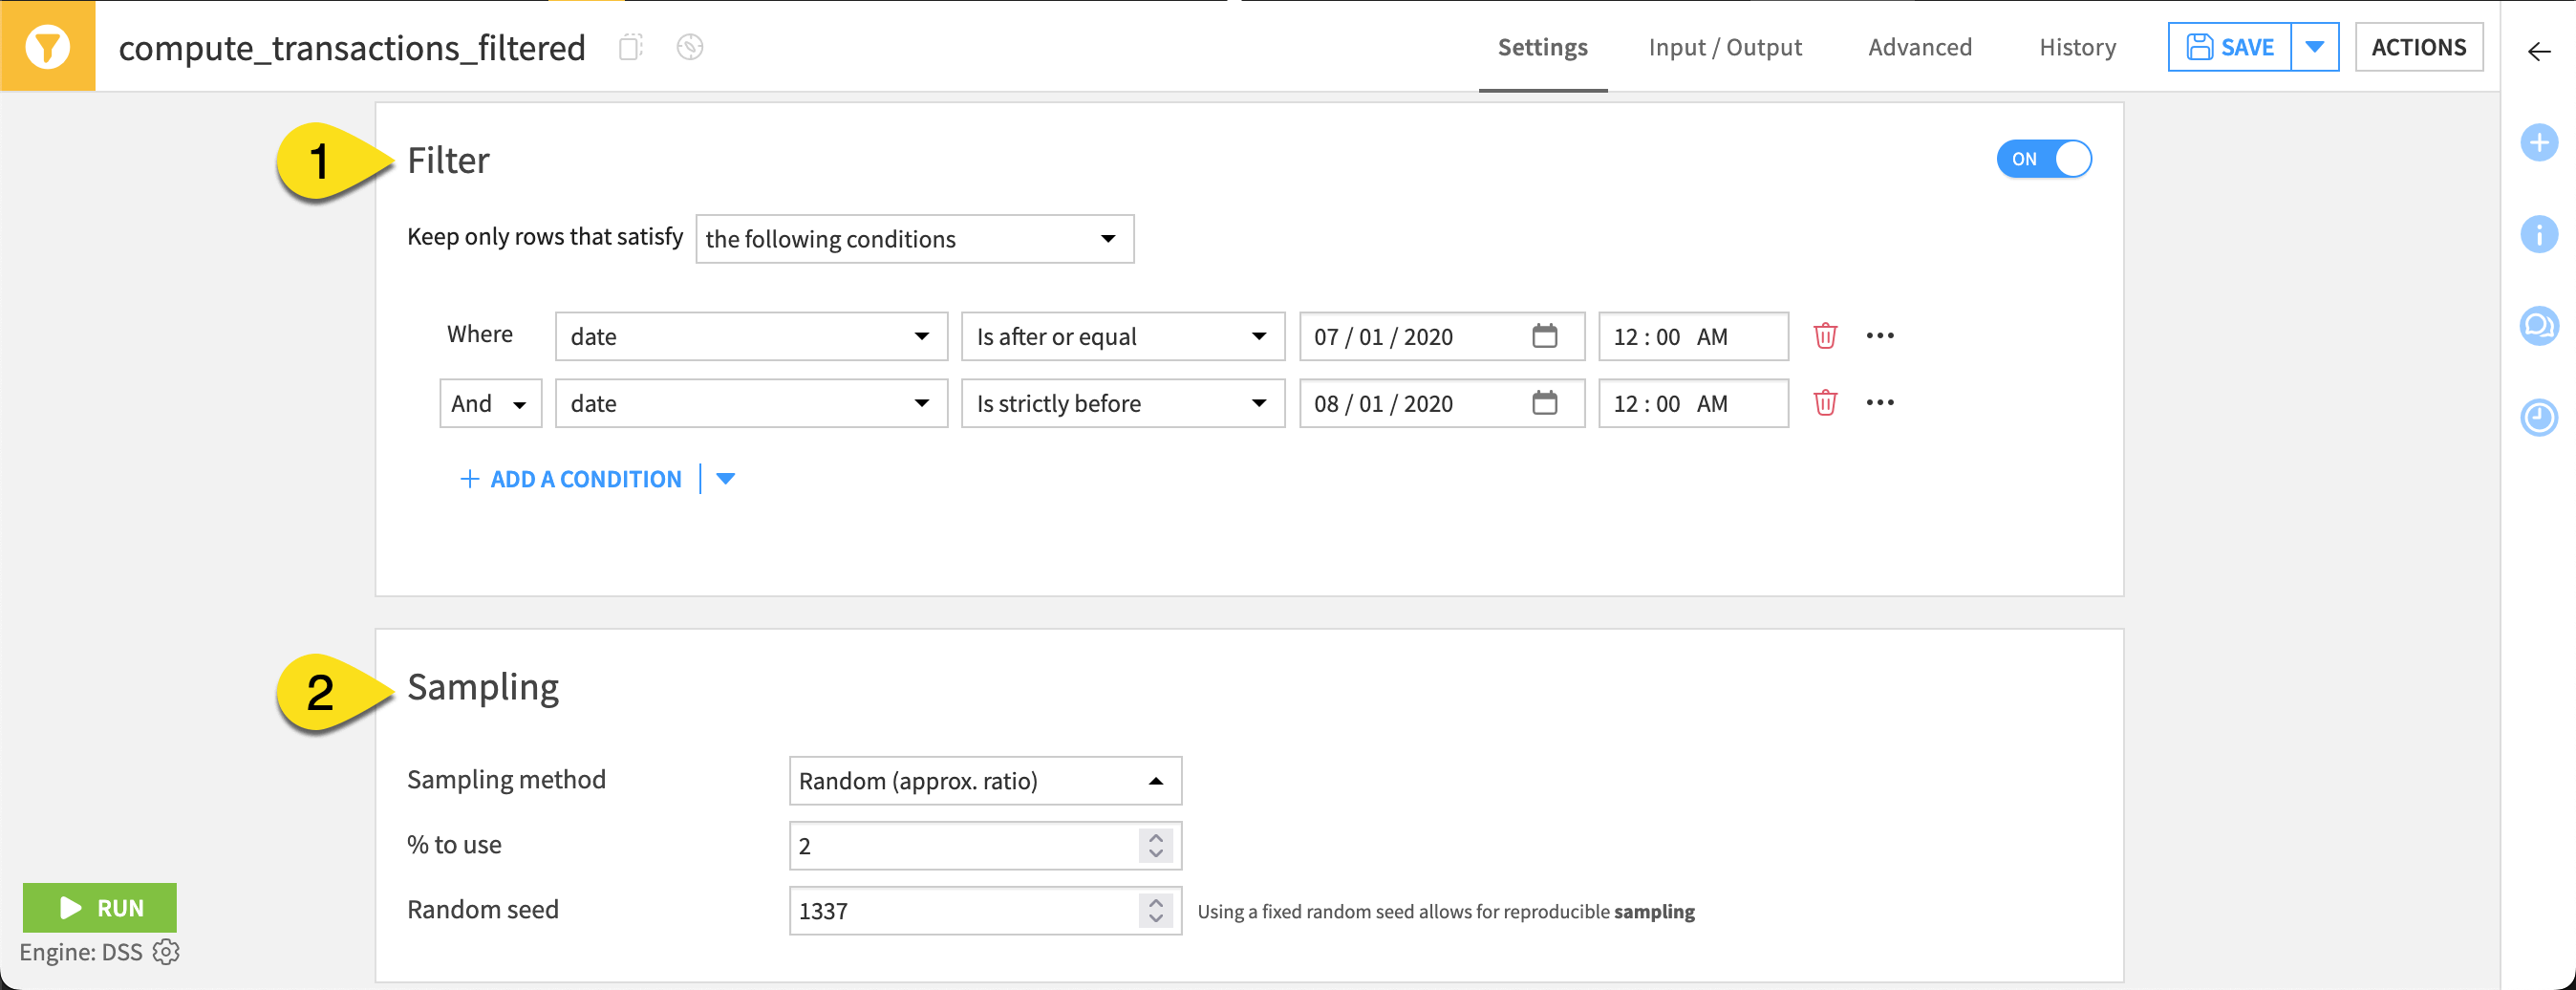
Configuring the Sample/Filter recipe has two sections, one for each of its core functions.
Recipe field |
Function |
Example |
|---|---|---|
Filter (1) |
Keep rows that satisfy rules. You can express those rules with GUI conditions, Dataiku formulas, or SQL (if using an SQL engine). |
Rows from July 2020 |
Sampling (2) |
Generate a sample based on the dataset’s first records, random, column values subset, or class rebalancing. |
A random 2% of remaining rows |
Advanced sampling methods#
While some sampling methods (first records or random) are self-explanatory to some degree, the value of two others deserve an explanation.
Column values subset#
For some use cases, rather than a random sample of rows, you want a random sample of complete entities. For example, you may be studying credit card user behavior. Instead of a random sample of all transactions, you actually may want a random sample of customers. Then you want to include all transactions for customers selected in the sample. This method provides a complete picture of transactions from a random selection of customers.
Class rebalance#
The class rebalance sampling method is primarily intended for machine learning workflows. It reduces the prevalence of dominant classes so that less common outcomes remain adequately represented in the sample.
For example, in a credit card fraud use case, perhaps only 1% of transactions are fraudulent. A simple random sample would preserve the original class distribution, which may leave too few fraudulent records for effective model development.
Note that the recipe only undersamples, rather than oversamples. In this example, the sampled output would contain fewer non-fraudulent records than a true random sample. It wouldn’t duplicate or generate new fraudulent records.
Next steps#
See also
See the reference documentation on filtering and Sampling methods for the differences between the methods found in the recipe.
Tip
You can find this content (and more) by registering for the Dataiku Academy course, Visual Recipes. When ready, challenge yourself to earn a certification!