
Tutorial | Model overrides#
Get started#
Model overrides in Dataiku allow you to add a human layer of control over model predictions to ensure the final outcome complies with certain business rules or conditions.
Concretely, you can:
Input override rules and constraints up front when designing the model.
Then, when evaluating model results, examine which rules were triggered most frequently. Built-in charts help you assess what proportion of predictions fell inside the guardrails naturally, versus required intervention to meet the conditions.
See also
For more information, see Prediction Overrides in the reference documentation.
Objectives#
In this tutorial, you will:
Define model overrides for a regression model.
Analyze how override rules impact model training with native charts.
Deploy your model to the Flow.
Generate predictions against unseen data and explore the output dataset to see if and when overrides are applied.
Prerequisites and limitations#
Dataiku 12.0 or later.
An Advanced Analytics Designer or Full Designer user profile.
See also
For more information, see the Limitations section of the reference documentation.
Use case summary#
In this tutorial, we’re using a regression model that predicts the resale value of a used car, in US dollars.
We want to enforce two rules:
If the car is in <condition> |
The predicted value: |
|---|---|
broken condition |
|
functional condition |
should range between $600 and $40,000. |
Create the project#
From the Dataiku Design homepage, click + New Project.
Select Learning projects.
Search for and select Model Overrides.
If needed, change the folder into which the project will be installed, and click Create.
From the project homepage, click Go to Flow (or type
g+f).
Note
You can also download the starter project from this website and import it as a ZIP file.
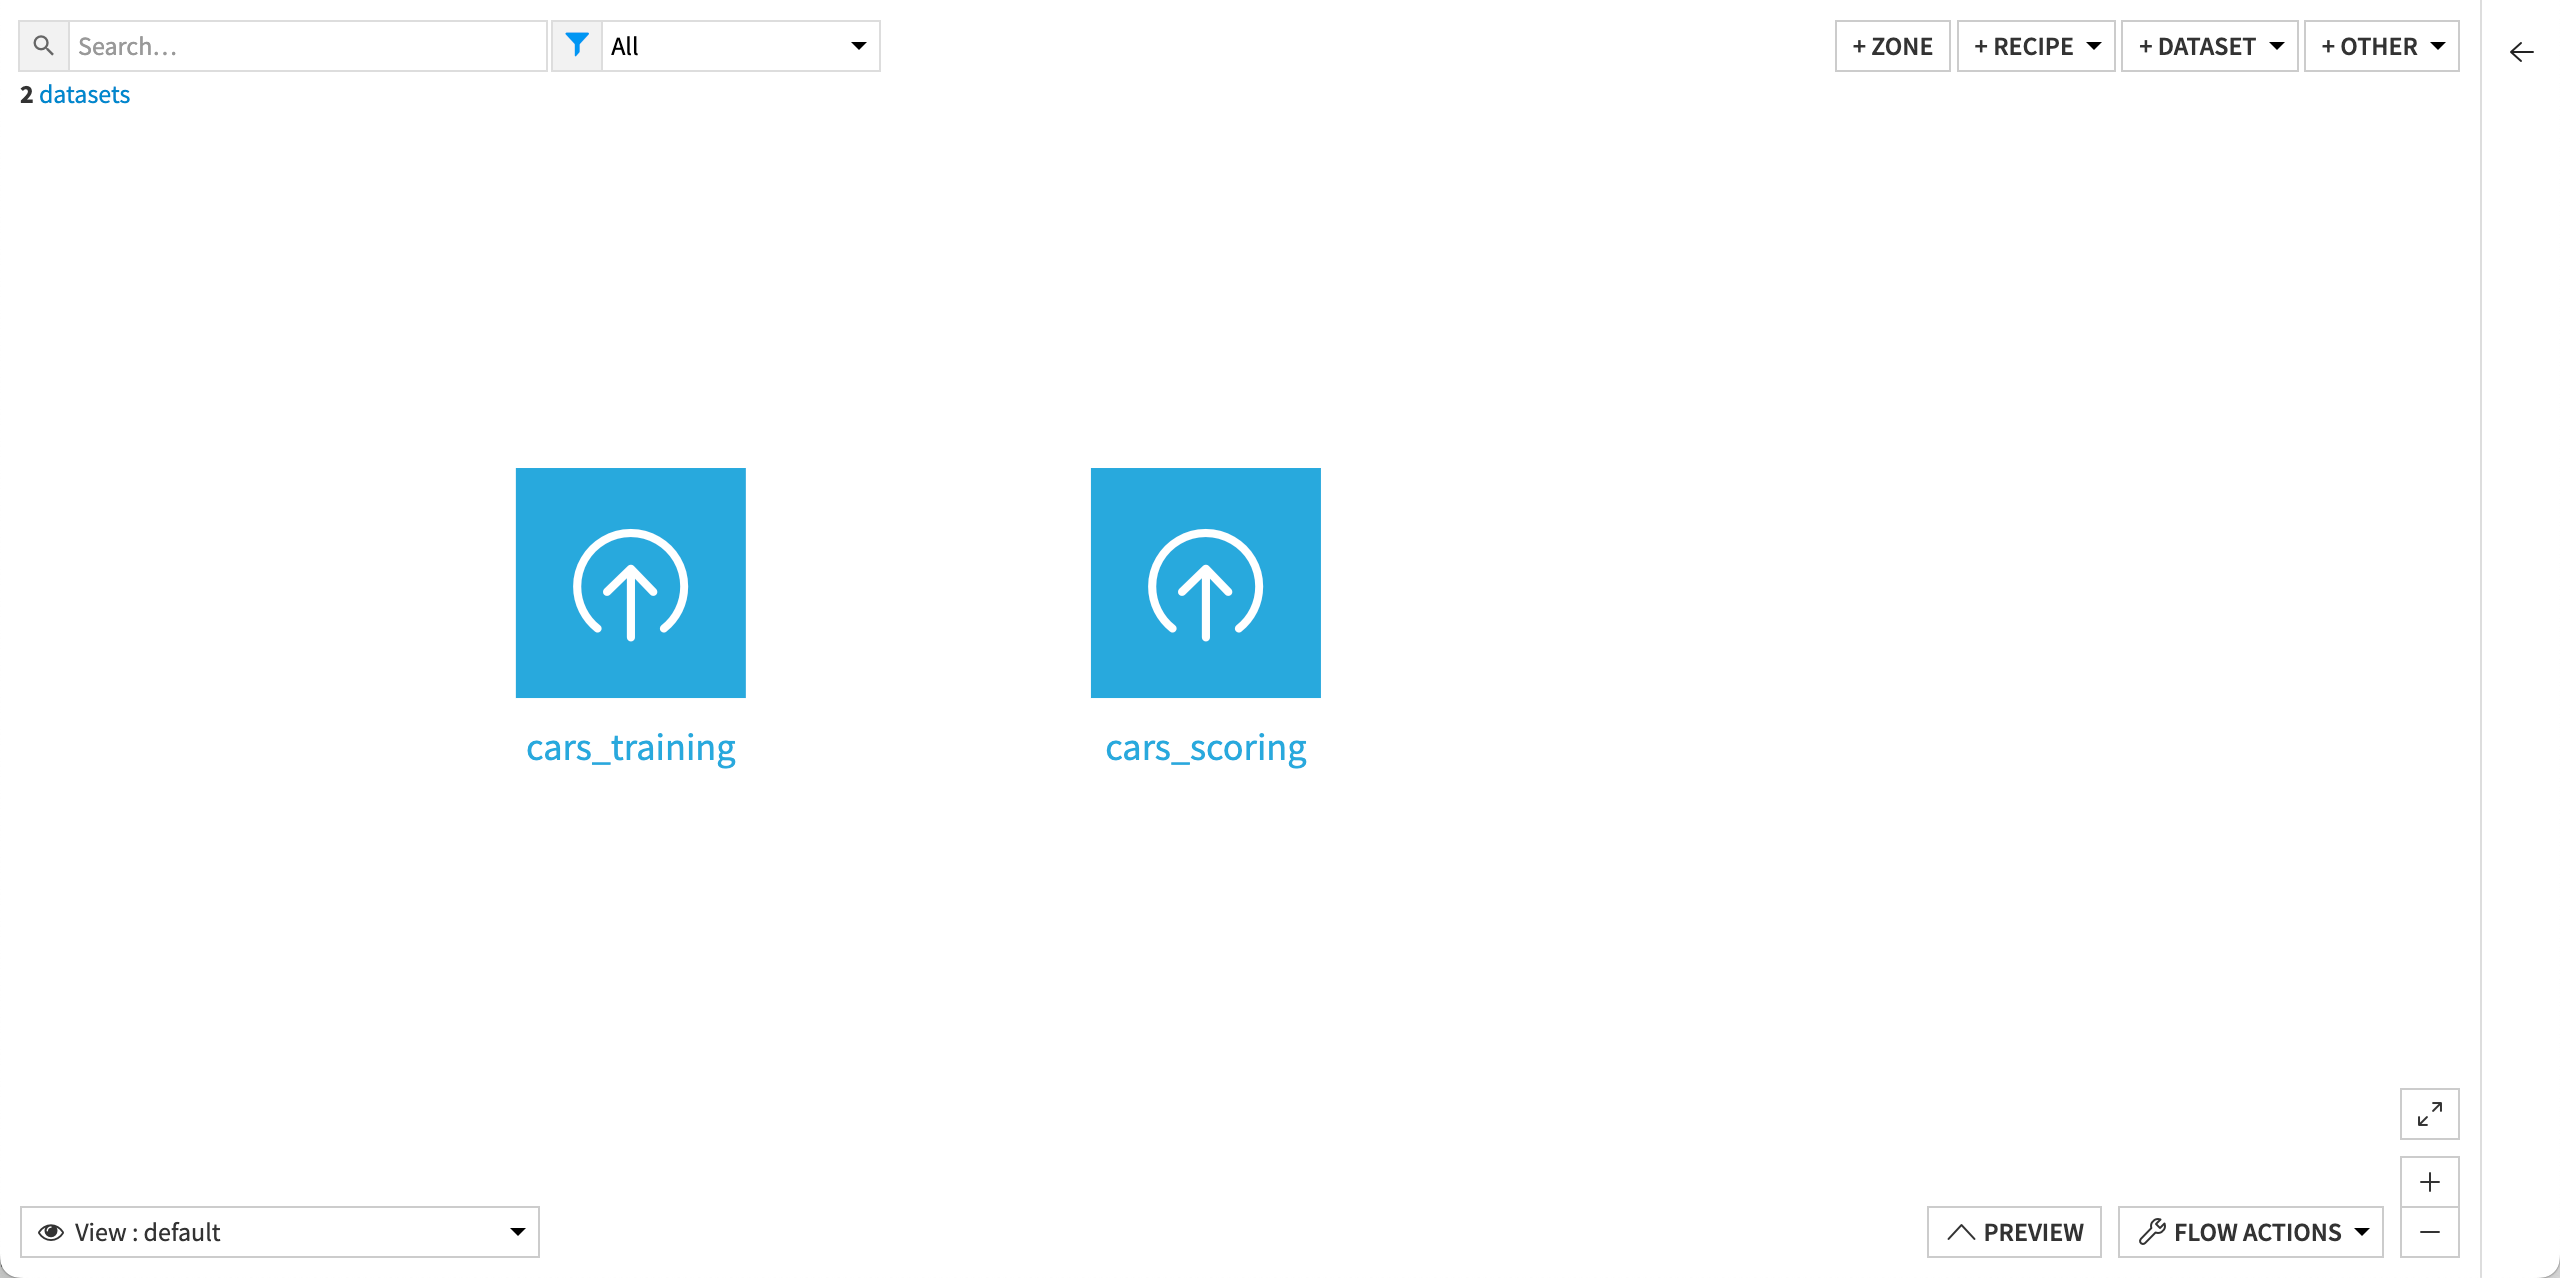
You should see the following two datasets:
Define override rules#
Let’s add the override rules to our model. To do so:
From the ML (
 ) menu of the top navigation bar, click Visual ML (Analysis) (or press
 g+a) and select Quick modeling of Price on cars_training.In the Design tab of the analysis, go to the Model Overrides panel.
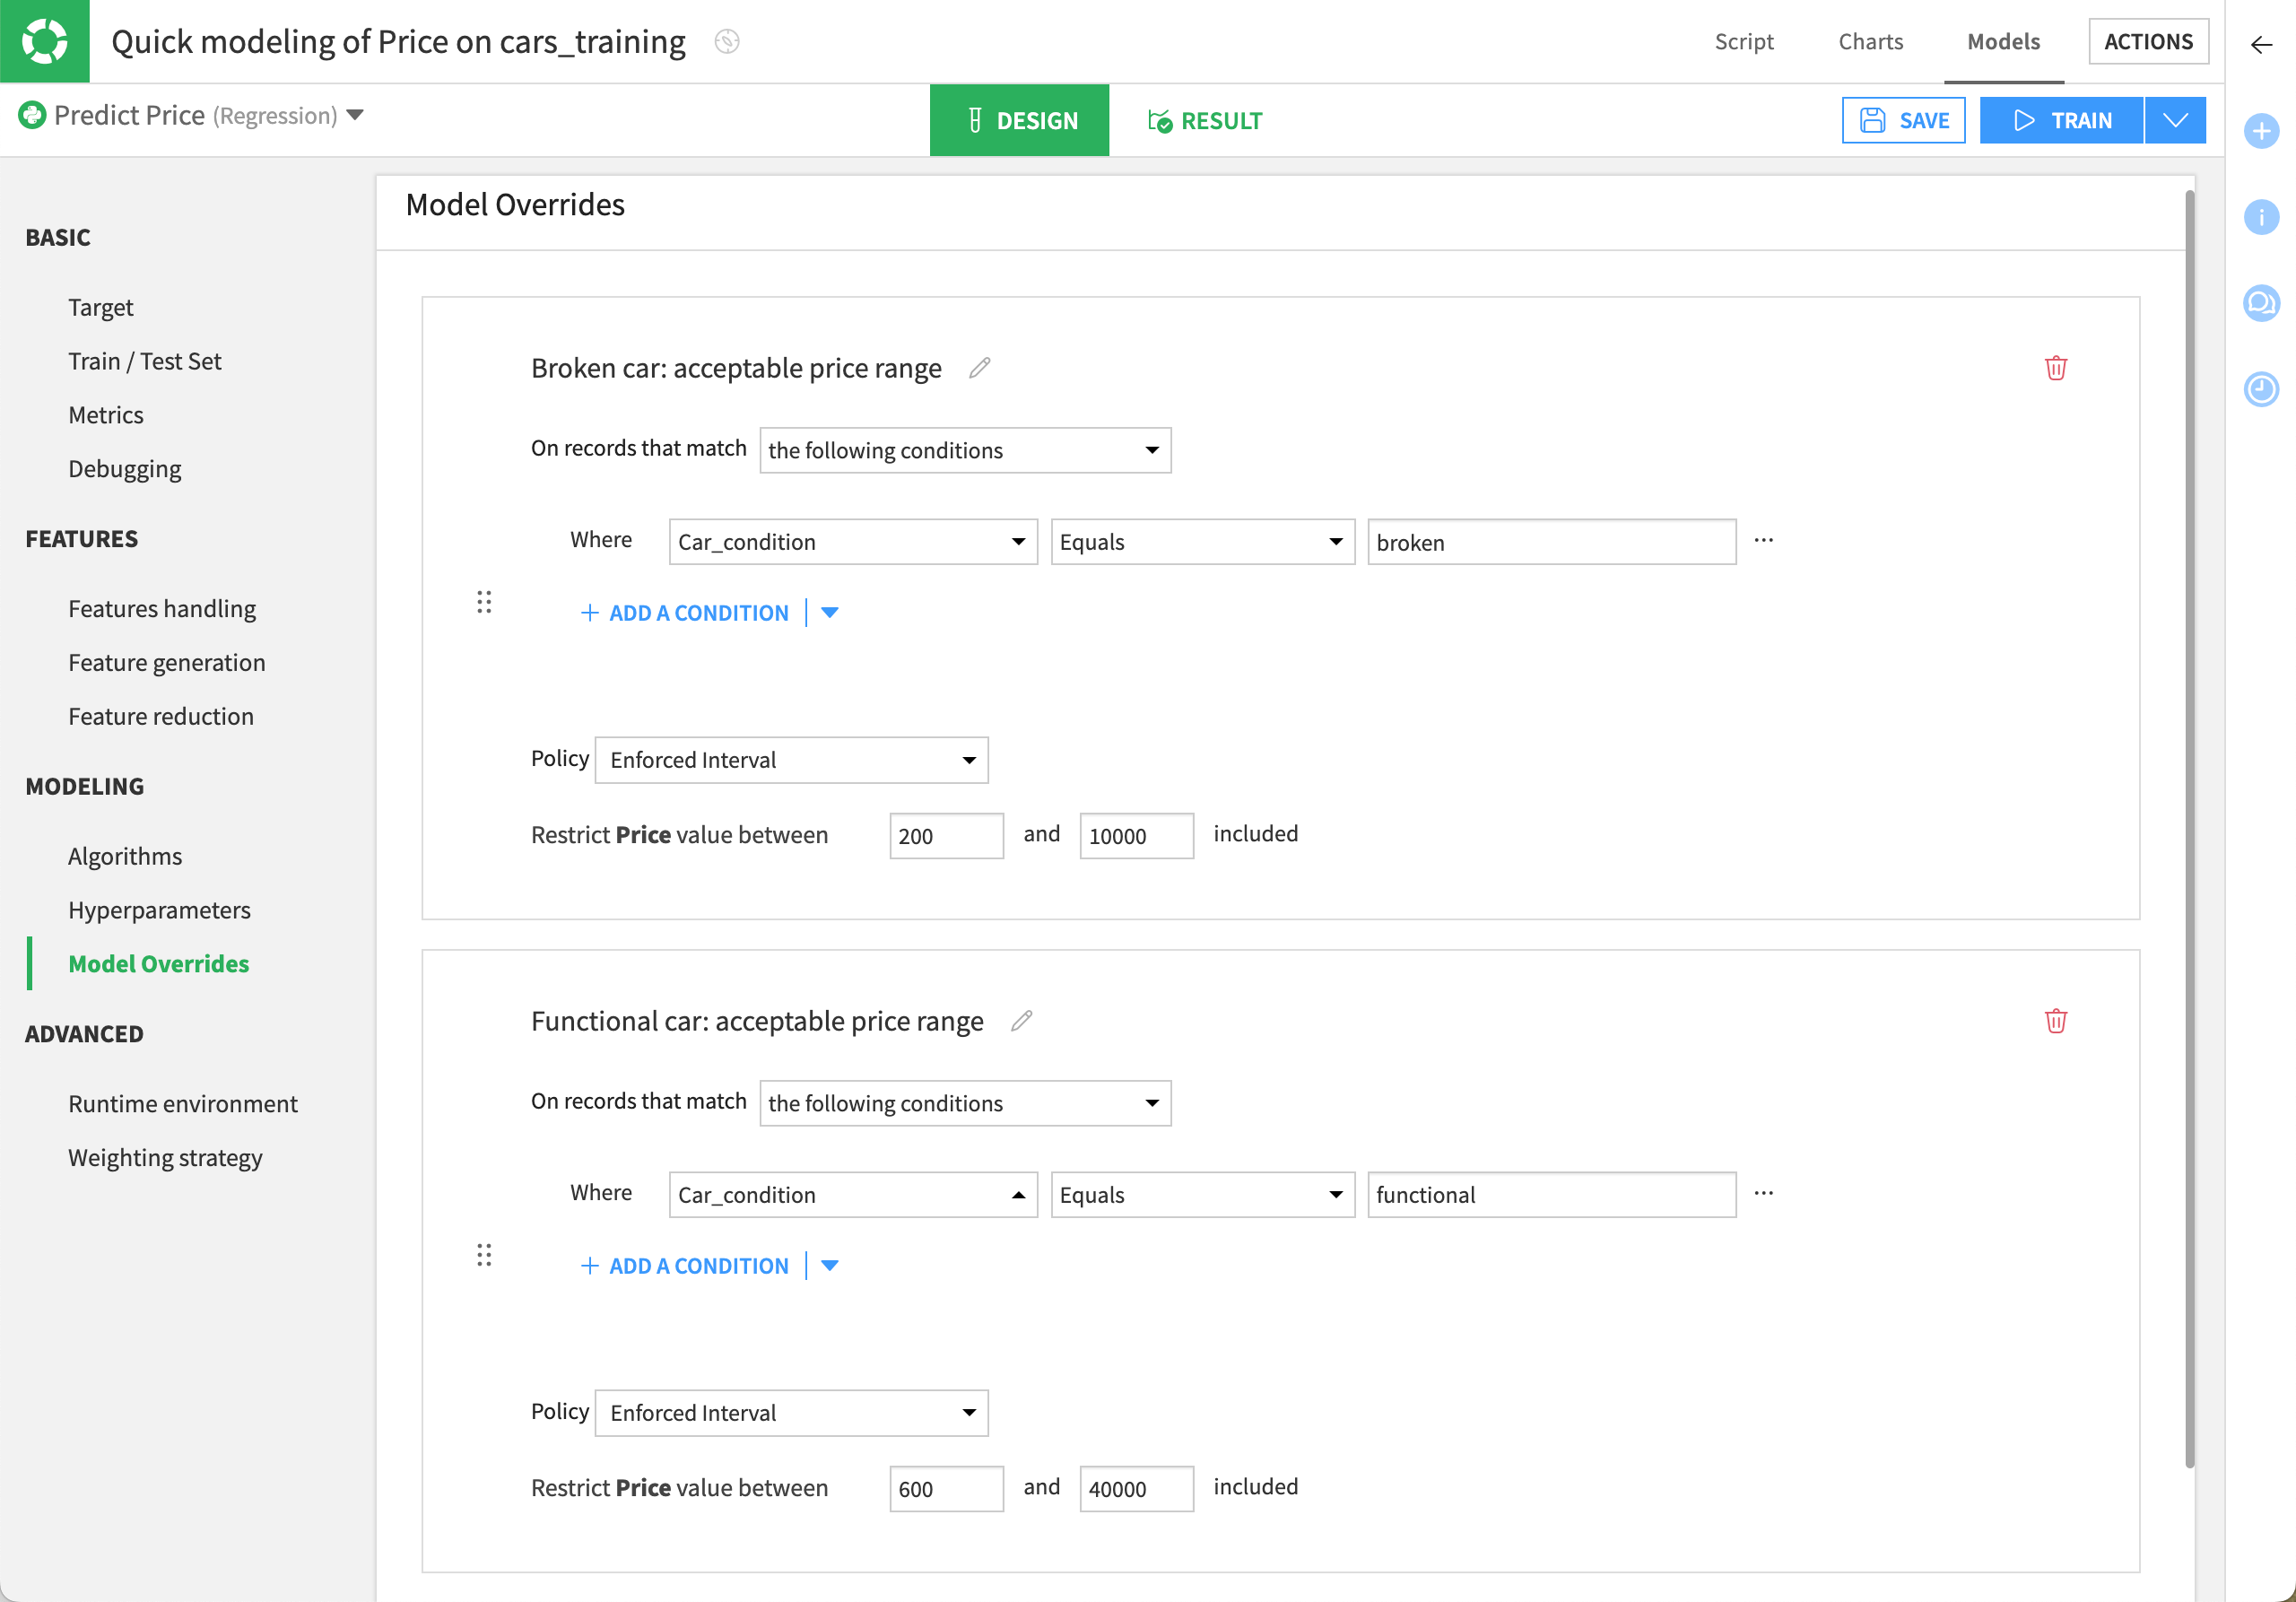
Click on Add Override to define our first rule.
Name it
Broken car: acceptable price rangeand set the following conditions:On records that match the following conditions.
Where Car_condition equals
broken.Restrict Price value between
200and10000included.
Click on Add Another Override to define the second rule.
Name it
Functional car: acceptable price rangeand set the following conditions:On records that match the following conditions.
Where Car_condition equals
functional.Restrict Price value between
600and40000included.
Save your changes and click Train to train the model.
Caution
Since Dataiku applies the first override rule matching a record and doesn’t evaluate subsequent rules, it’s important to define rules in the right priority.
Note
By default, the Policy option is set to Enforced Interval. Set it to Declined when you want the model to use the override rule to discard matching rows from the prediction.
Check the model results#
After training, as usual, let’s head over to the Result tab to evaluate the model’s behavior.
Note
Remember, overrides are applied once the model is fully trained.
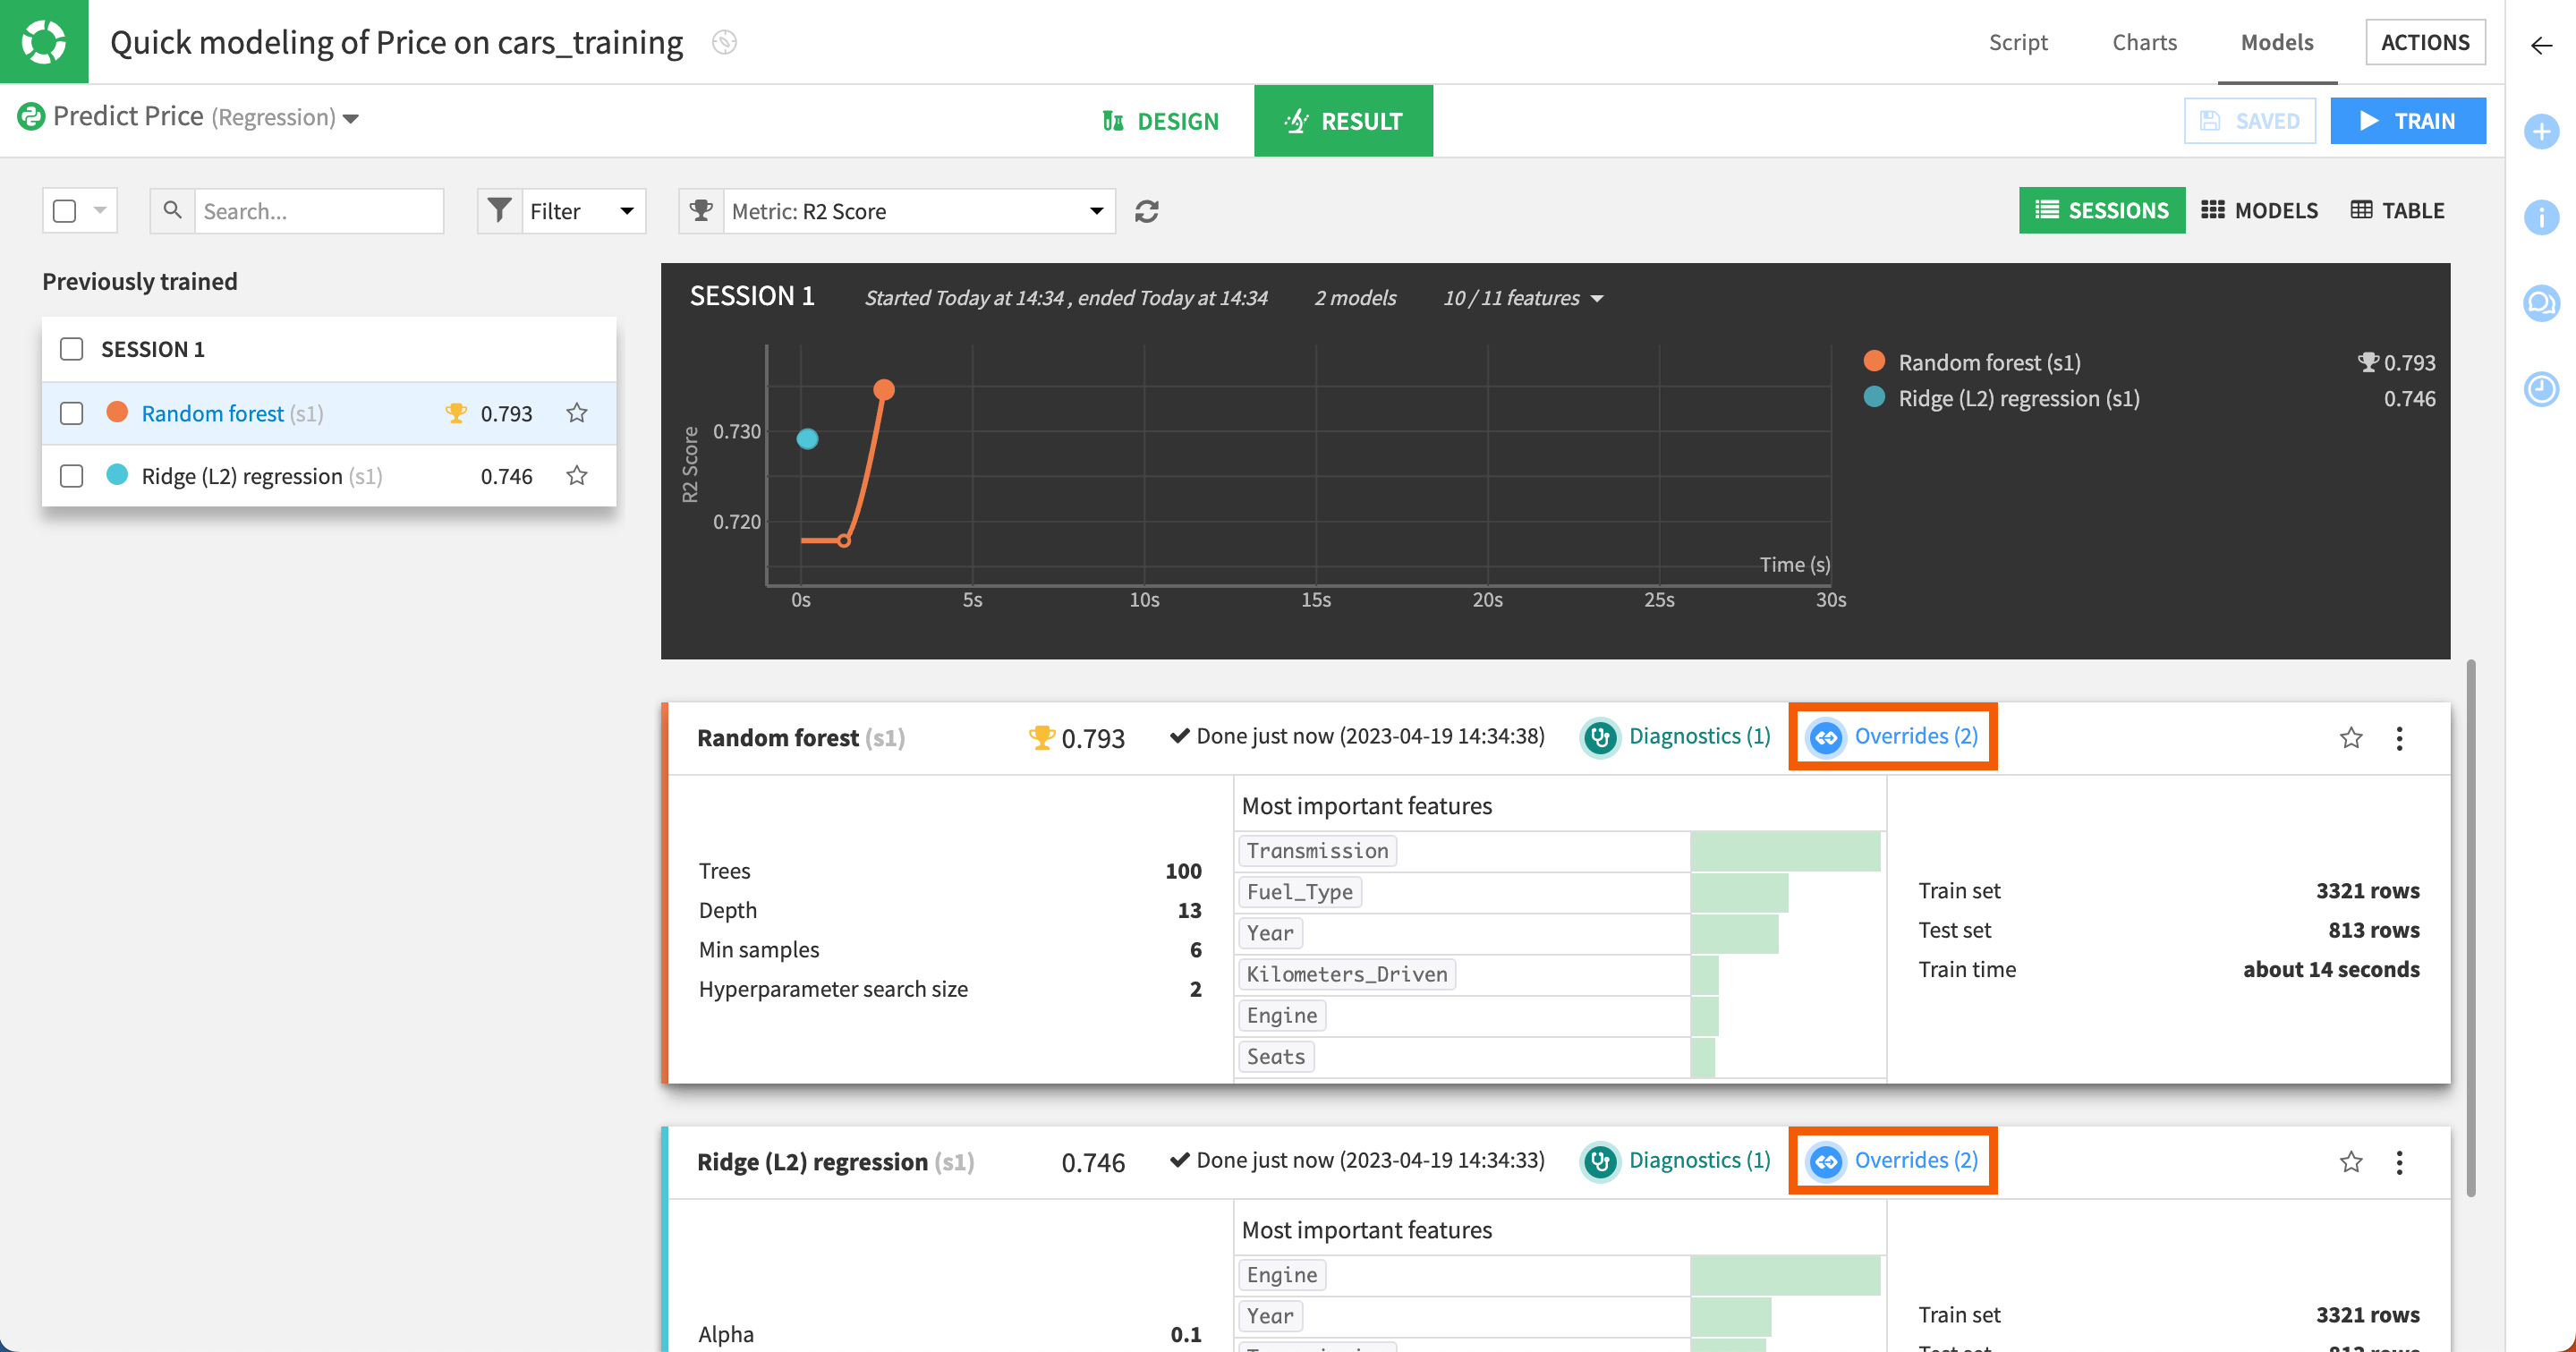
Notice how in addition to the standard diagnostics, each trained model also provides a visual cue that some overrides were applied.
Clicking on the Overrides link opens the Override Metrics panel, where you can:
Assess model performance with and without overrides.
Examine, via the Sankey diagram, which rules were matched most frequently in our data. In this case, there are many more cars listed as functional than broken.
Visualize what proportion of predictions matched an override rule and met the criteria without intervention versus triggering an override.
Below, you can see the results of the model using the random forest algorithm.
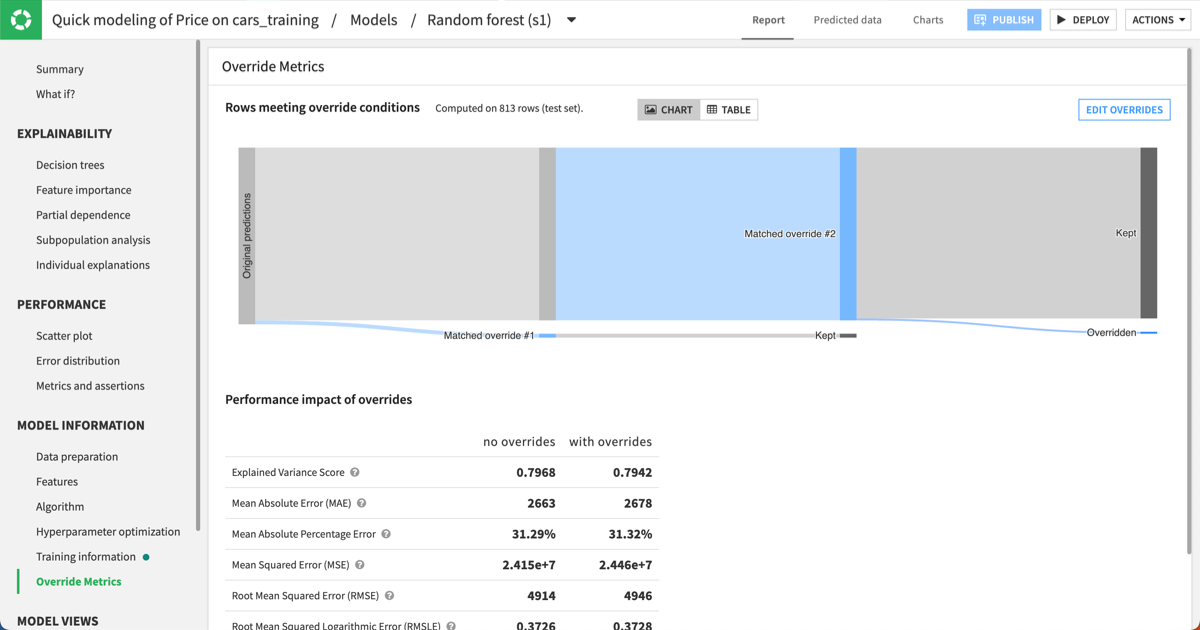
Note that you can use the table view to analyze the results. It helps you review the criteria for each rule alongside the proportions of matching rows and overrides in our test set.
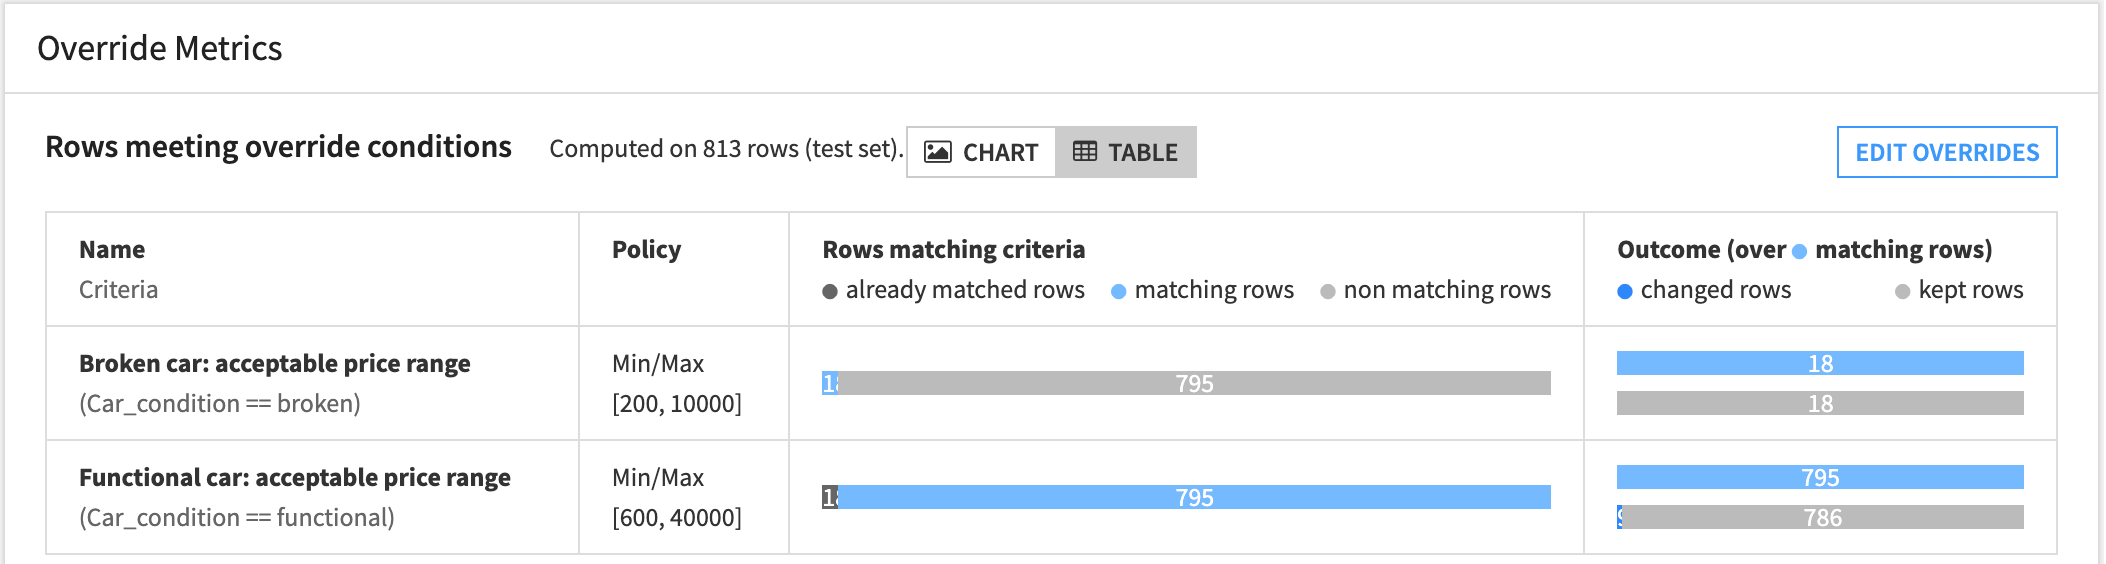
As you can see:
18 rows matched the broken car override rule, but all of the original predictions were kept since none violated the rule.
795 rows matched the functional car override rule. Of these, 9 predictions were overridden.
Note
For more information, see the Edit the override section below.
Edit the override#
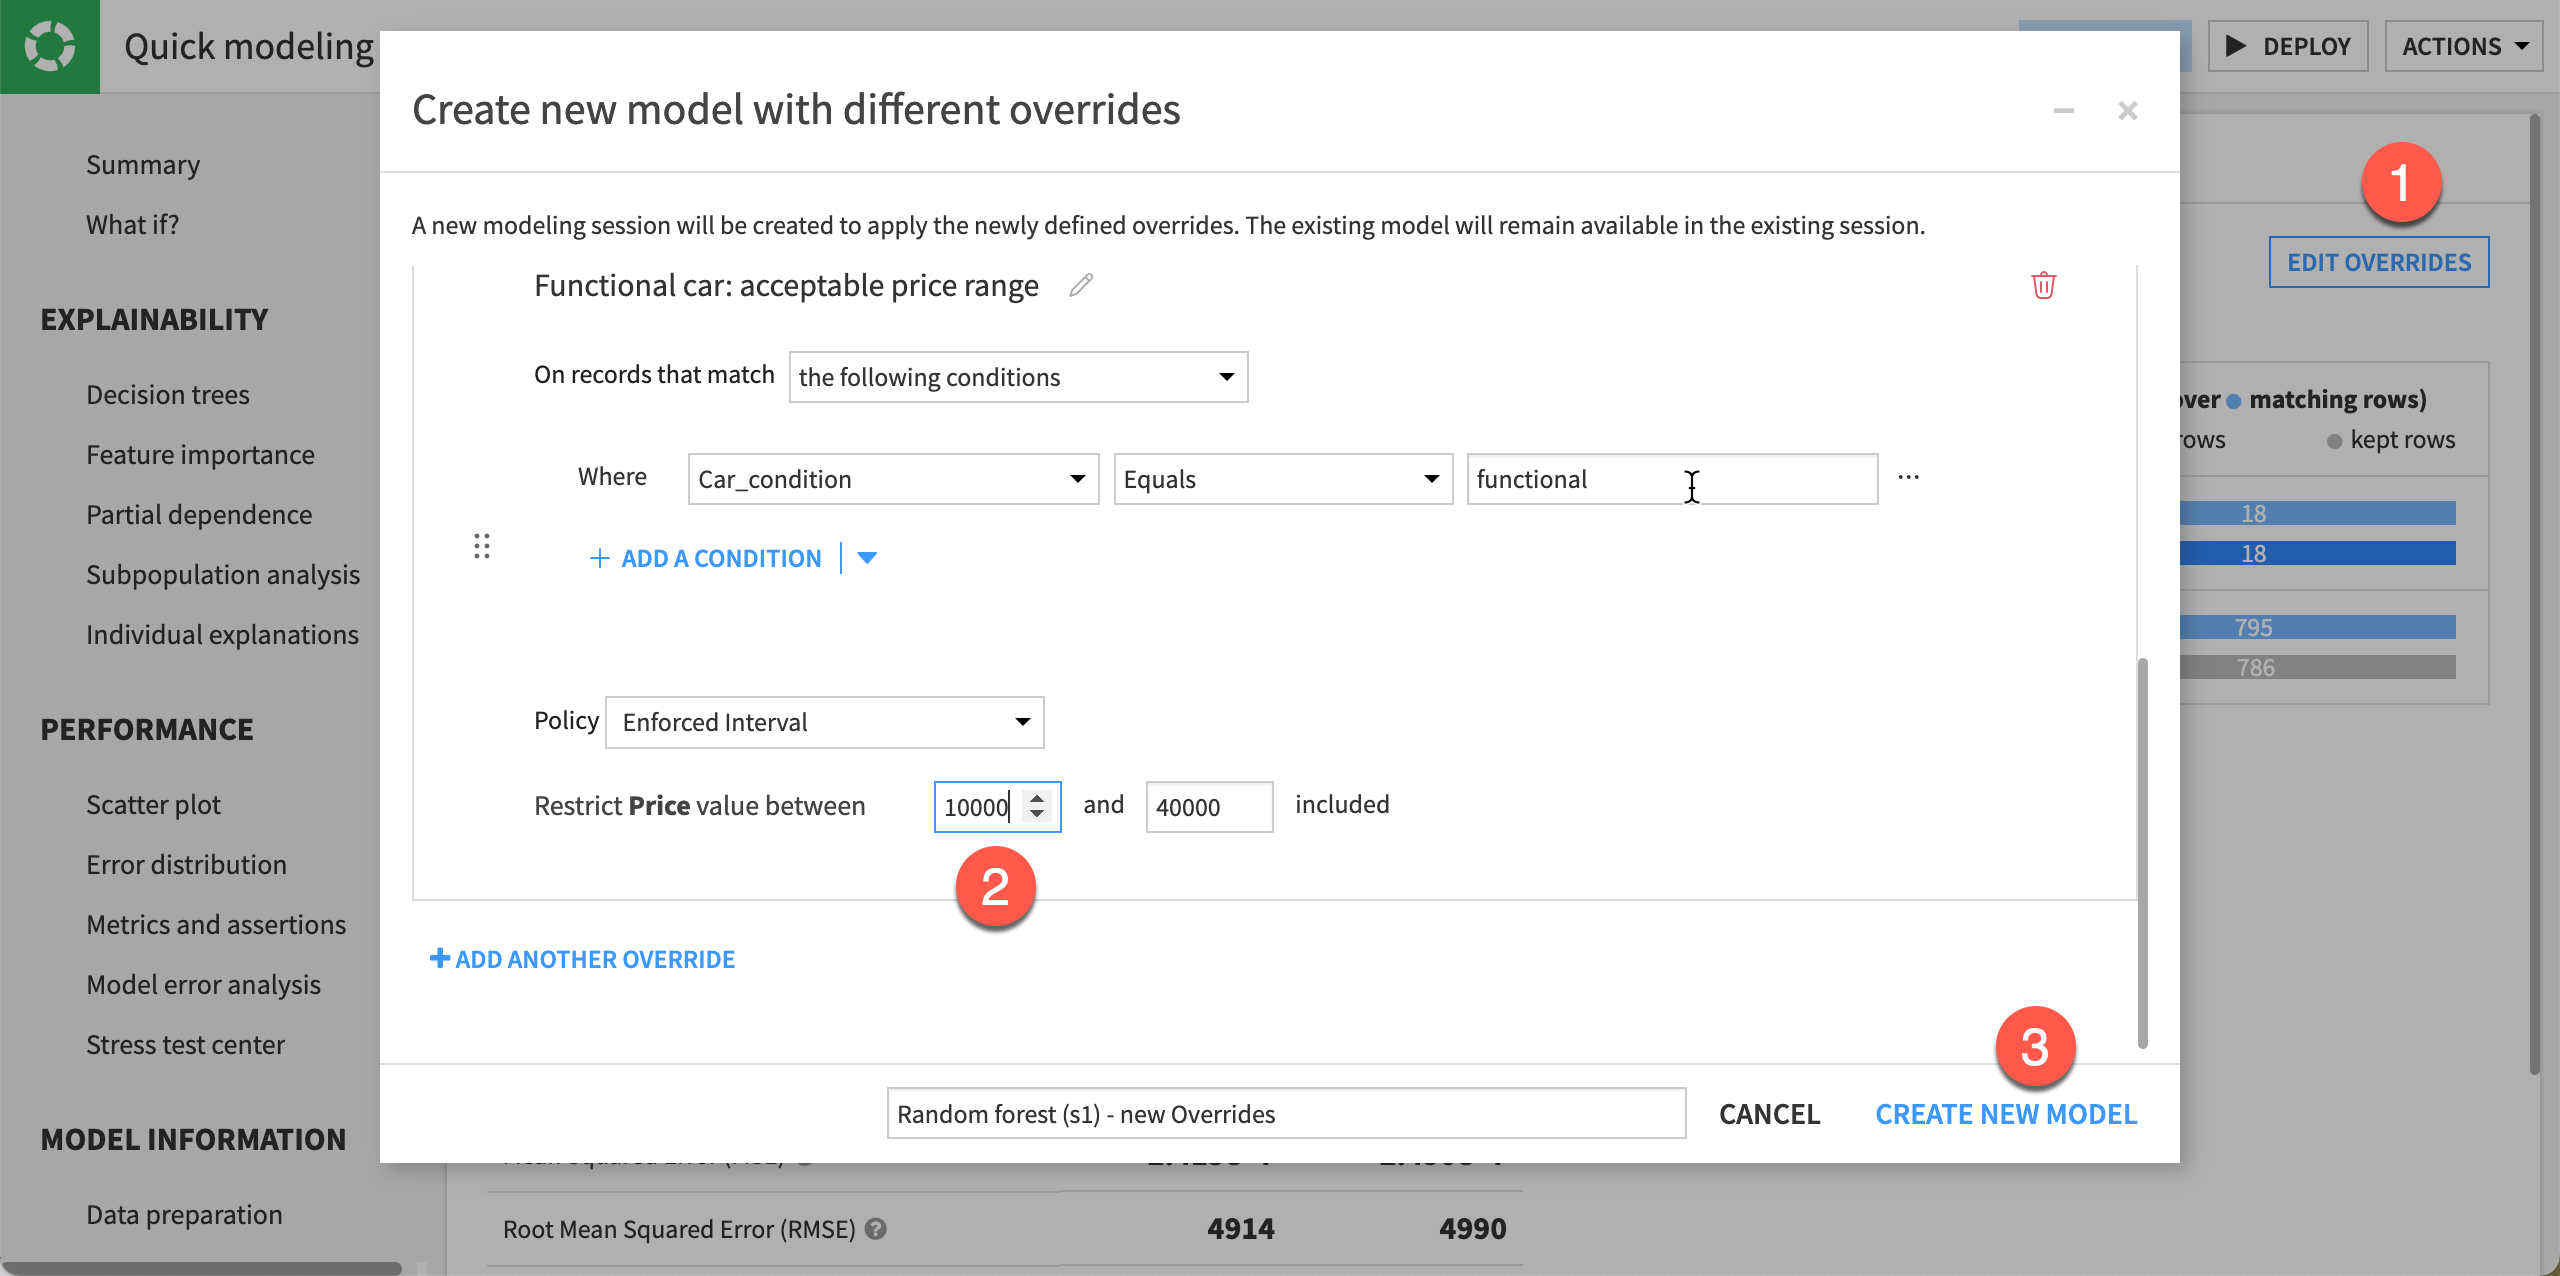
Now, we want to evaluate a scenario under different override conditions. The Edit Overrides button in the top right corner of the trained model allows you to duplicate said trained model into a new session, where you can change the override rules and analyze the resulting impact on outcomes without losing the previous results.
Here, let’s edit the override to change the values of the initial condition set for the functional cars. Concretely:
If the car is in <condition> |
The predicted value: |
|---|---|
broken condition |
follows the initial override rule (between $200 and $10,000). We don’t change the initial rule. |
functional condition |
should range between $10,000 and $40,000 (instead of $600 to $40,000). |
To do so:
Still from the Override Metrics page, click the Edit Overrides button. It opens the Create new model with different overrides window.
For the functional cars rule, change the lower limit from
600to10000.Click on Create New Model. It automatically starts training a new random forest model with the new override rules.
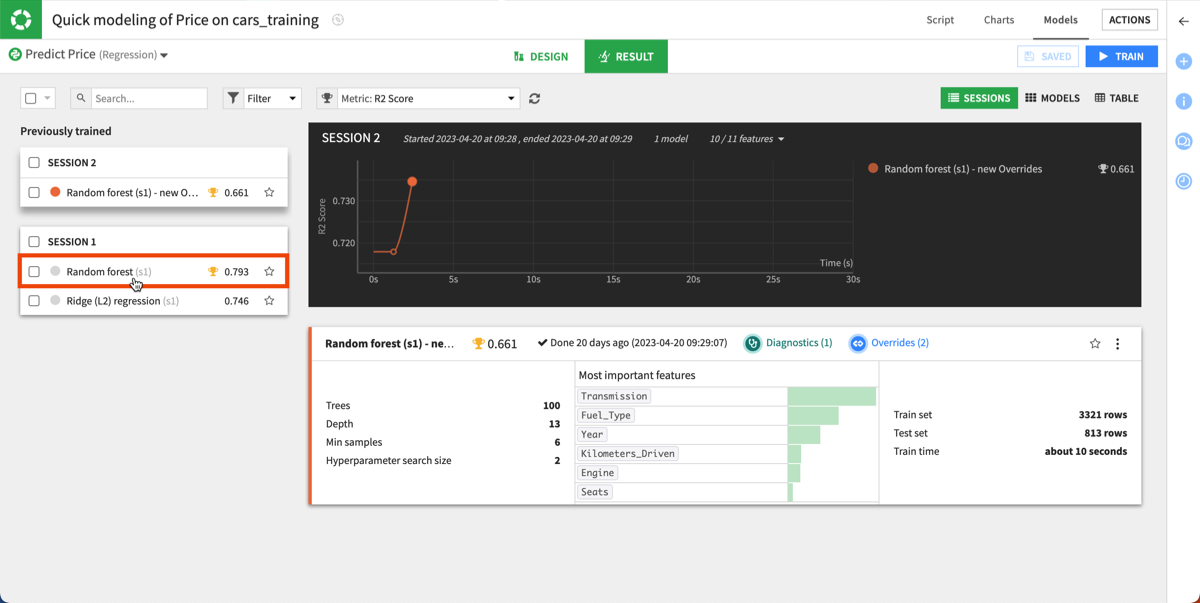
Click the newly trained model to see its report page and decide whether to deploy it.
Deploy your model#
Once you’ve checked the model results after each training, you can decide which model to deploy. Here, we’re deploying the random forest model from session 1, before editing the override rules. To do so:
From the ML (
) menu of the top navigation bar, go back to the Visual ML (Analysis) page and select the Quick modeling of Price on cars_training analysis.In the Result tab, click on the Random forest model from session 1.
From the Random forest (s1) result page, click the Deploy button in the upper right corner.
Keep the default settings and click Create. You are automatically redirected to the Flow where the deployed model has been added to the Model overrides Flow zone.
Score new data#
Create the Score recipe#
Let’s now use a Score recipe to apply our model to new and unseen data.
From the Flow, click Predict price, our deployed model.
In the right panel, under the Apply model on data to predict section, click on the Score recipe.
In the Score a dataset window, choose cars_scoring as the input dataset.
Name the output dataset cars_scored.
Click Create Recipe.
Keep the default settings and click Run.
When we score new data through a model with overrides, Dataiku returns both the raw and final predictions and, if applicable, which specific override was applied.
Explore the output dataset#
Once the scoring task is completed, open the output dataset to explore it. The Score recipe produces the cars_scored dataset that appends two new columns to the input dataset:
prediction that predicts for each row the resale price of the used car.
override that indicates which override rule was applied with some details. See the example below:
{
  "appliedOverride":"Functional car: acceptable price range",
  "overrideMatched":true,
  "rawResult":{
  "prediction":19459.96211061579
   },
  "predictionChanged":false
}
See also
For more information on the content from the override column, see the Overrides Extra Info Column section in the reference documentation.
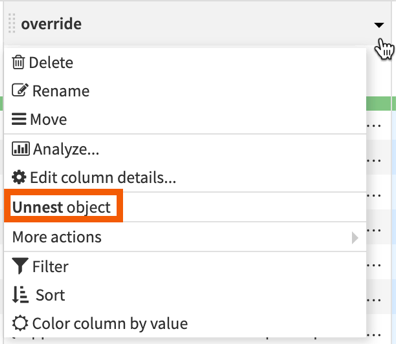
Let’s unnest the override detail to make it more readable. To do so:
In the Actions menu of the right panel, under Visual recipes, select the Prepare recipe.
In the recipe configuration dialog, keep the default dataset name and click Create Recipe.
In the contextual menu of the override column, select Unnest object. This adds a step to your recipe.
Keep the default settings and click Run.
Once the job is completed, click on the Explore dataset cars_scored_prepared link to view the output dataset with the content of the override column distributed across several columns for more clarity.
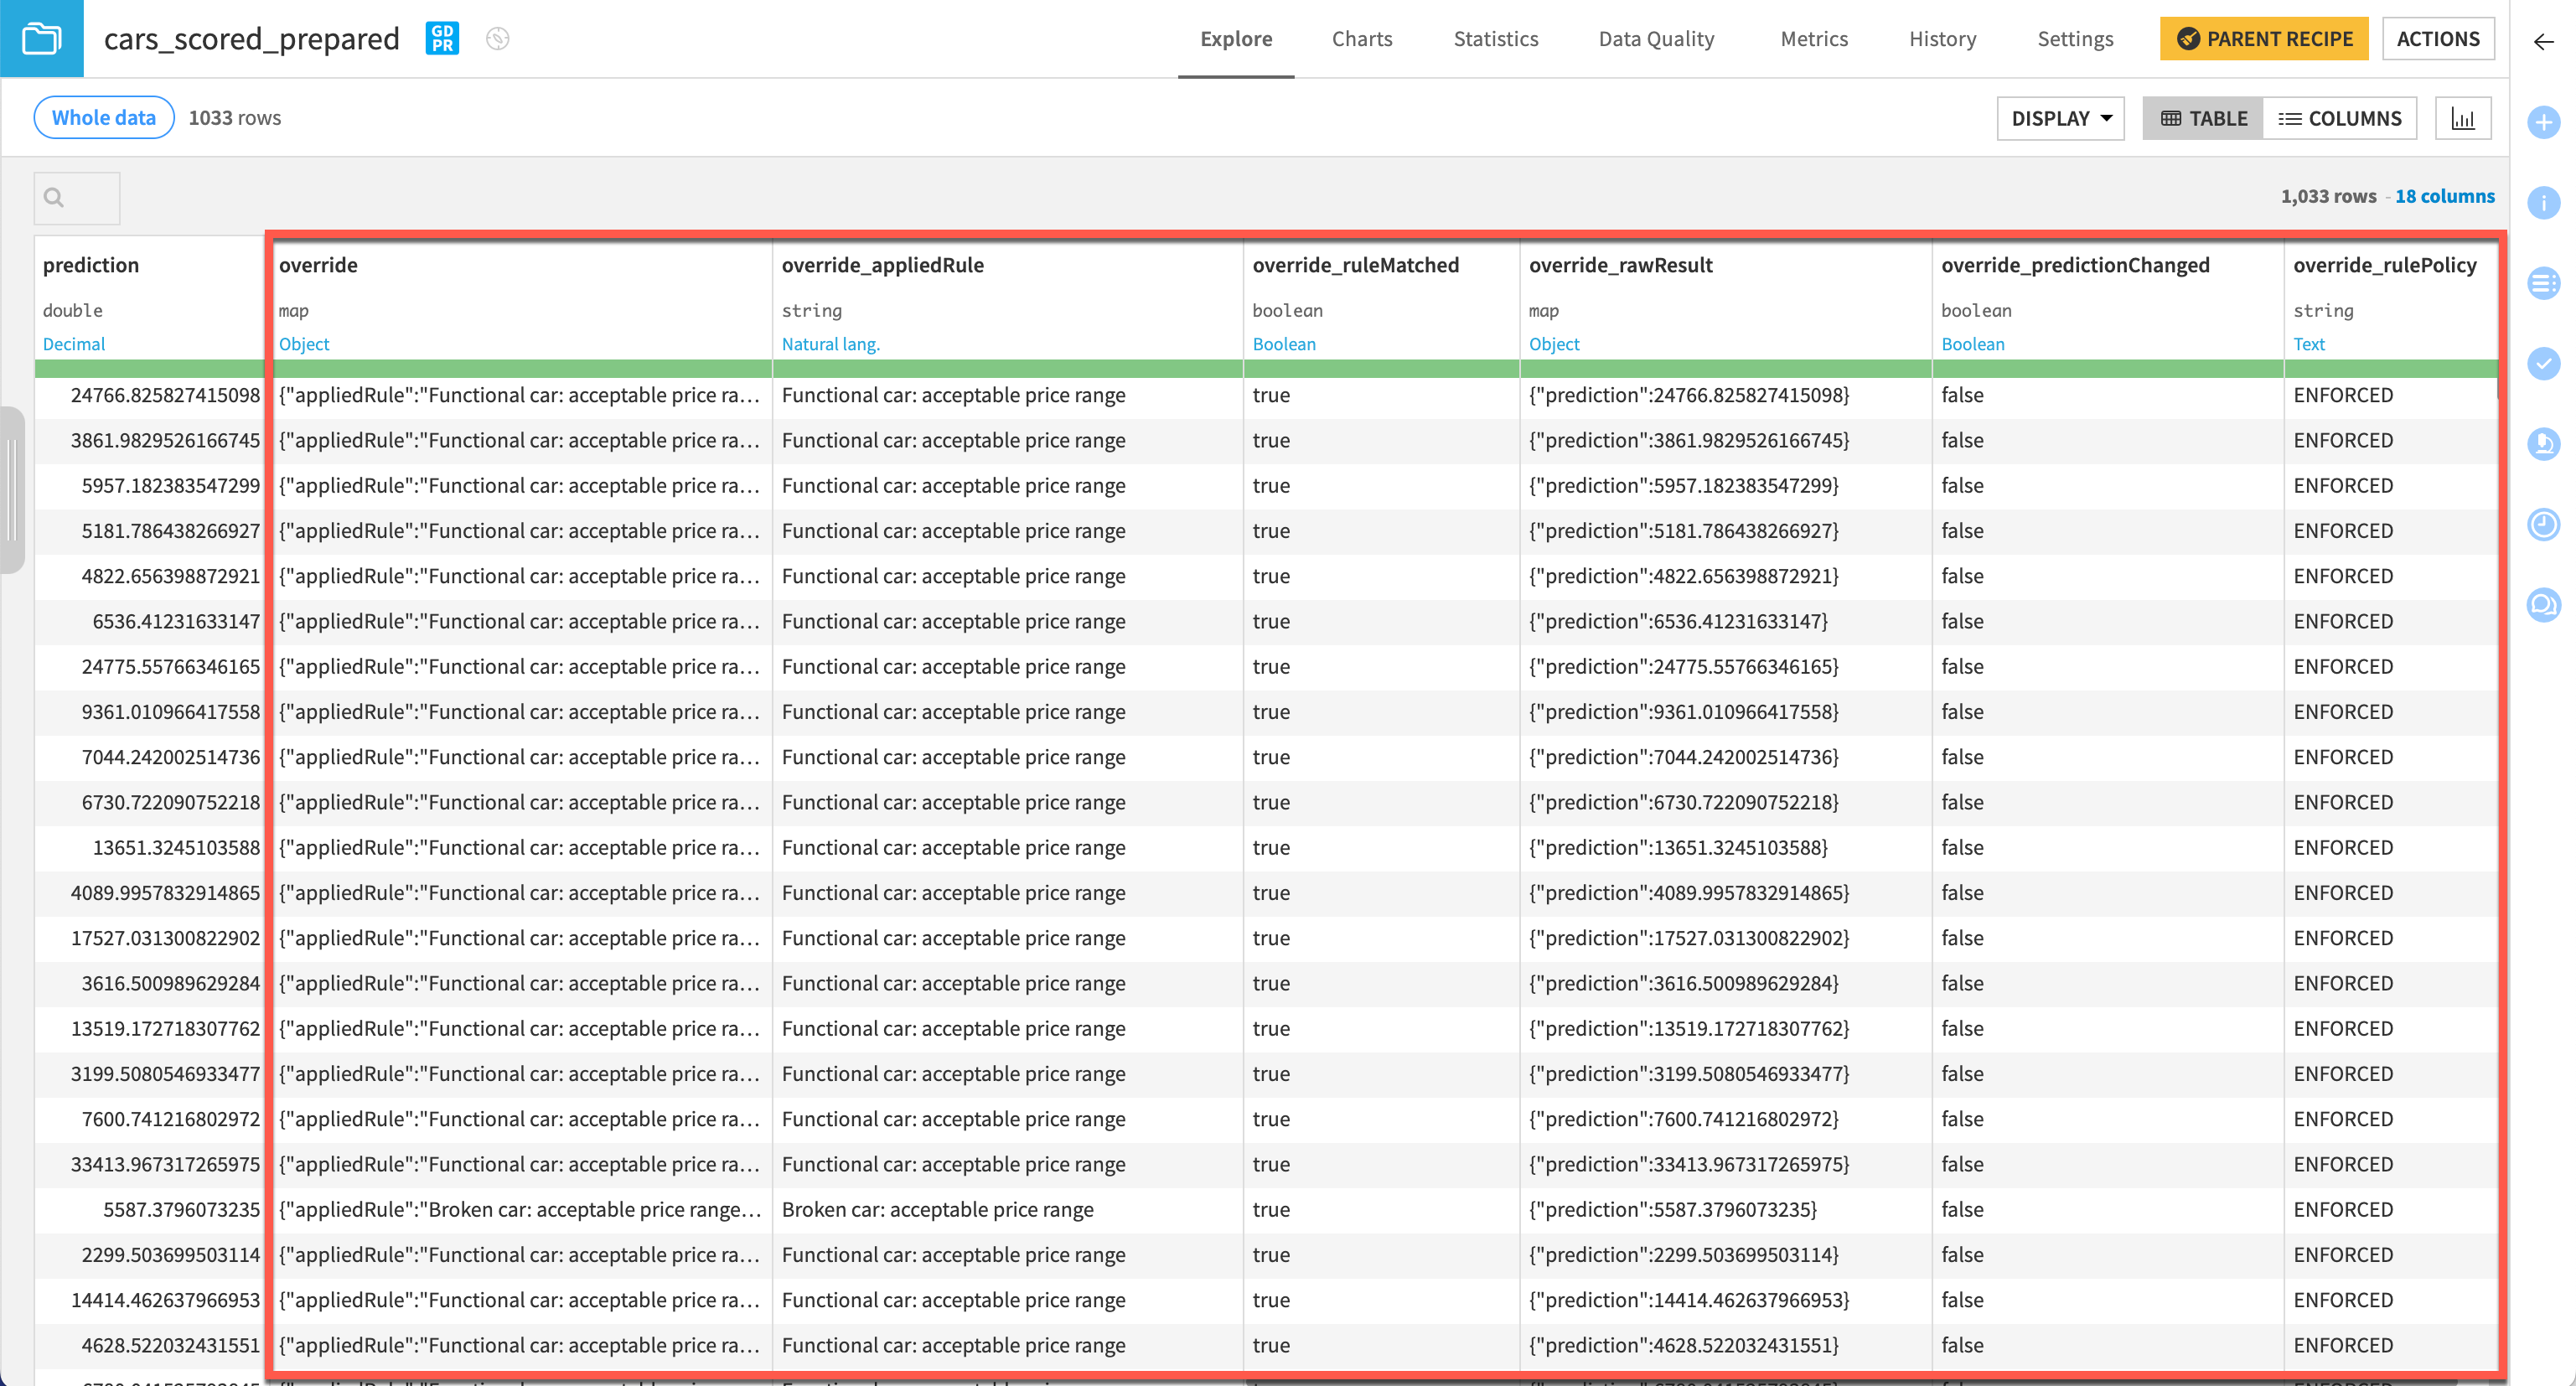
In this example, we can see that most of these first few rows matched the rule where the car condition was functional. However, since the raw predicted price was between $600 and $40,000, most of these predictions were left as is and weren’t overridden (override_predictionChanged column set to false).
On the other hand, if we filter to rows where override_predictionChanged is true, we see 9 instances where the raw prediction was outside the acceptable range, and so the price was overridden.
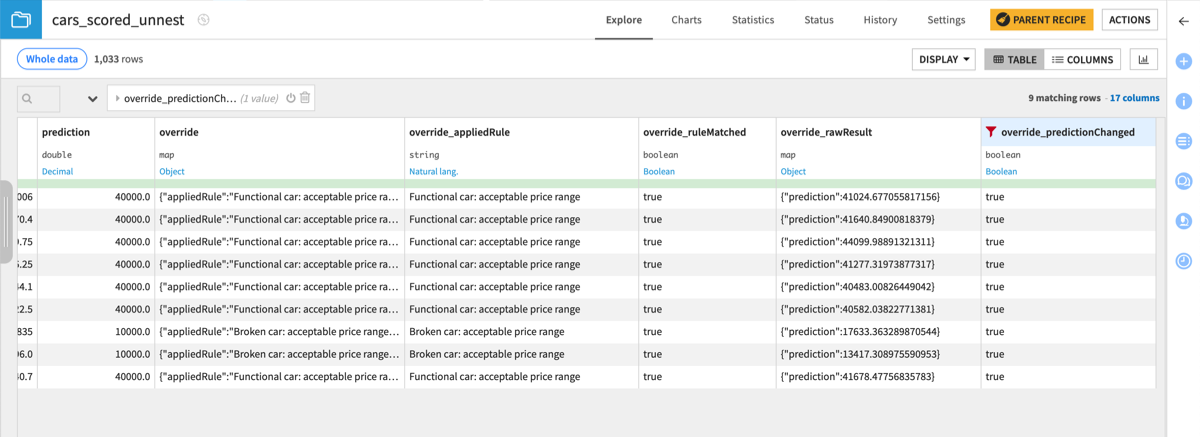
If you look at the first row, since the model’s raw prediction is above 41k (override_rawResult column) and the rule says a functional car must have a price between $600 and $40,000, the final price prediction provided in the prediction column is brought down to $40,000, the upper acceptable bound for this rule.
For the cars matching the broken car rule, the final price is overridden to $10,000, to respect the boundaries set in the override rule.
Next steps#
Try model overrides in your own projects, to ensure safe predictions for known cases, comply with regulations, and increase trust in your models.