
Concept | Evaluating group fairness#
When evaluating model fairness, there are three types to consider: group fairness, individual fairness, and counterfactual fairness. In this lesson, out of these three types, we’ll hone in on evaluating group fairness.
For group fairness, we want to ensure that a model performs equally across subgroups of the sensitive attribute. When evaluating classification models, we can use the confusion matrix to calculate some helpful statistics on model performance.
Confusion matrix#
The confusion matrix is a cross-tab that shows the number of correct and incorrect predictions among the different classes of a model. Below is an example matrix for a model used to predict whether an email is spam or not.
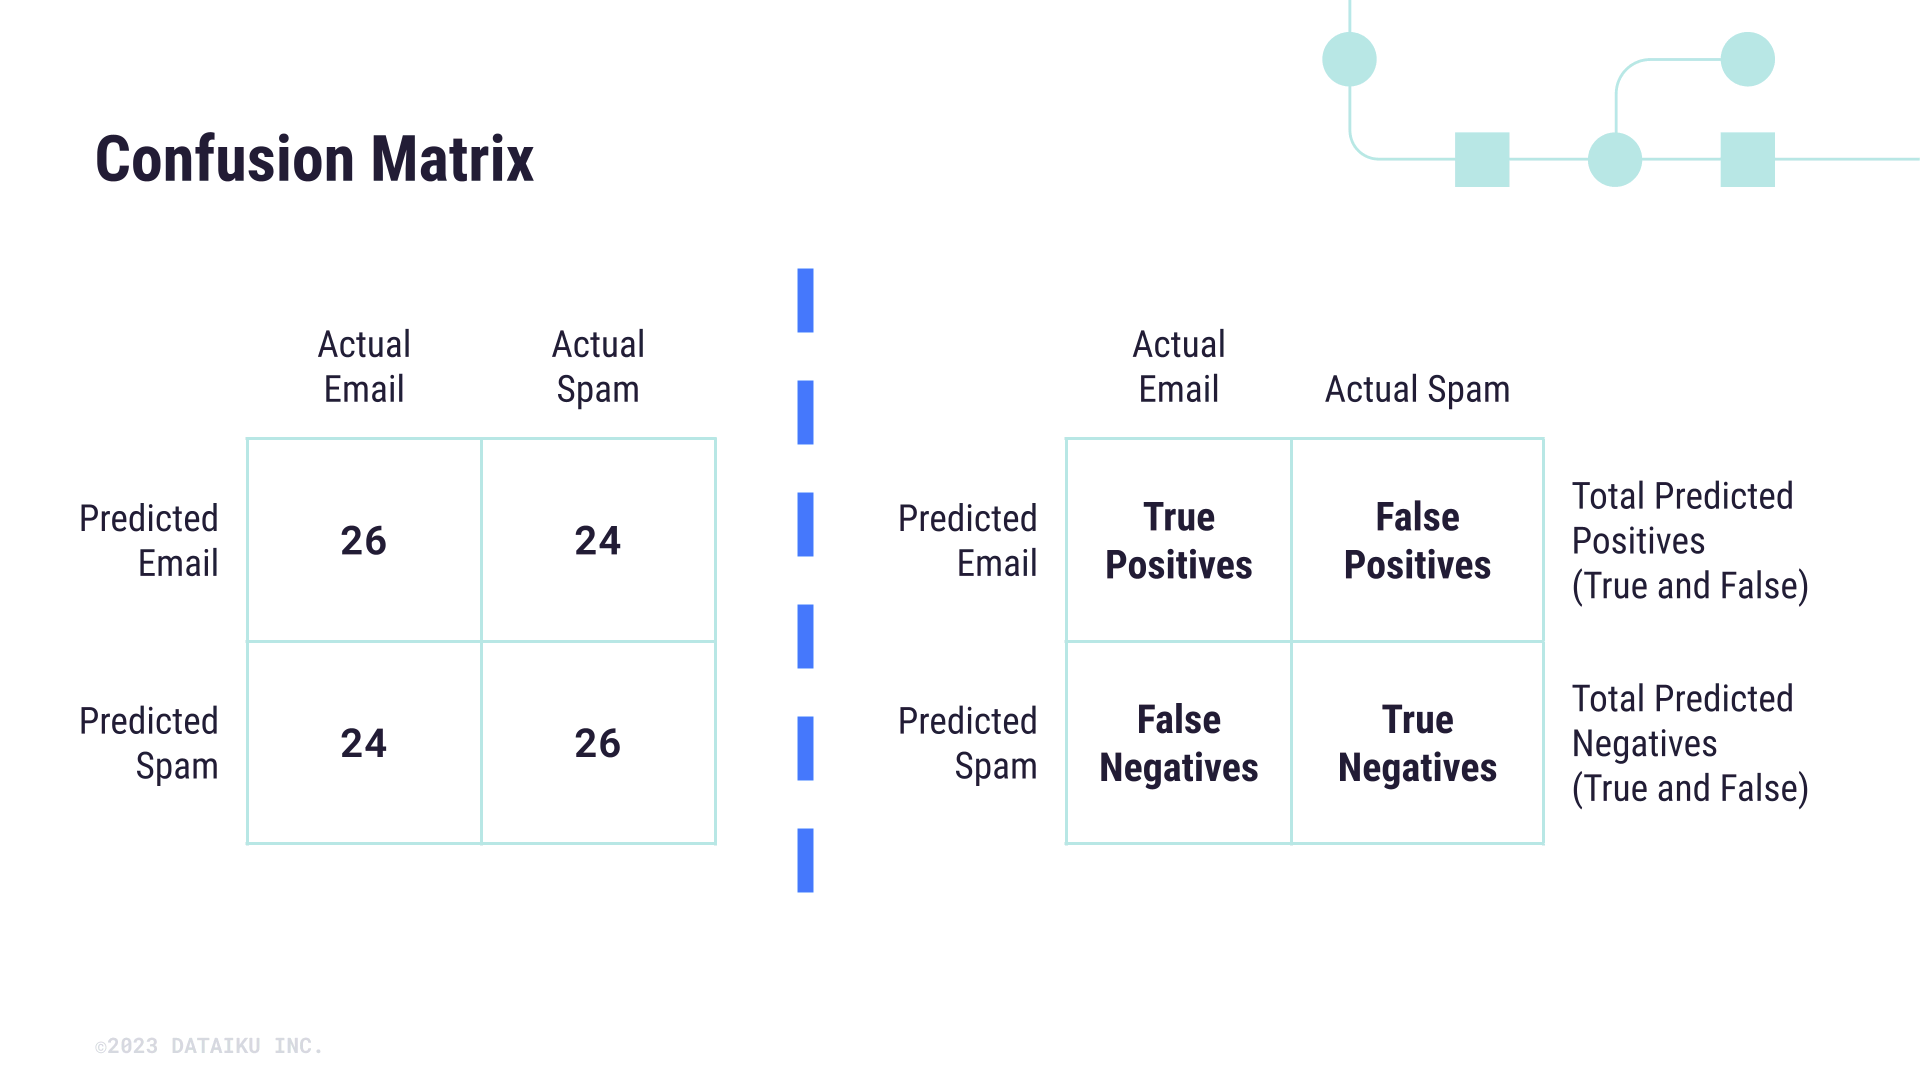
In this case, we can calculate things like precision, recall, and accuracy by measuring different ratios of correct or incorrect predictions. For example, recall measures the ratio of true predicted positives against all actual positives, that is, how well the model computes true positive cases.
When it comes to Responsible AI and model fairness, the confusion matrix serves as a baseline for group fairness metrics in the literature. Here we’ll focus on four specific metrics that are most commonly used to assess whether a model is biased among groups of a sensitive attribute.
Fairness metrics#
We can evaluate our model fairness using the following metrics:
Demographic Parity: all groups defined by a sensitive attribute have an equal Positive Rate.
Equalized Odds: all groups defined by a sensitives attribute have equal True Positive Rates and equal False Positive Rates.
Predictive Rate Parity: all groups defined by a sensitive attribute have equal Positive Predictive Values.
Equality of Opportunity: all groups defined by a sensitive attribute have equal True Positive Rates.
Note
This is a non-comprehensive list of fairness metrics. Visit this tutorial about fairness definitions to learn about more types of fairness metrics.
Each metric relates how well the model performs according to different aspects of the confusion matrix. Some metrics are more relaxed than others. An important caveat is that it’s impossible to jointly optimize a model for more than one group fairness metric, which means you should know which metric to optimize for before beginning the model building process.
How can you determine the right metric for your use case? One framework you can use is the Fairness Tree from the Aequitas toolkit (shown below), which provides paths of questions and considerations that lead you to certain motivating ideas for model experimentation. This framework aligns with the notion of harms of representation and harms of allocation but details more specific use cases and types of fairness to consider. It’s a good starting point for any conversation on model harms.
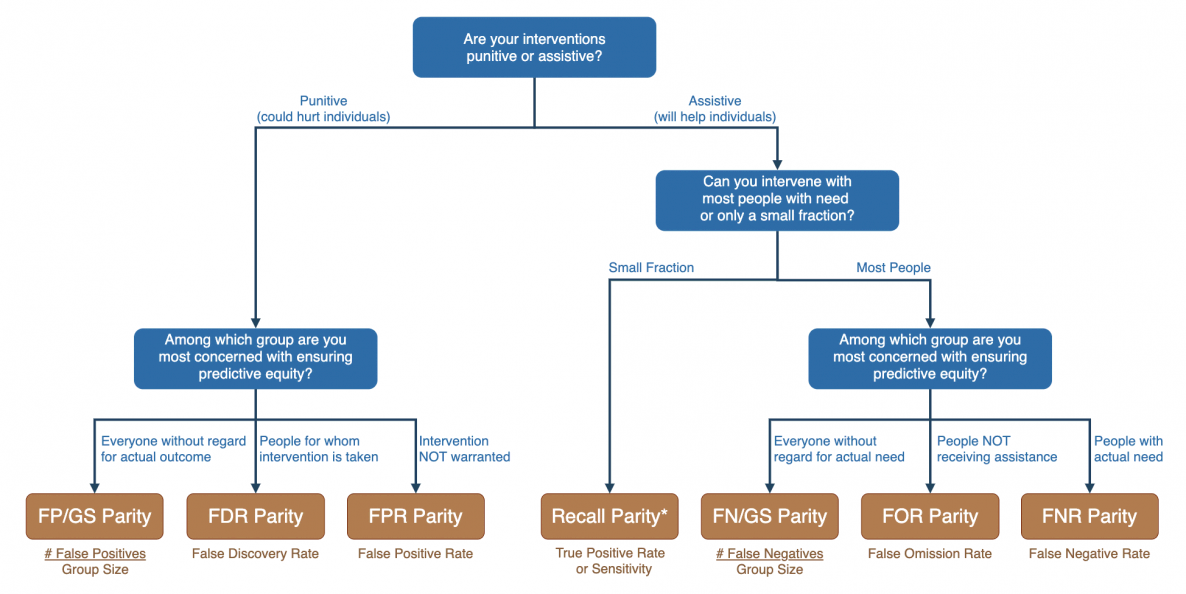
Credit: Center for Data Science and Public Policy, University of Chicago#
Note
The concept and measurement of fairness that we’ve described are focused only on supervised classification models. Fairness for regression models or continuous outcomes isn’t the same.
A few experimental methods to test fairness on regression models exist, most notably statistical parity and bounded group loss. These have been implemented in open-source packages from Microsoft and scikit-learn. Another approach is to measure overall model performance across different groups of the sensitive attribute, which can be conducted in Dataiku using the subpopulation analysis feature.