
How-to | Set up What if analysis for a dashboard consumer#
After building a model, you want to enable dashboard consumers to perform What if analyses using the model. Learn how to publish the What if? feature of visual ML to a dashboard.
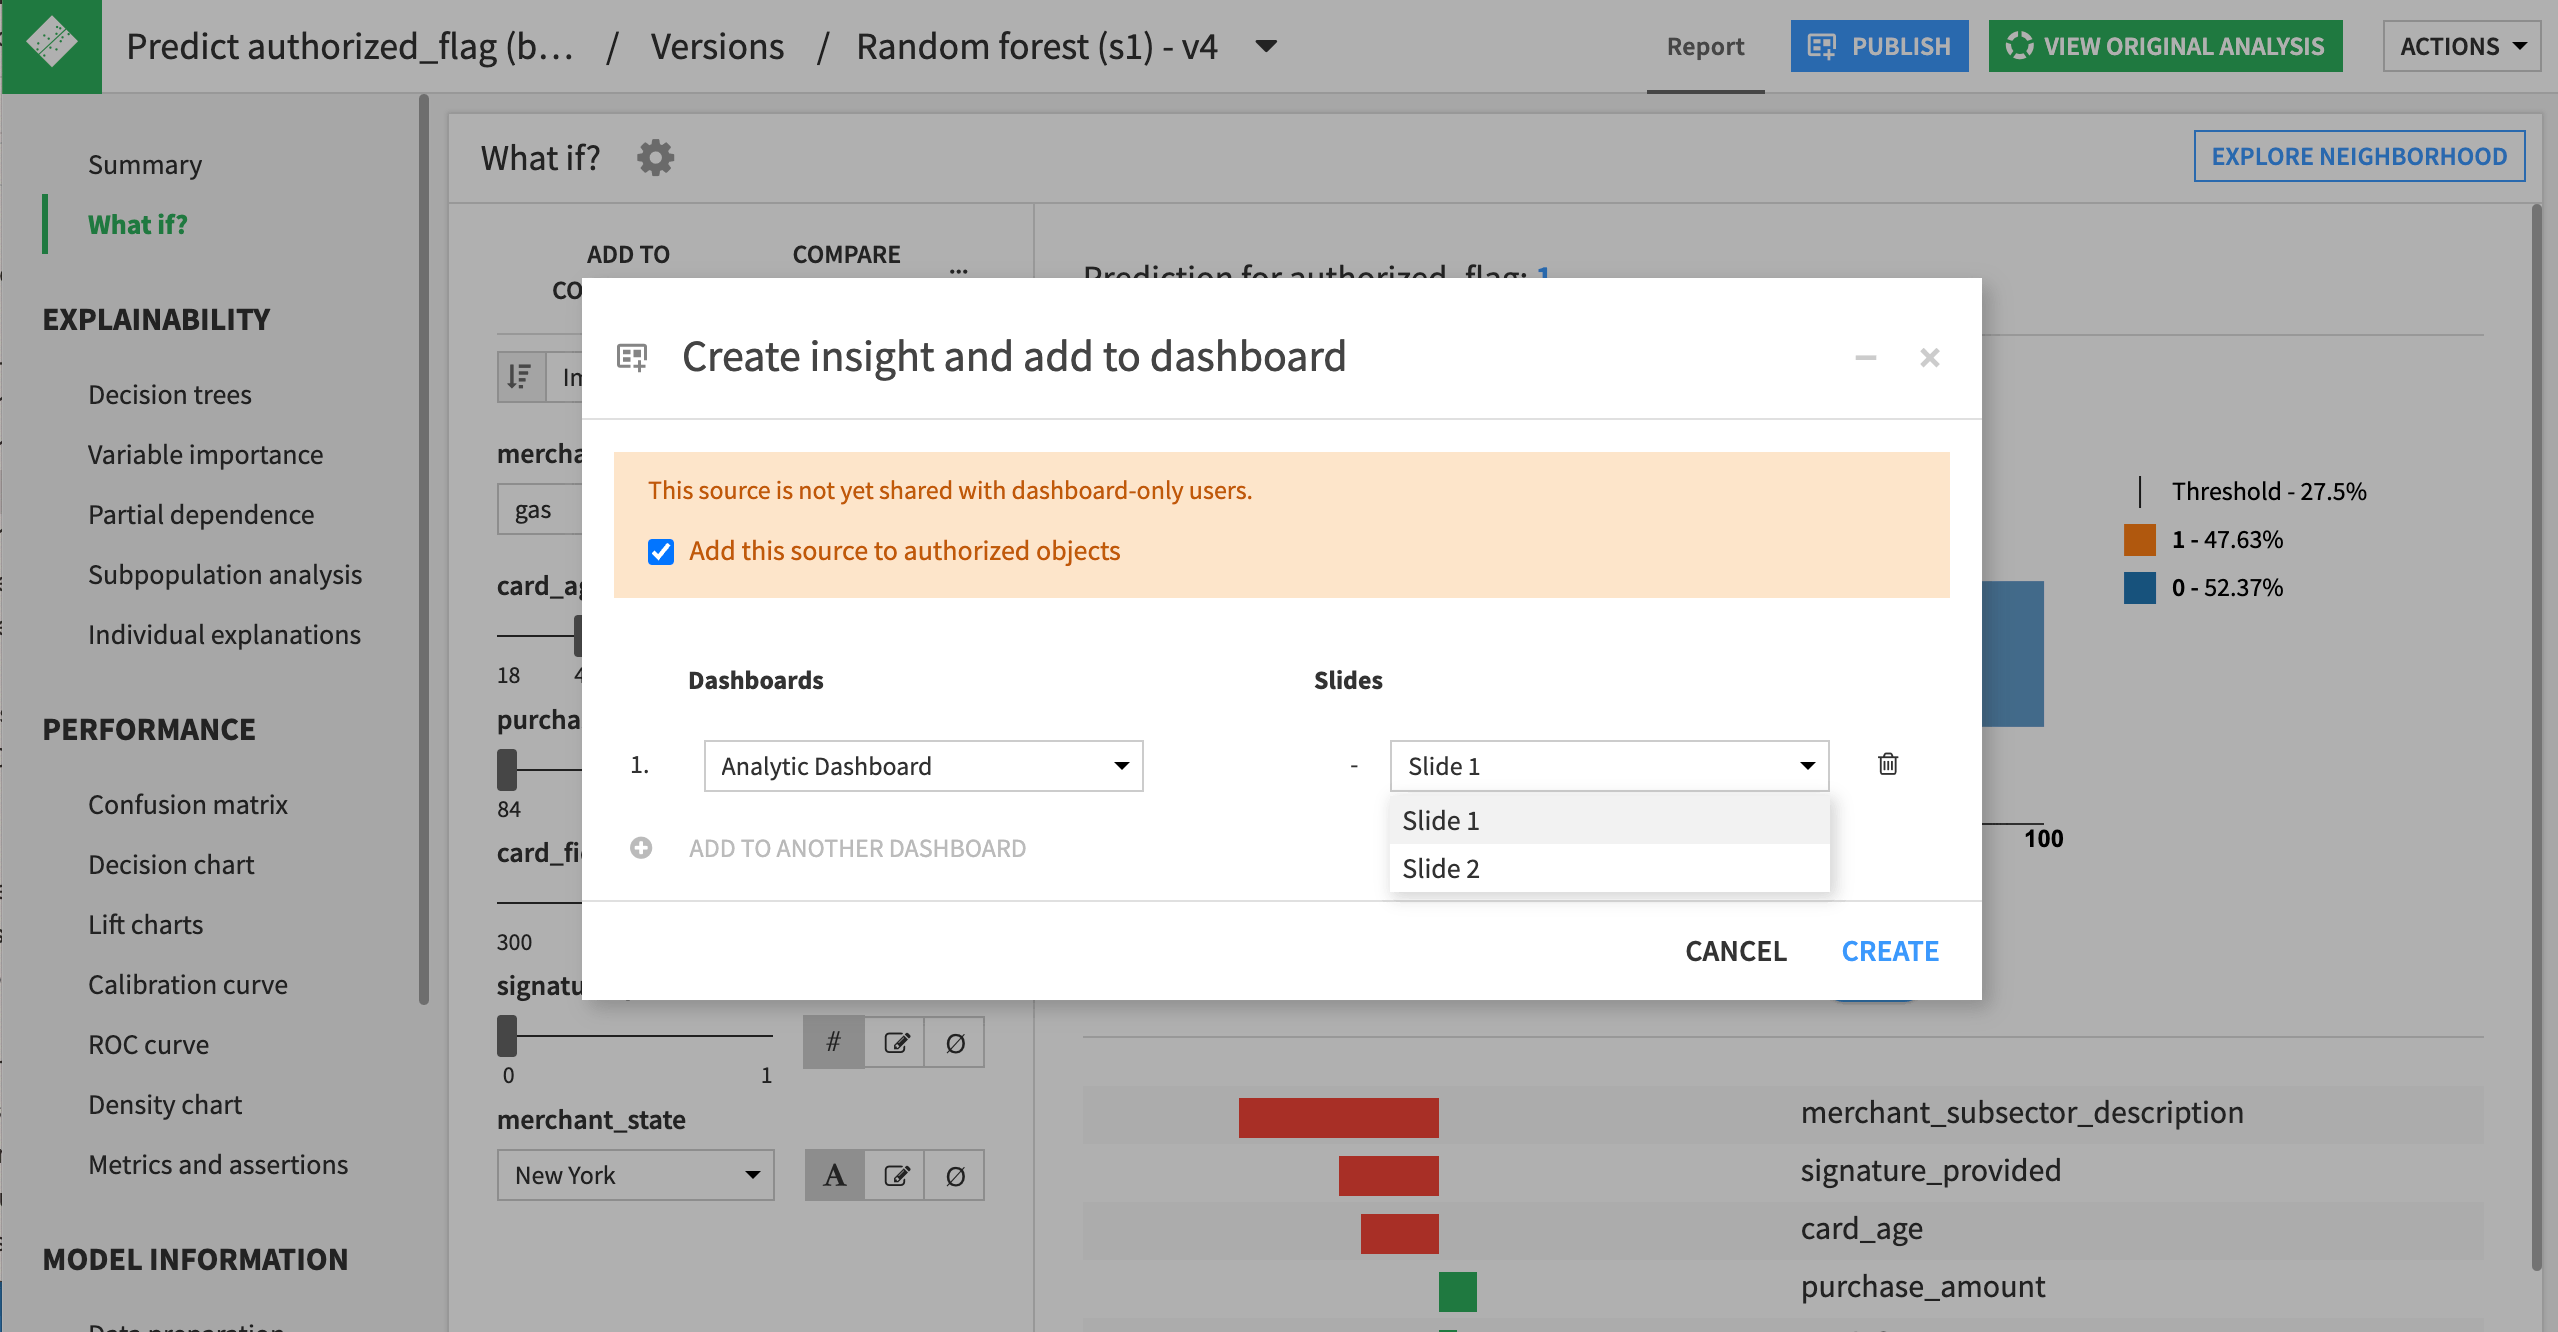
From the What if? panel of a deployed model, click Publish and then choose the dashboard and page where you want to add the analysis.
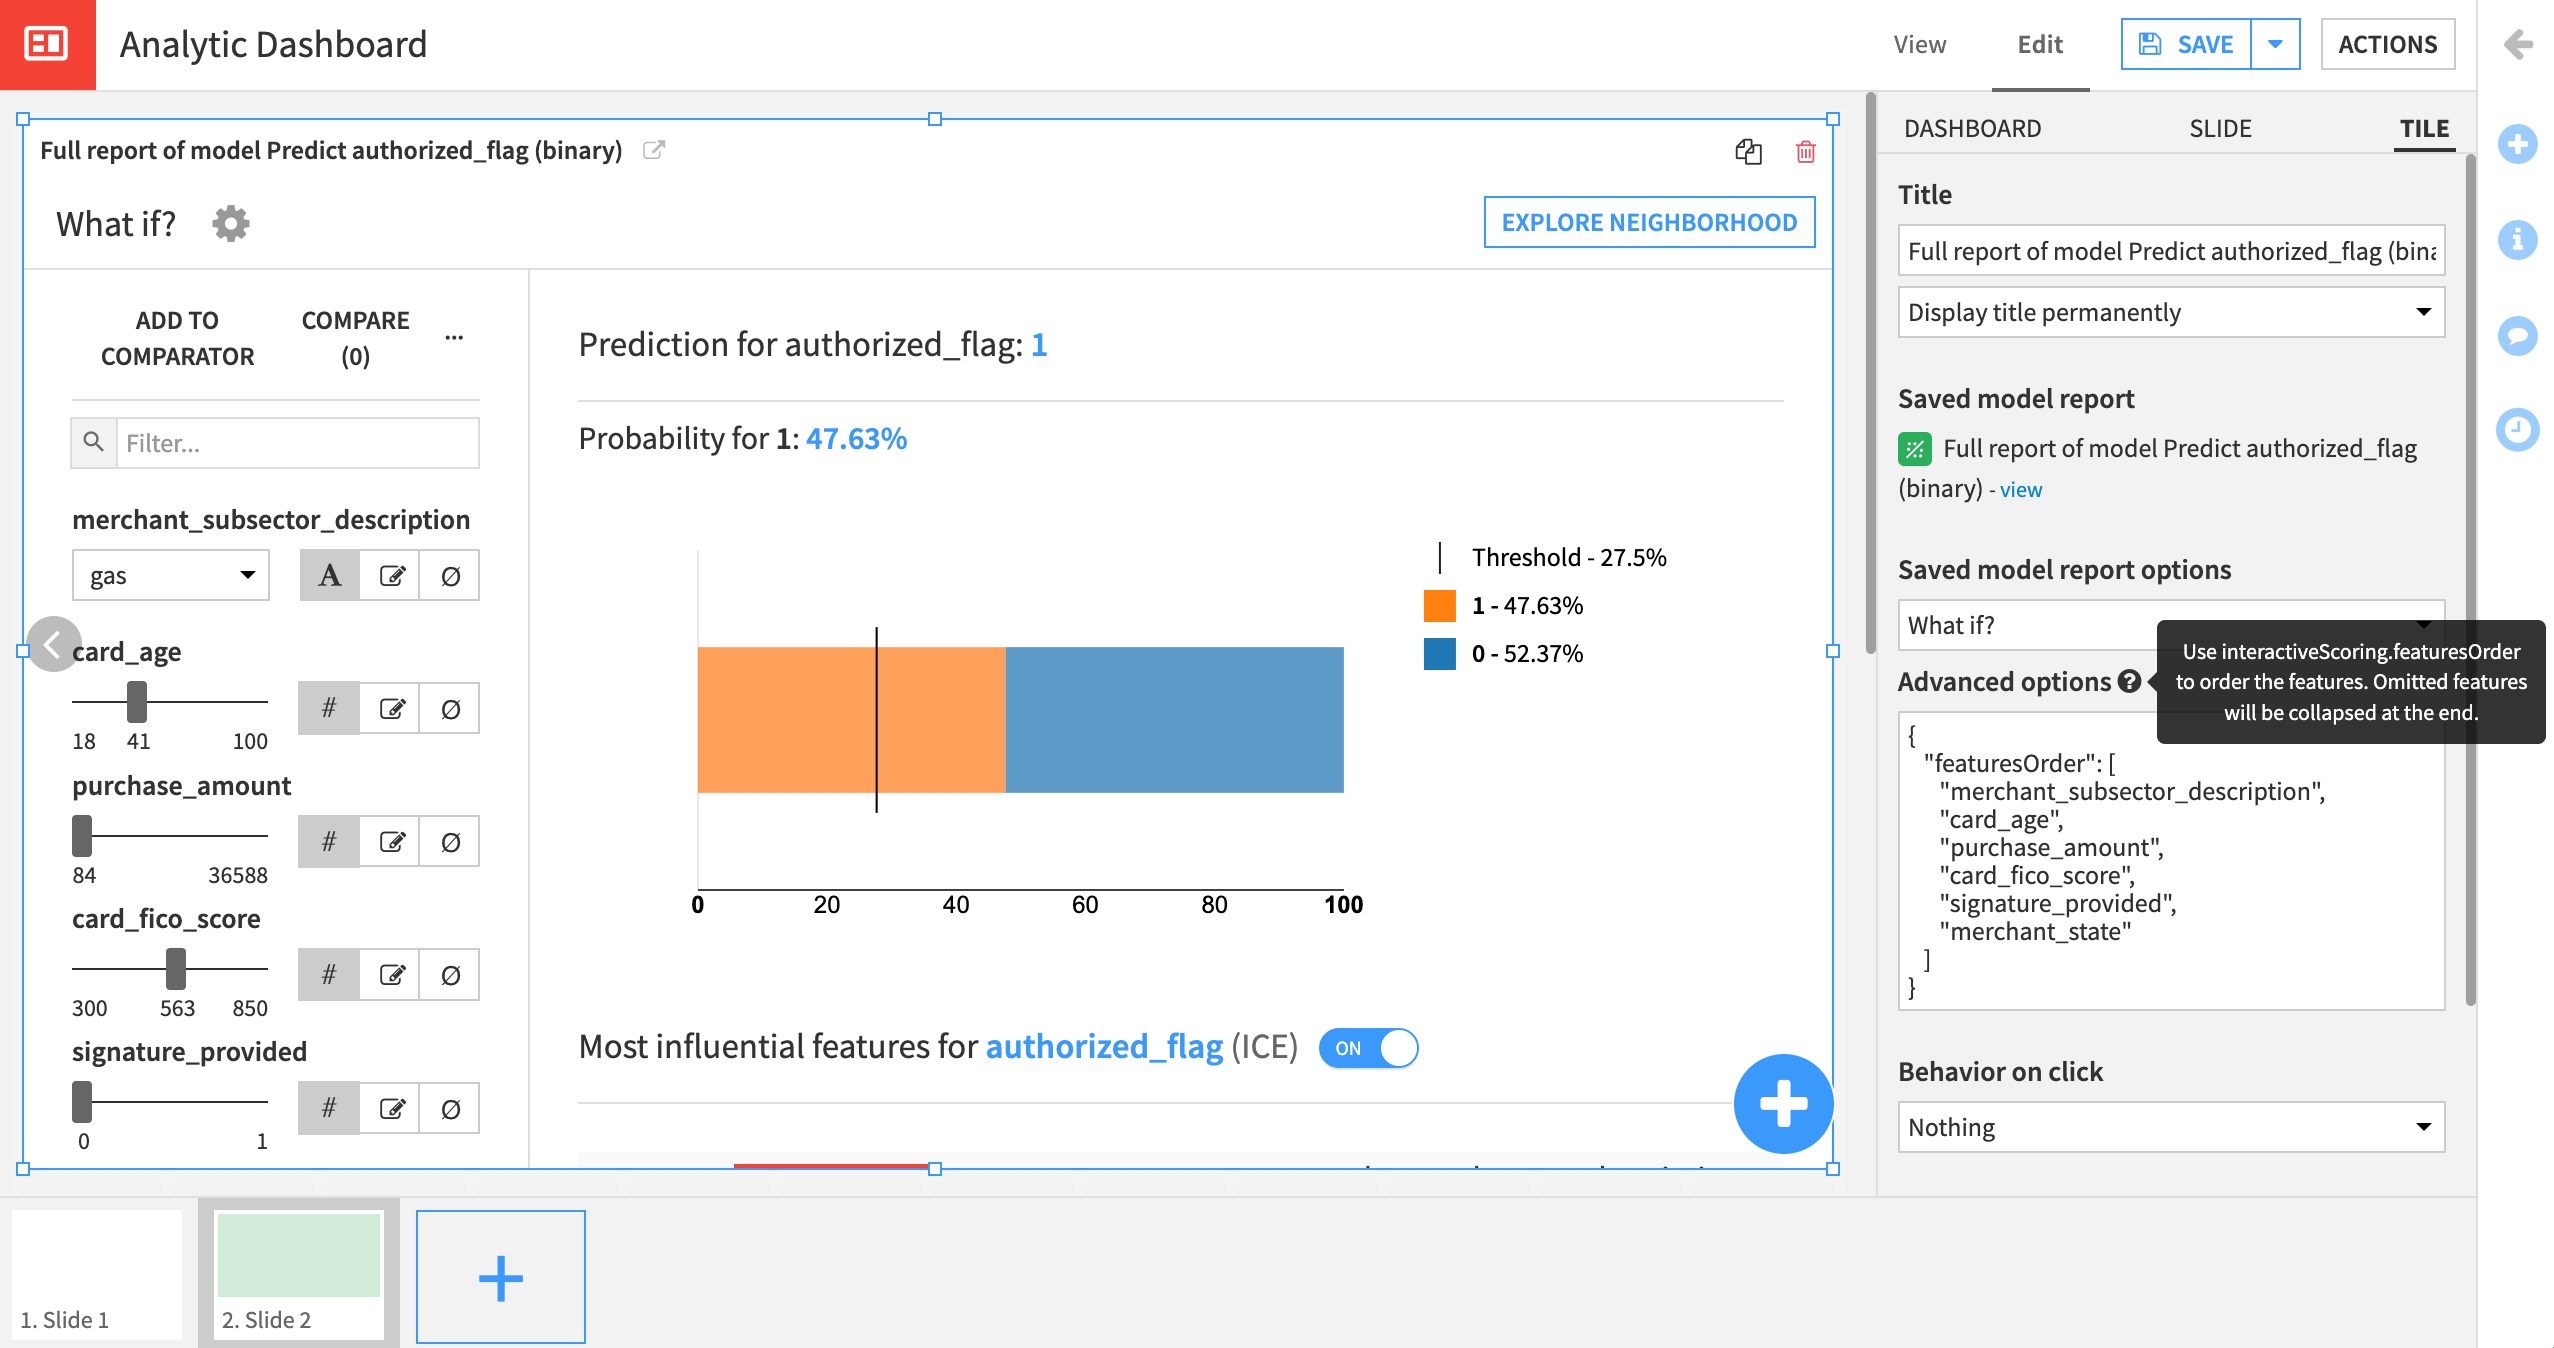
In the What if? tile, you can edit the properties of the tile to reorder the list of features, or hide certain features from view.
A useful practice is to also provide a dataset tile on the page, so that dashboard consumers can copy rows from the dataset to more easily create What if scenarios.