Concept | The Result tab within the visual ML tool#
Watch the video

The Models page of a visual analysis consists of a Result tab that’s useful for comparing model performance across different algorithms and training sessions. By default, the models are grouped by Session. However, we can select the Models view to assess all models in one window, or the Table view to see all models along with more detailed metrics.
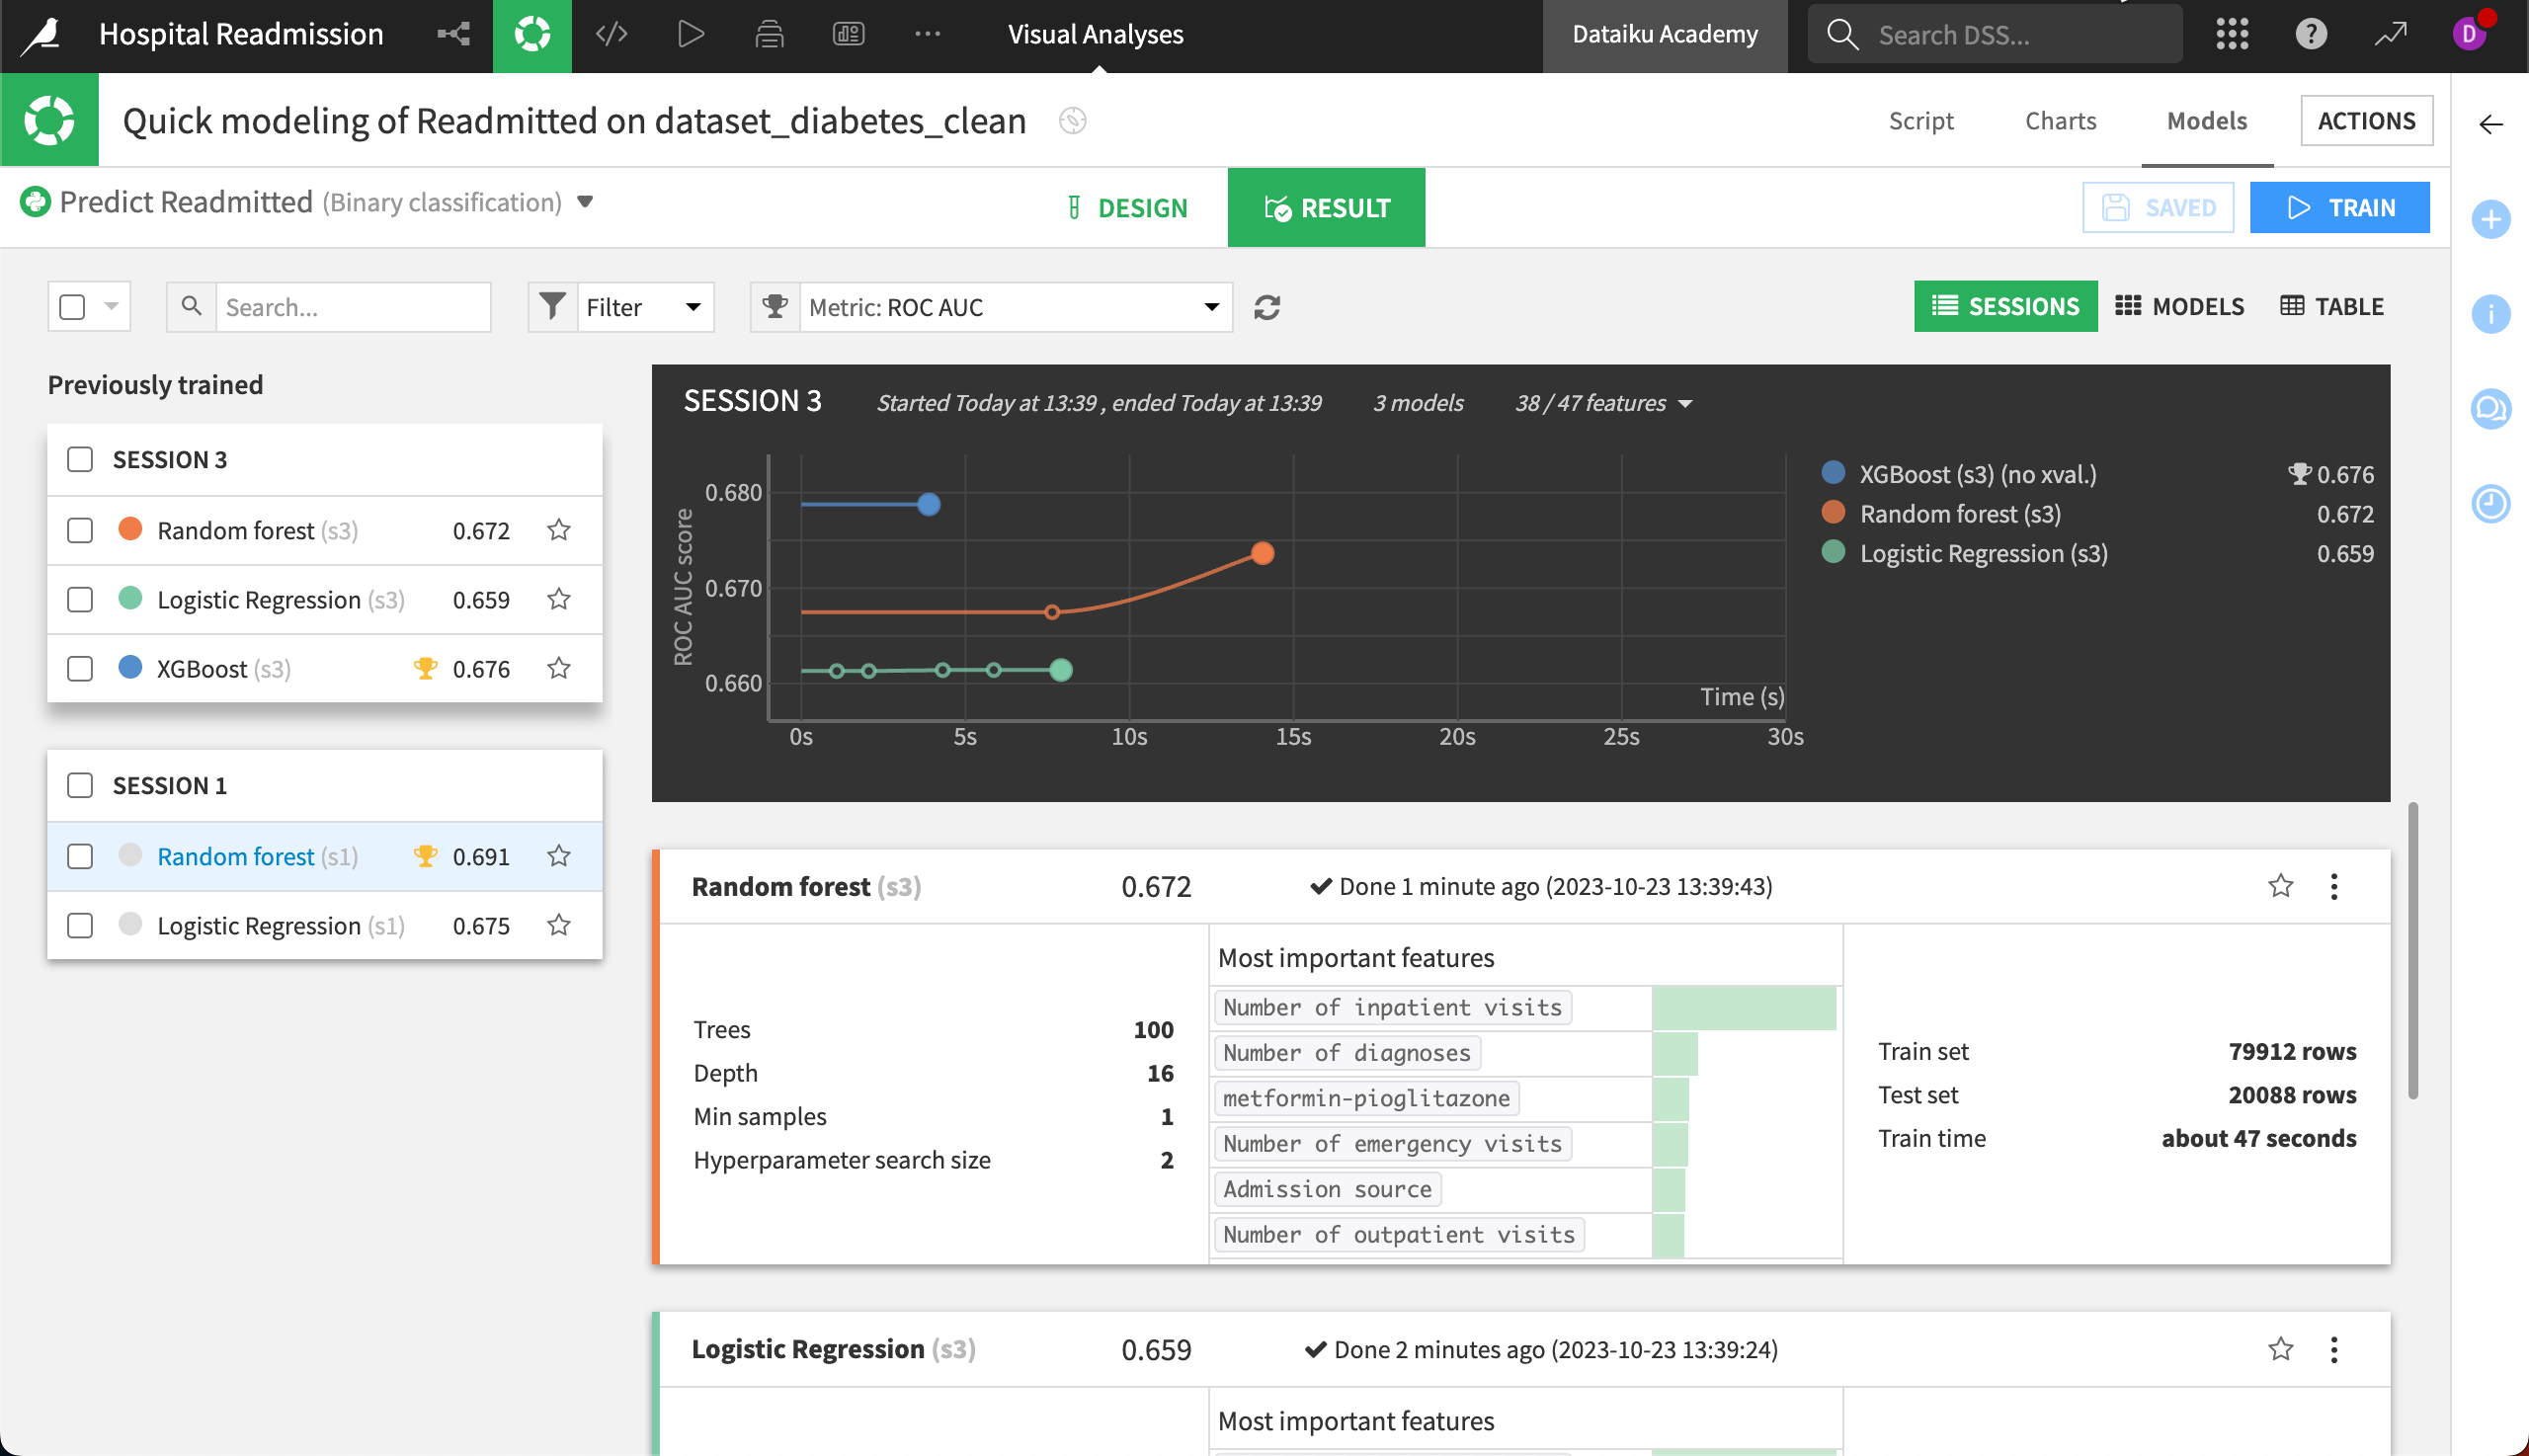
The Result tab also lets us evaluate different modeling sessions, and revert to previous model designs.
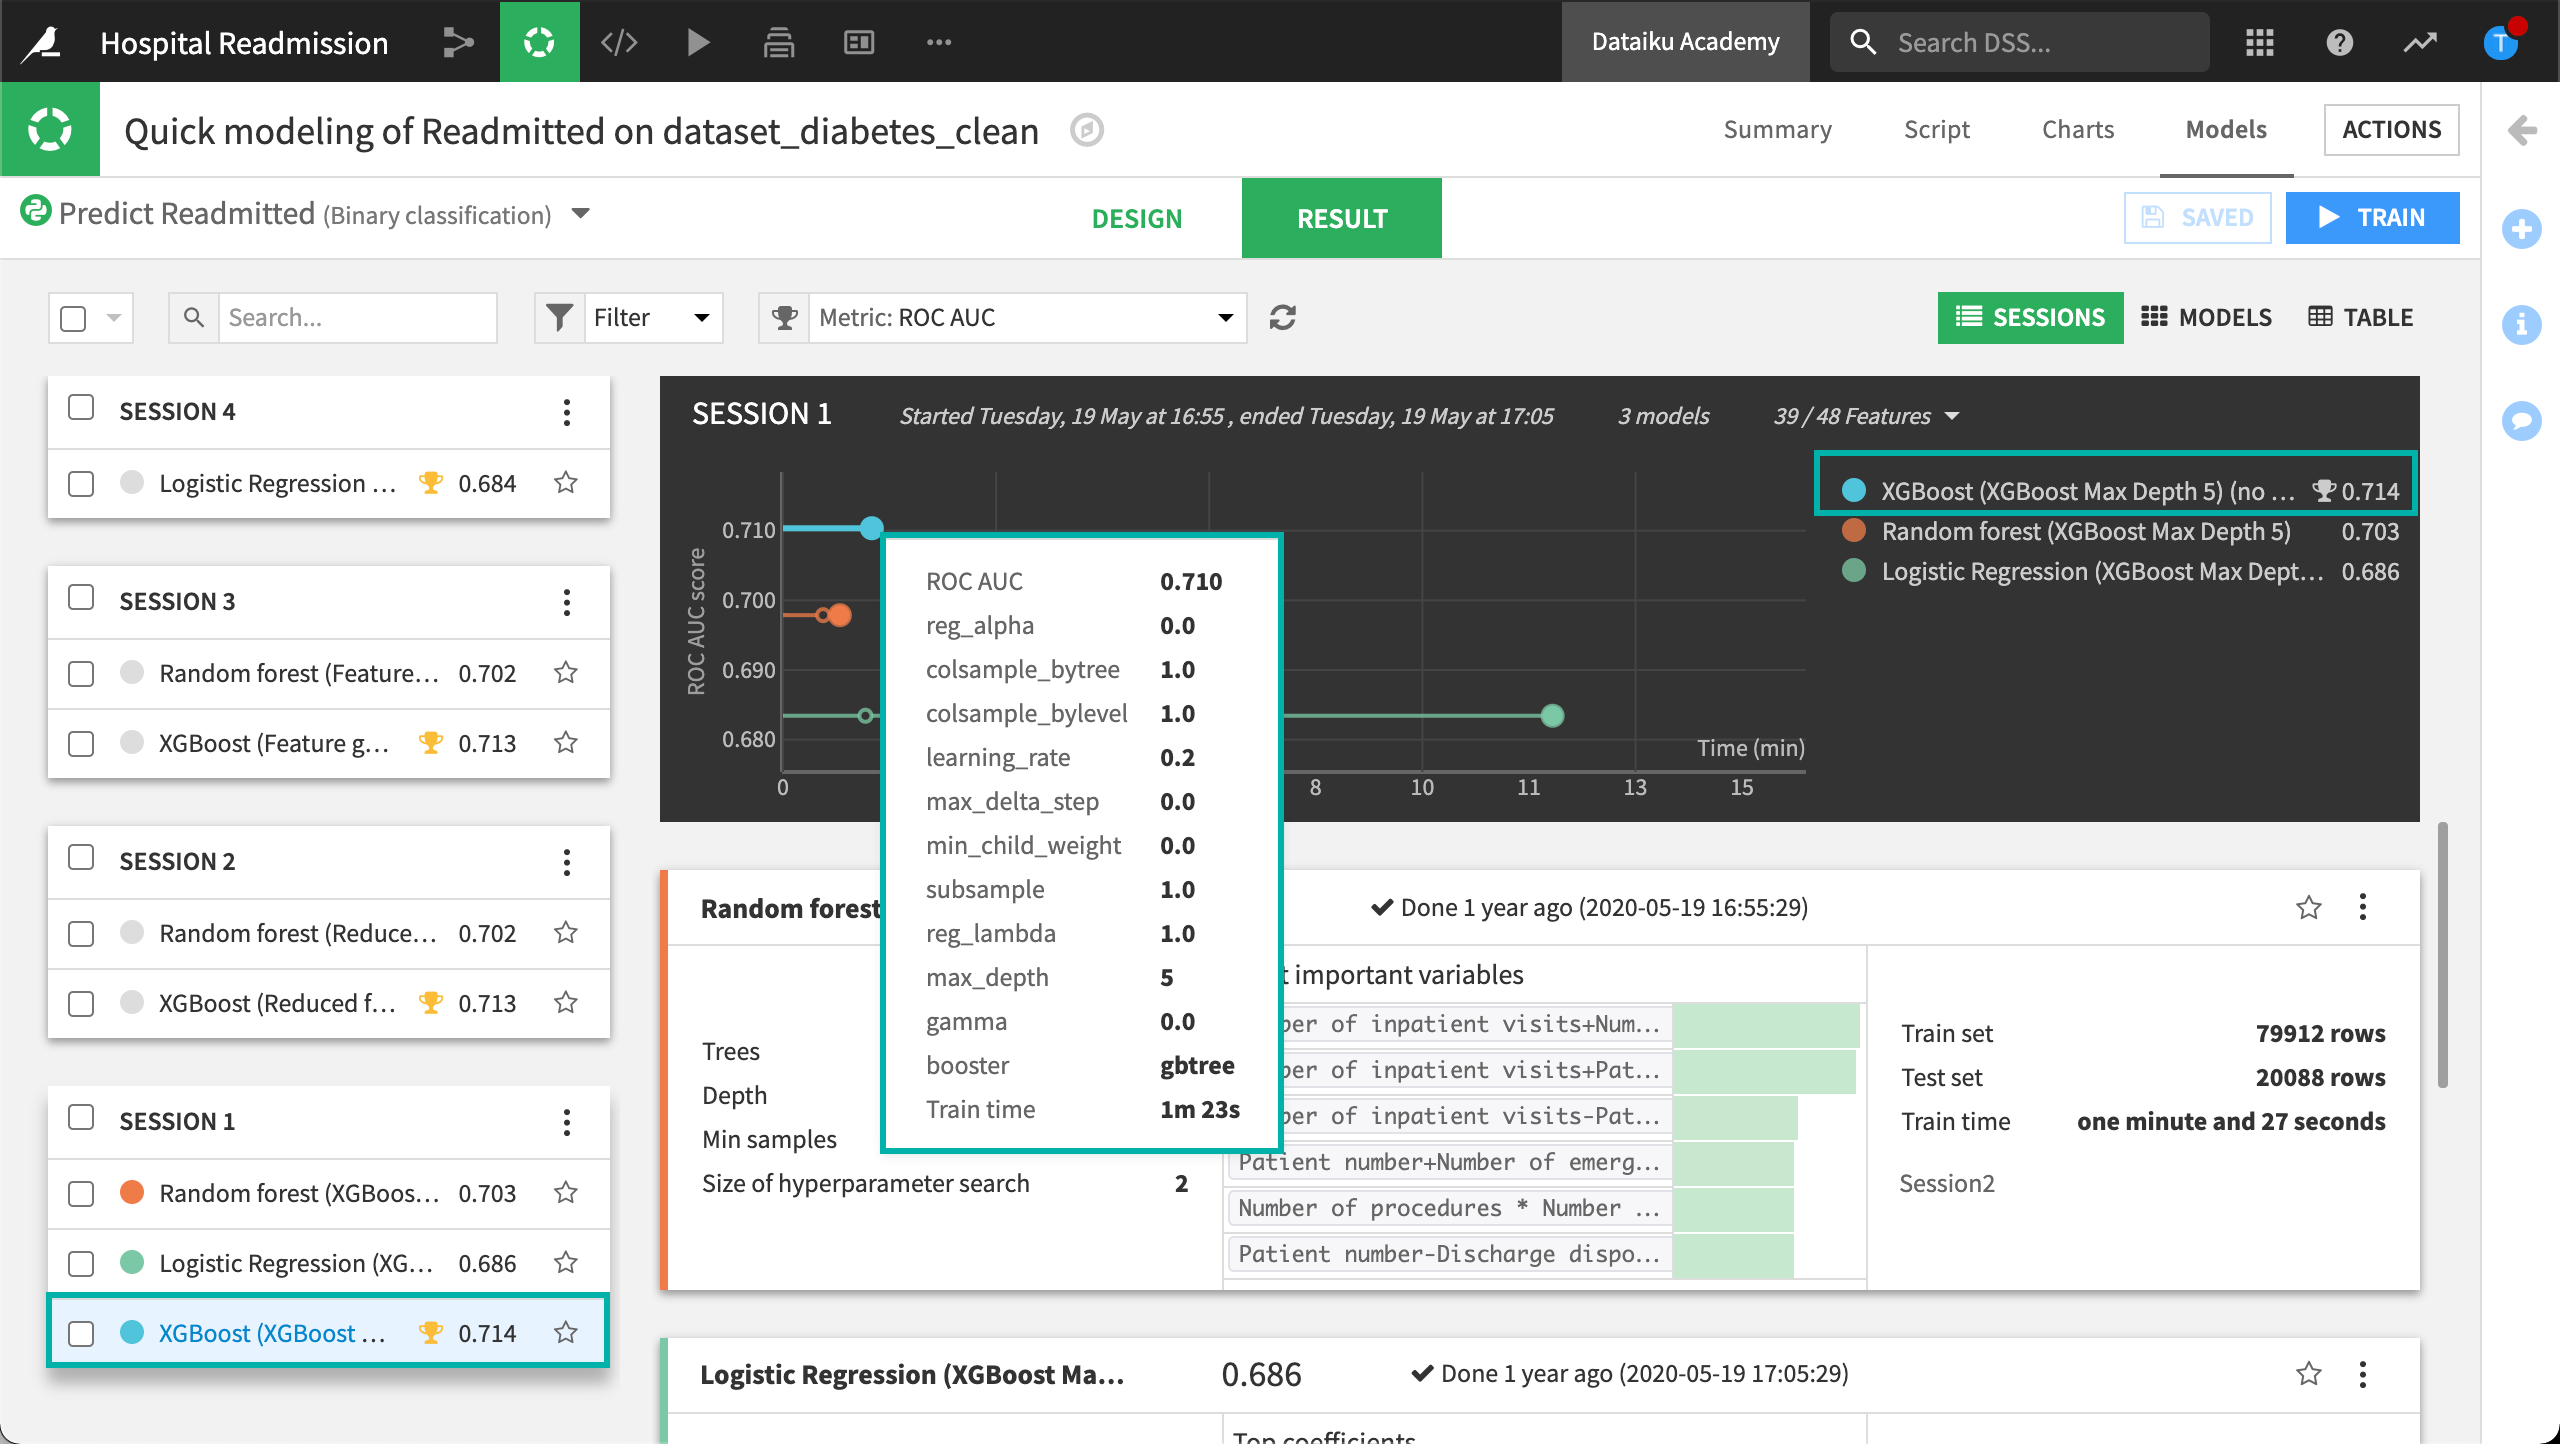
A session provides the following information: a chart of the models that were trained, the scores and details of each iteration of the grid search, and the amount of time that the full model training process took. Dataiku automatically selects the best performing model from the grid search.
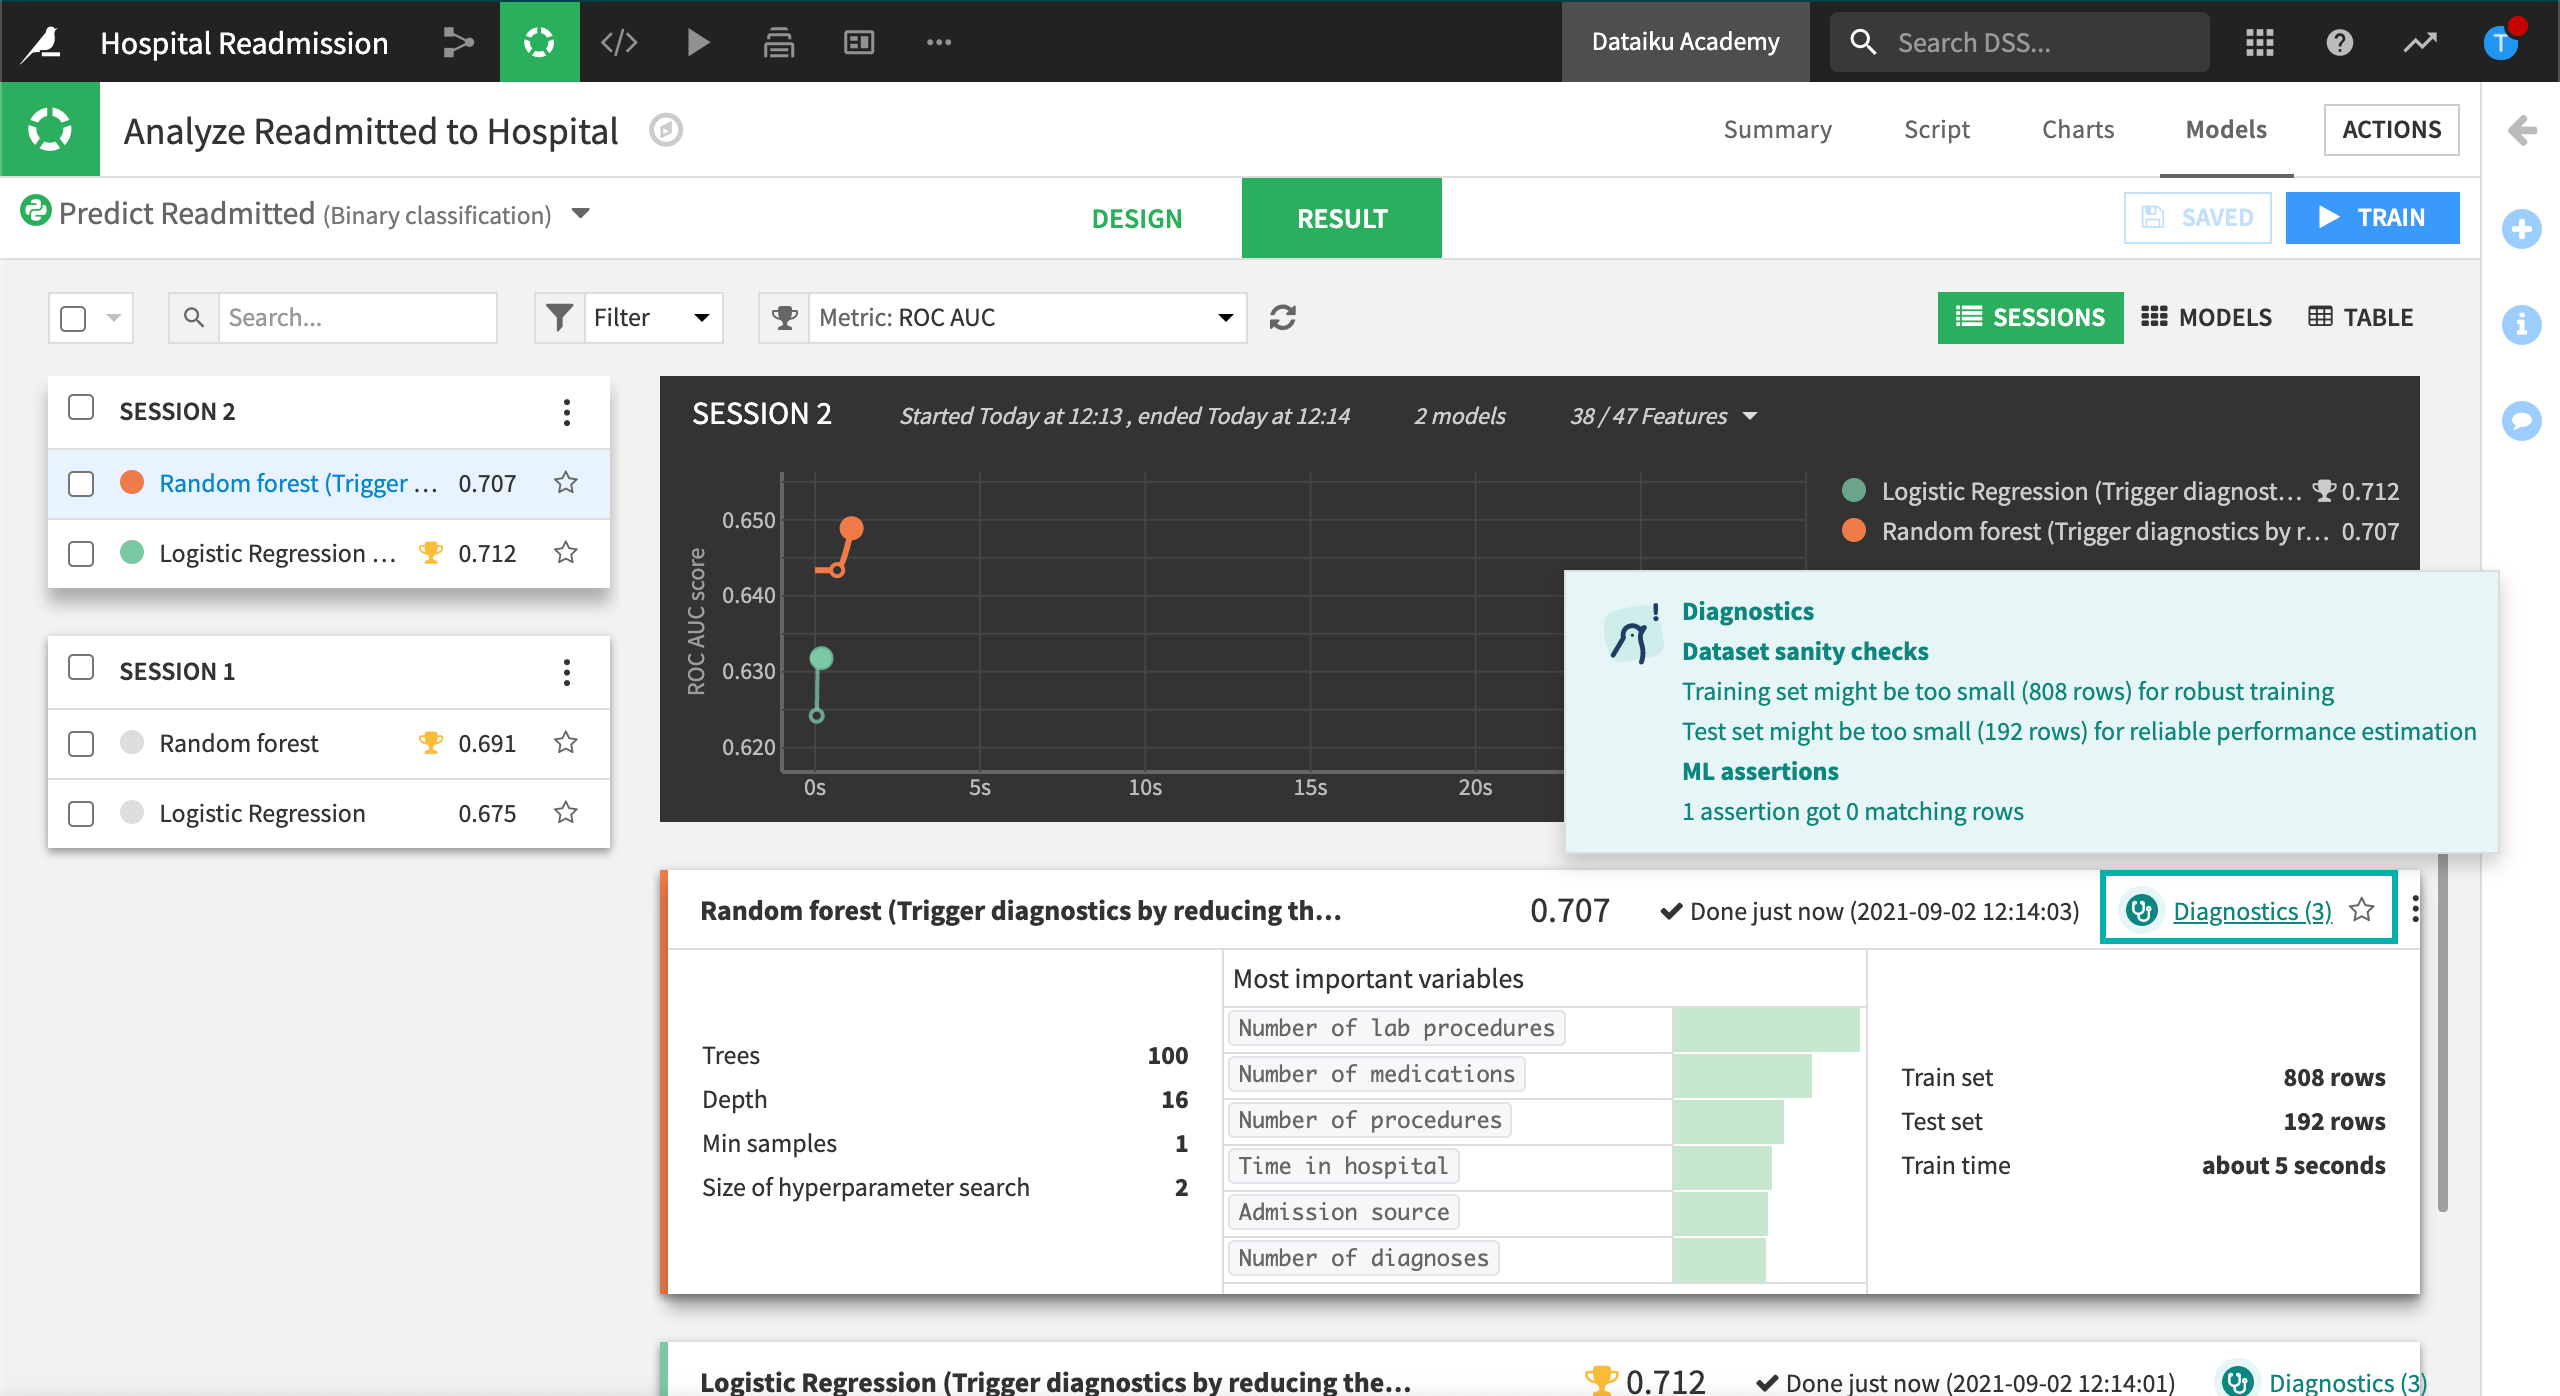
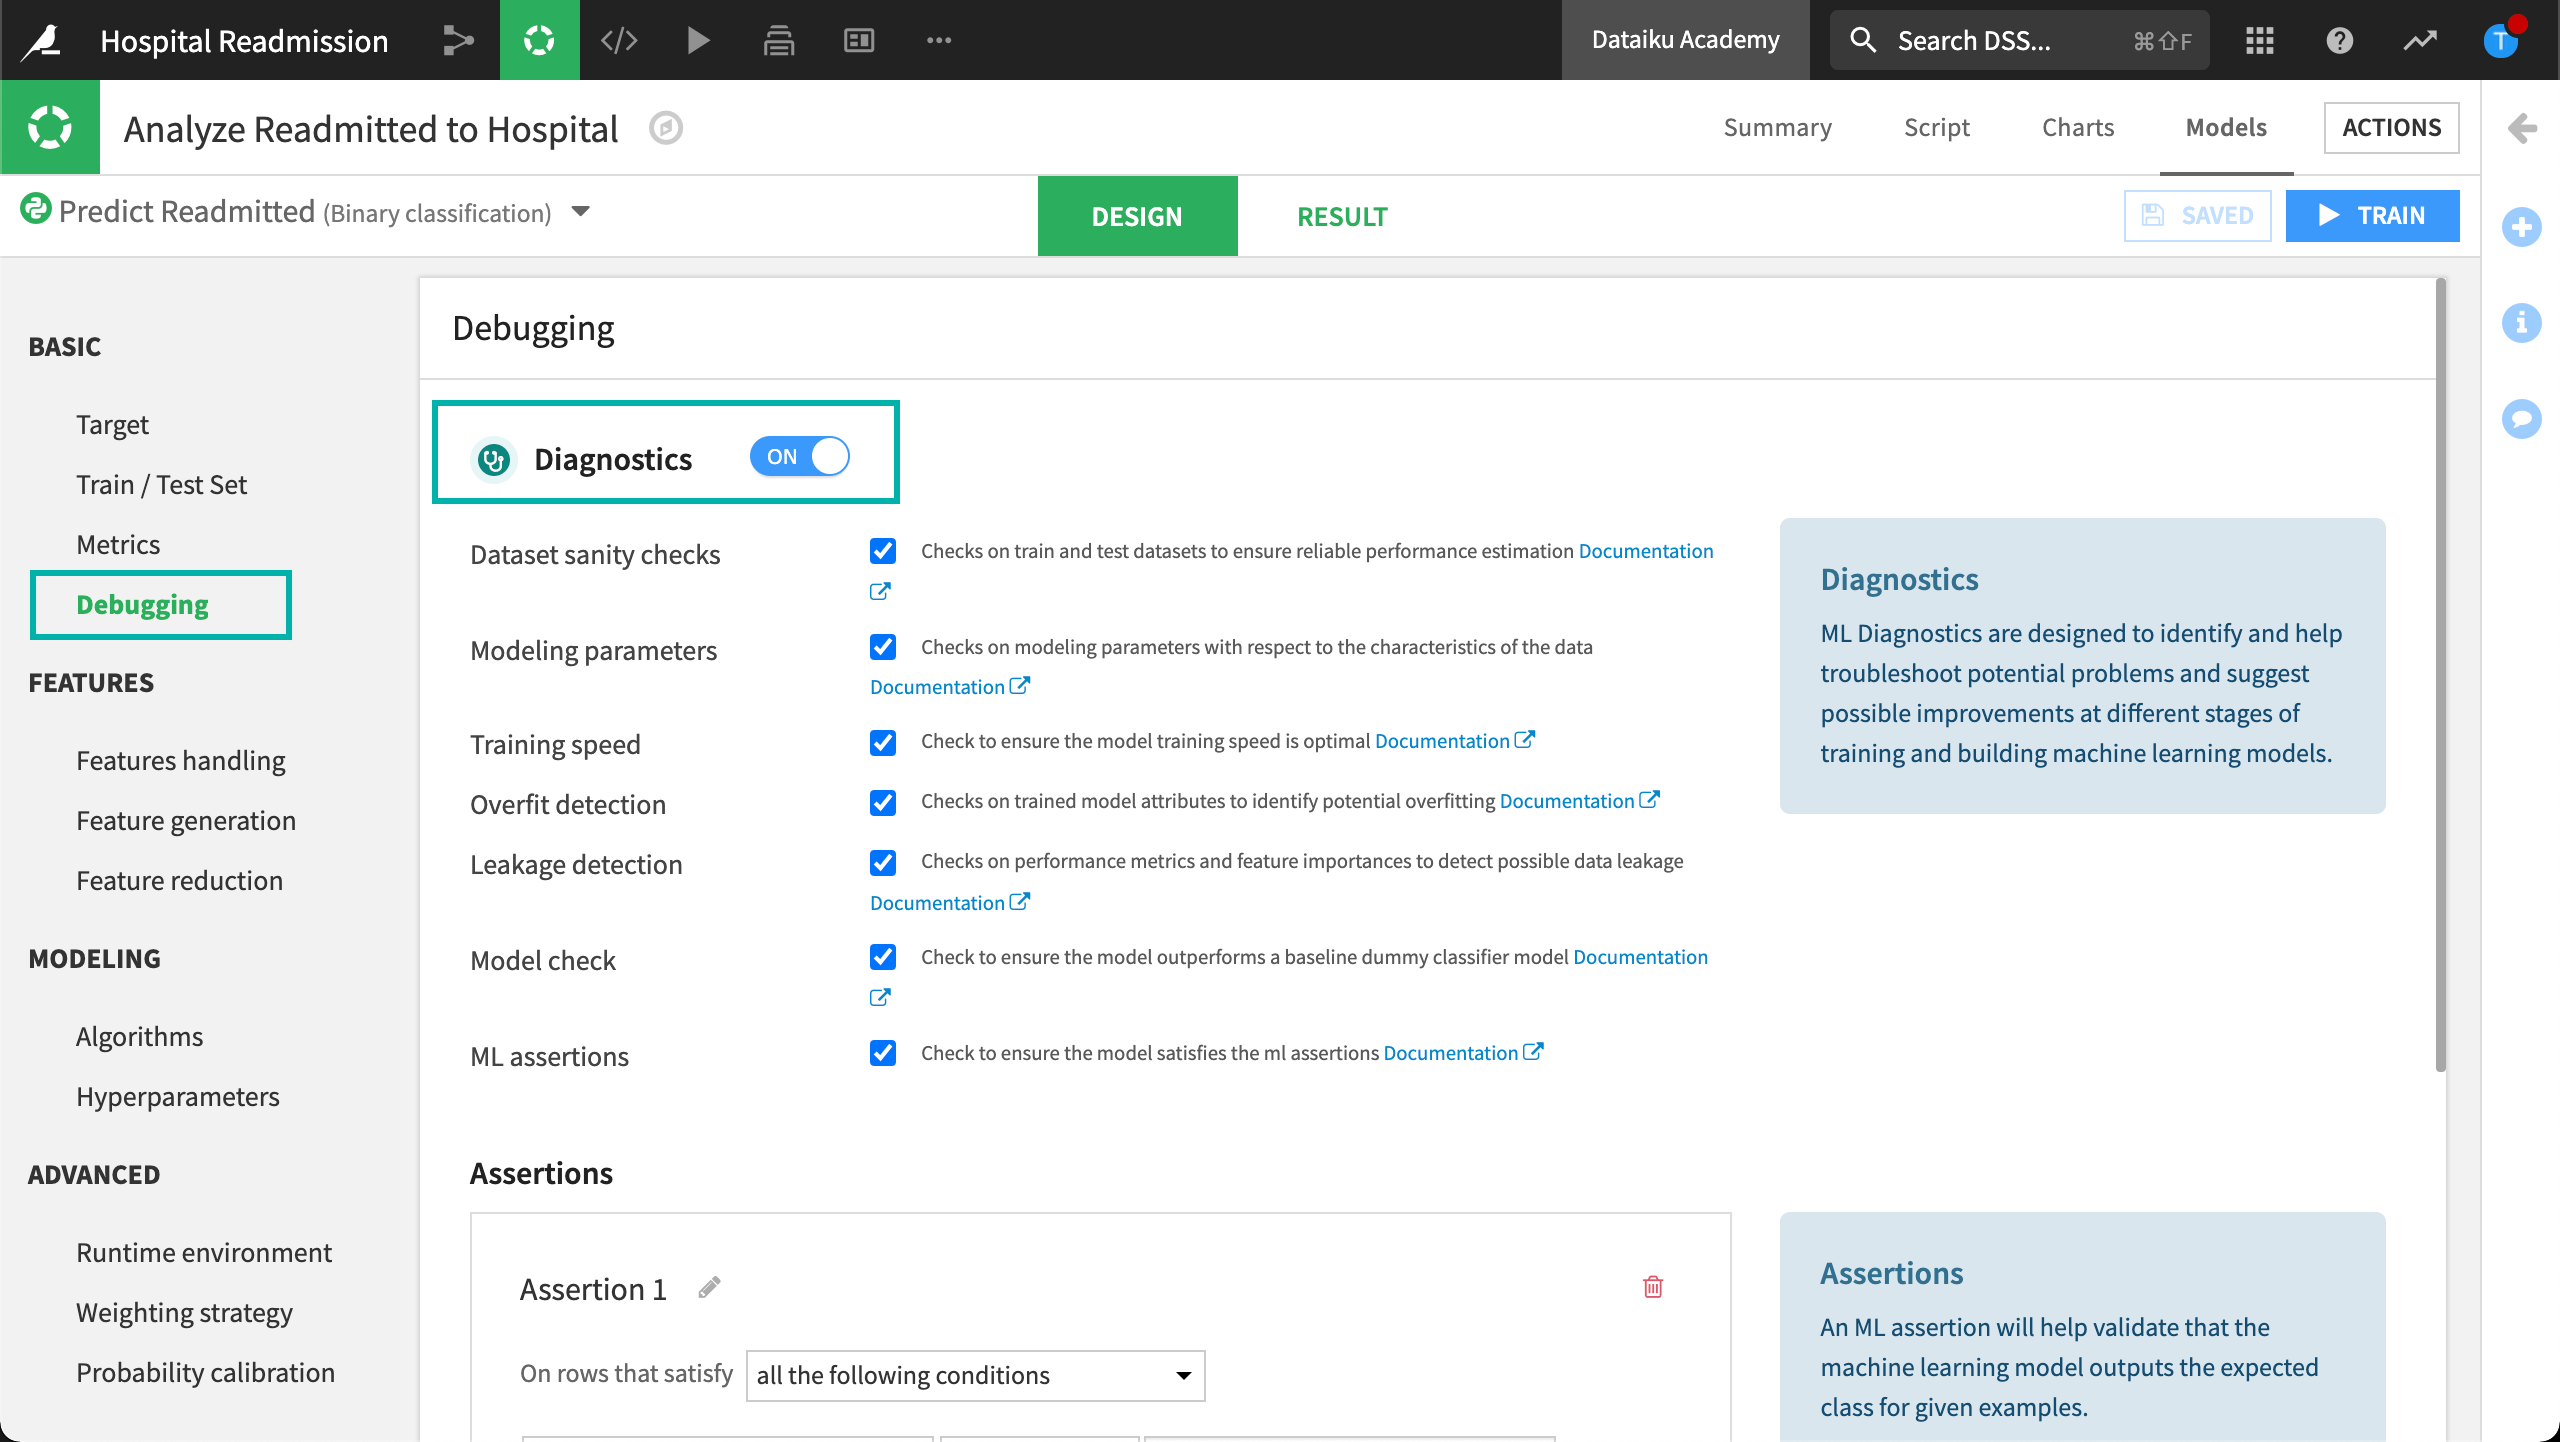
When training a model, you can also view model diagnostics. Model diagnostics help you detect common pitfalls such as overfitting and data leakage. Dataiku displays Diagnostics when an algorithm fails any of the diagnostics checks.
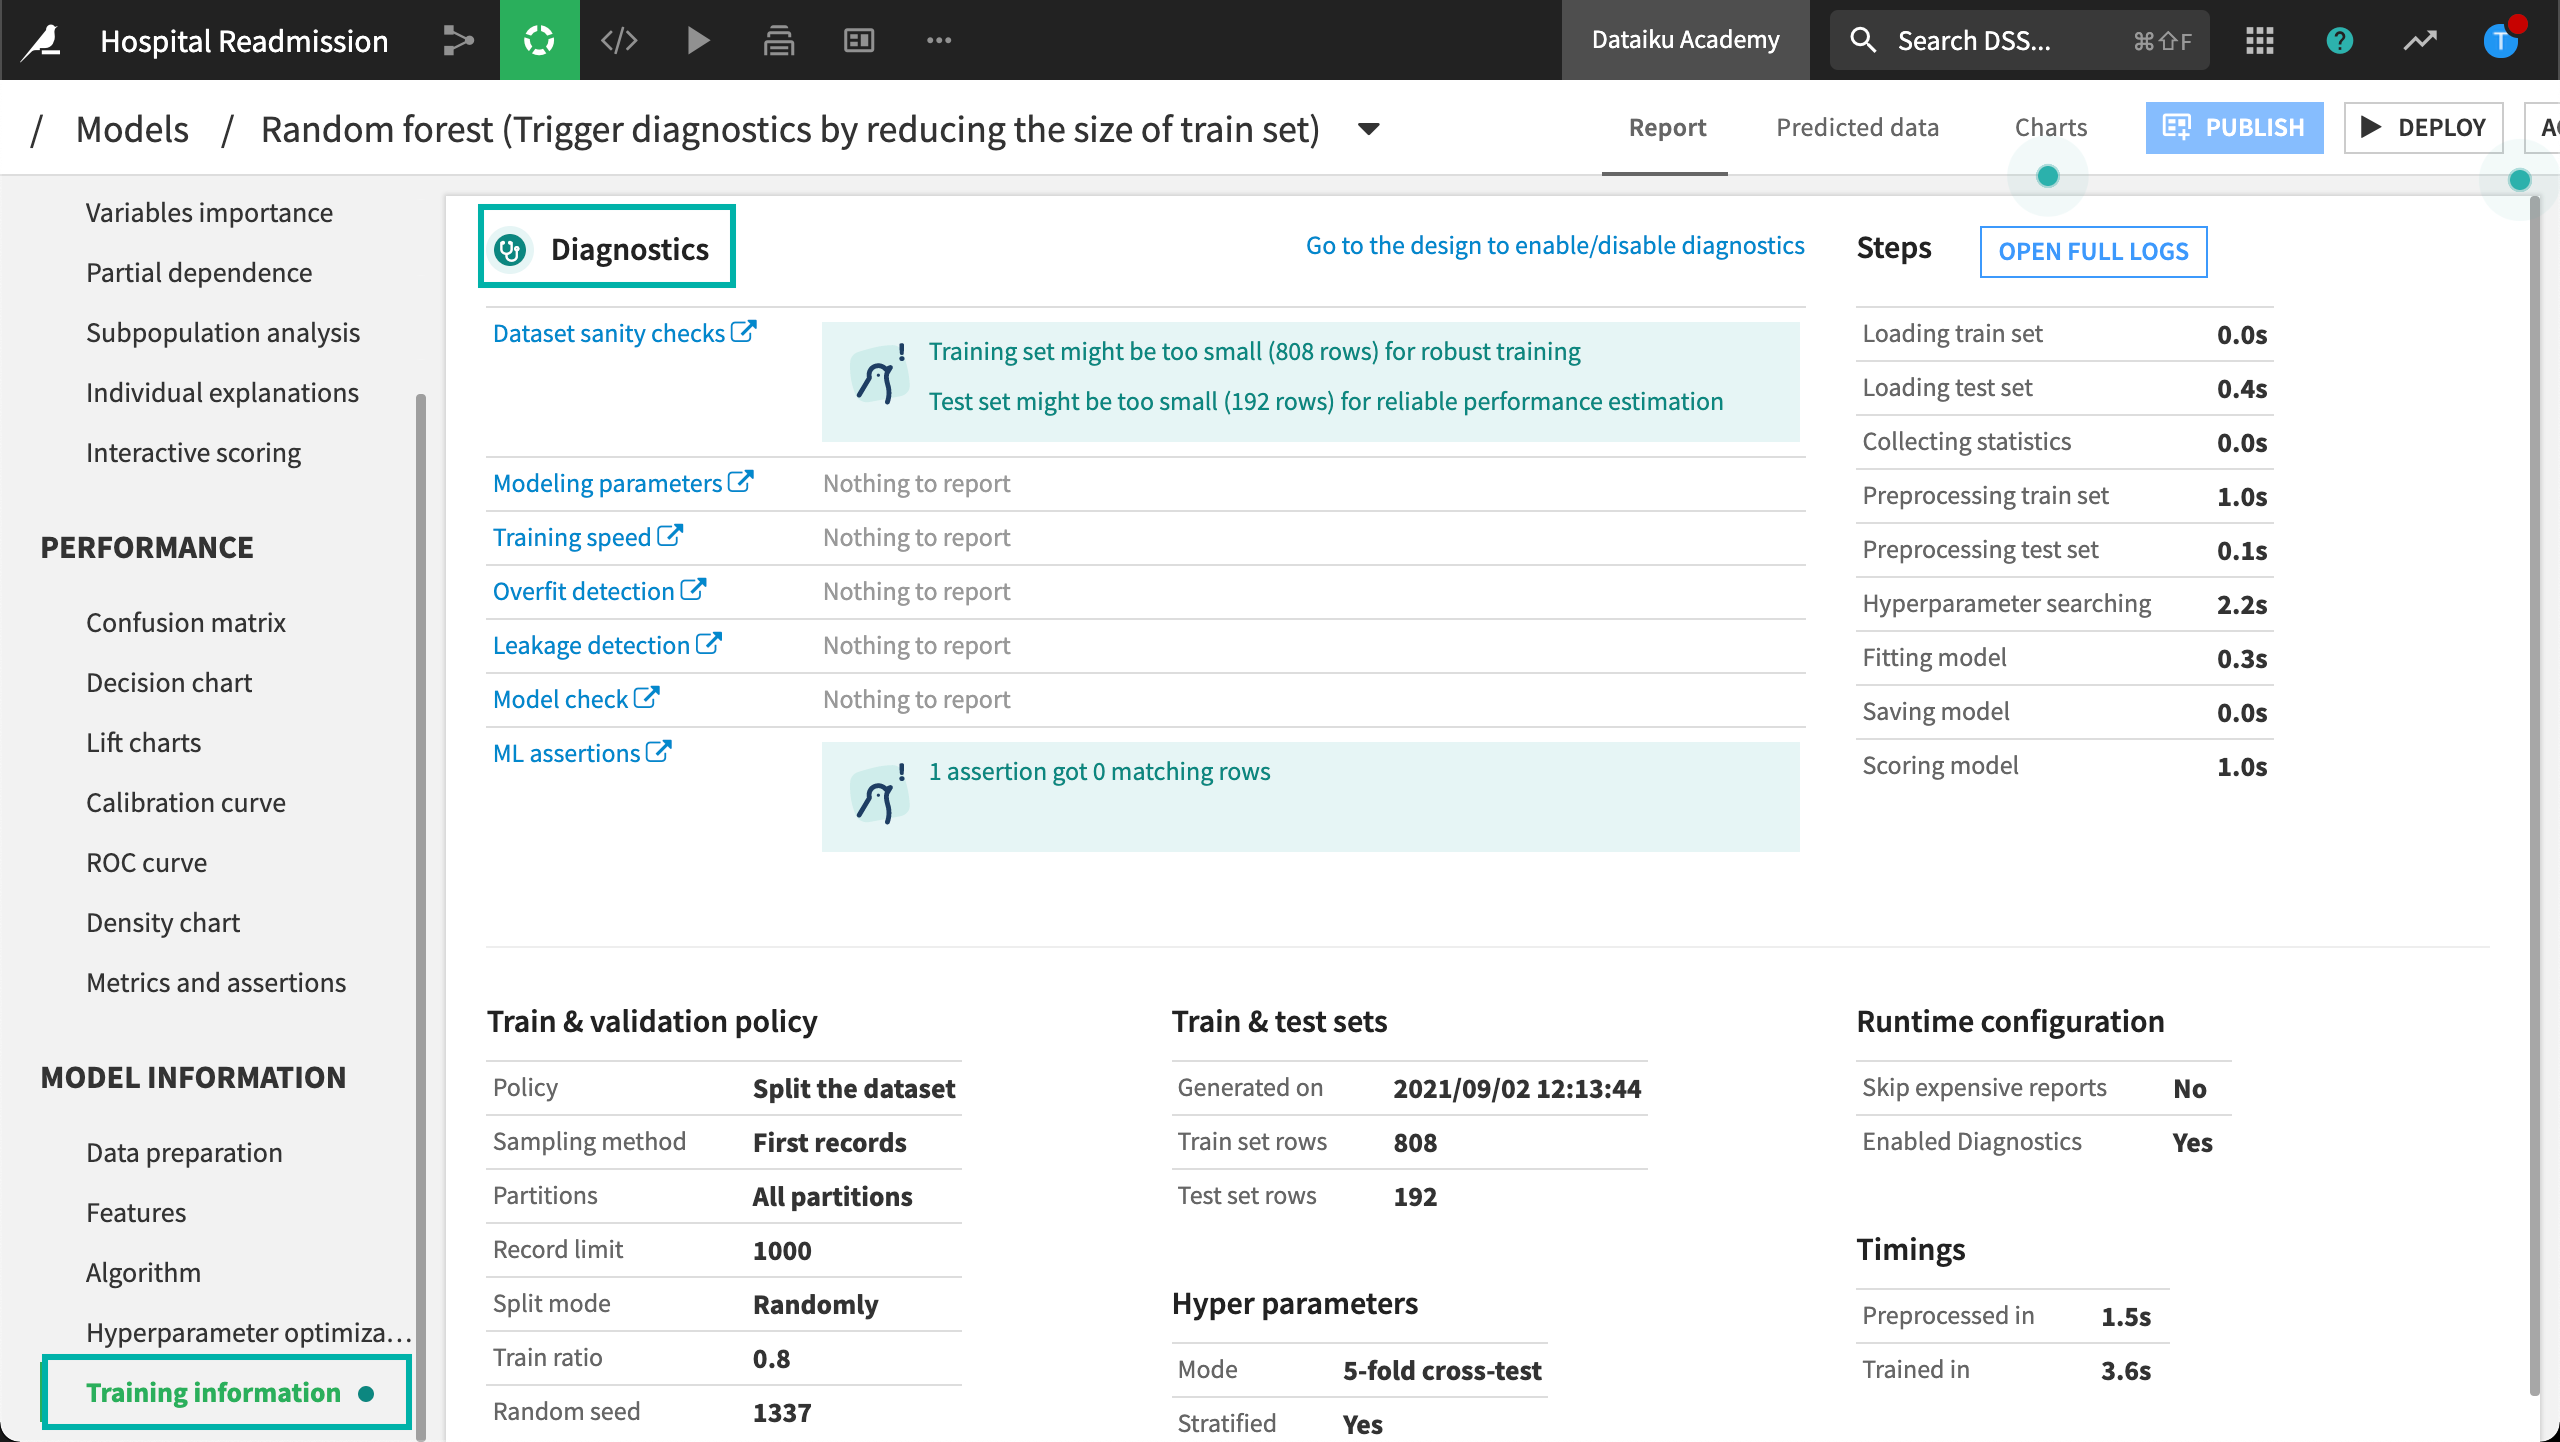
Clicking on Diagnostics displays the Model Summary including the Training Information section.
Diagnostics are configured in the Design tab under Debugging.
See also
To find out more about the model summary, visit Concept | Model summaries within the visual ML tool.

