Tutorial | ML diagnostics#
Get started#
ML diagnostics are a set of checks that help you to detect and correct common problems, such as overfitting and data leakage, during the model development phase. In this tutorial, you’ll learn how to use and interpret ML diagnostics using Dataiku’s visual machine learning tools.
Objectives#
In this tutorial, you will learn how to:
Explore existing diagnostics.
Activate/deactivate diagnostics.
Prerequisites#
Dataiku version 12.0 or above.
Basic knowledge of Dataiku (Core Designer level or equivalent).
Create the project#
From the Dataiku Design homepage, click + New Project.
Select Learning projects.
Search for and select ML Diagnostics.
If needed, change the folder into which the project will be installed, and click Create.
From the project homepage, click Go to Flow (or type
g+f).
Note
You can also download the starter project from this website and import it as a ZIP file.
View model diagnostics#
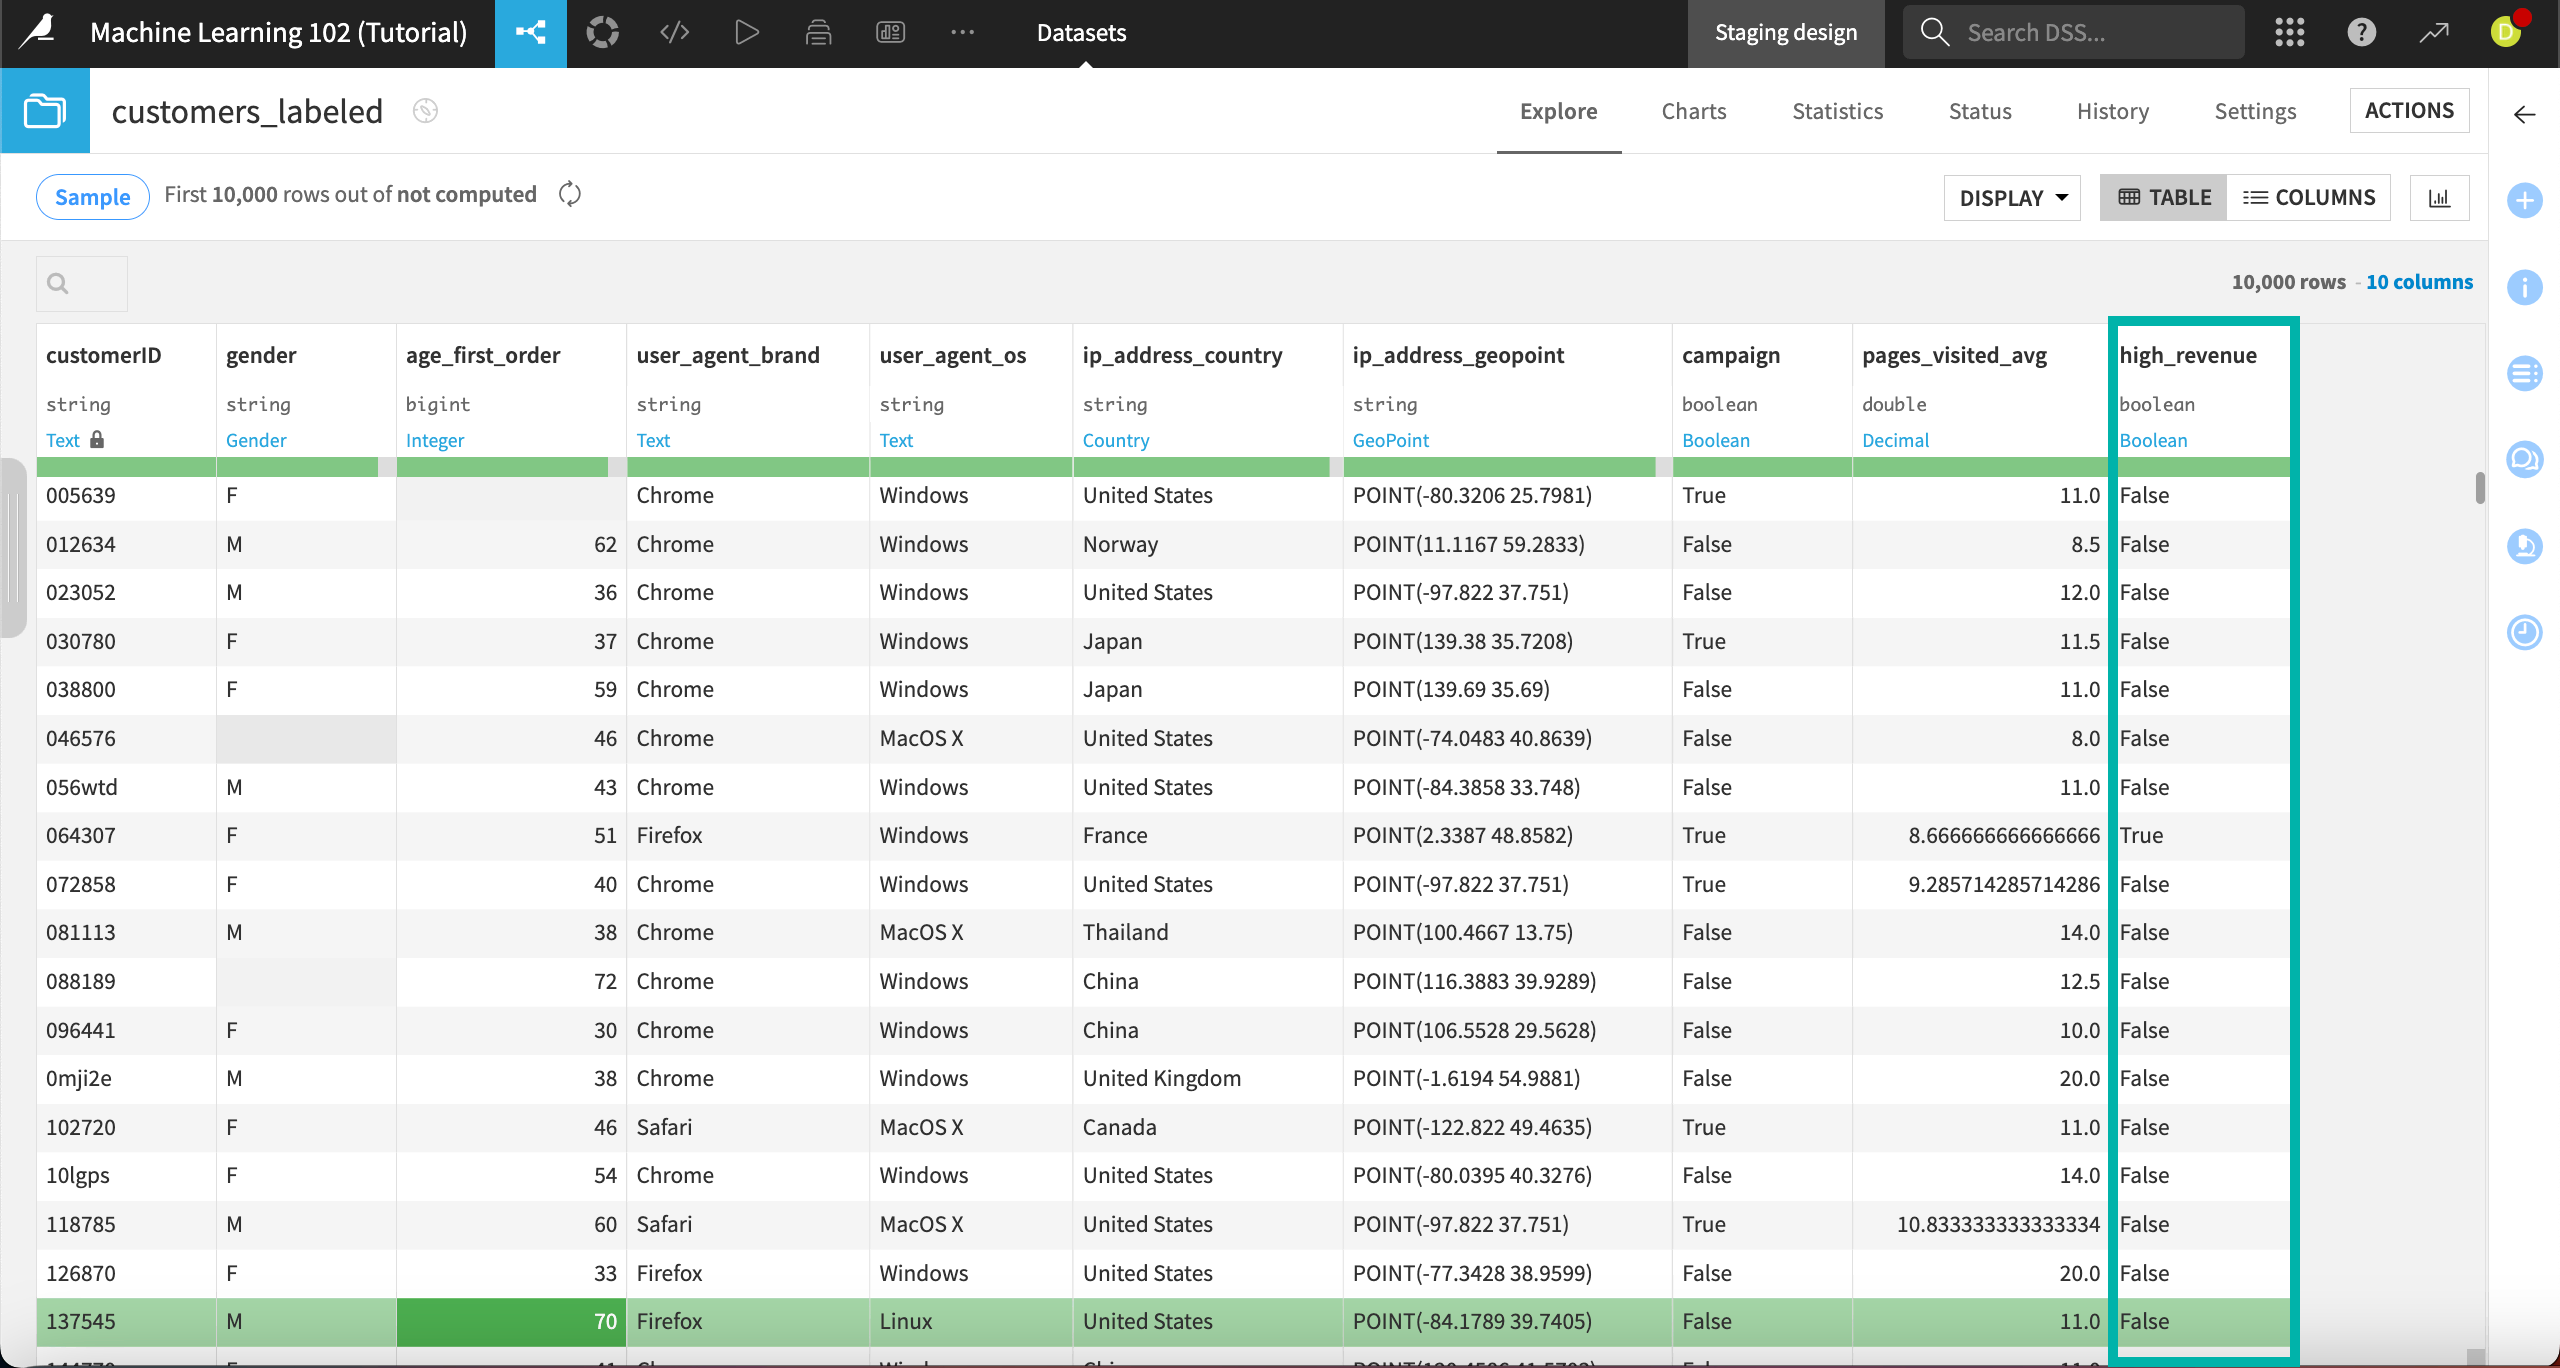
This tutorial uses a dataset of a fictional company’s customers and some demographic and business information about those customers. It includes two models, already trained in the Lab, that predict whether each customer is a high-revenue customer, as indicated in the high revenue column.

Dataiku calculates diagnostics continually during training so you can decide whether to continue or abort training. It also provides a summary in the model Result tab after training is complete.
Note
The specific checks performed will depend on the algorithm, as well as the type of modeling task. You can read more information about the checks performed in the ML Diagnostics section of the reference documentation.
To access the models and their diagnostics summaries:
From the ML (
) menu of the top navigation bar, click on Visual ML (Analysis).
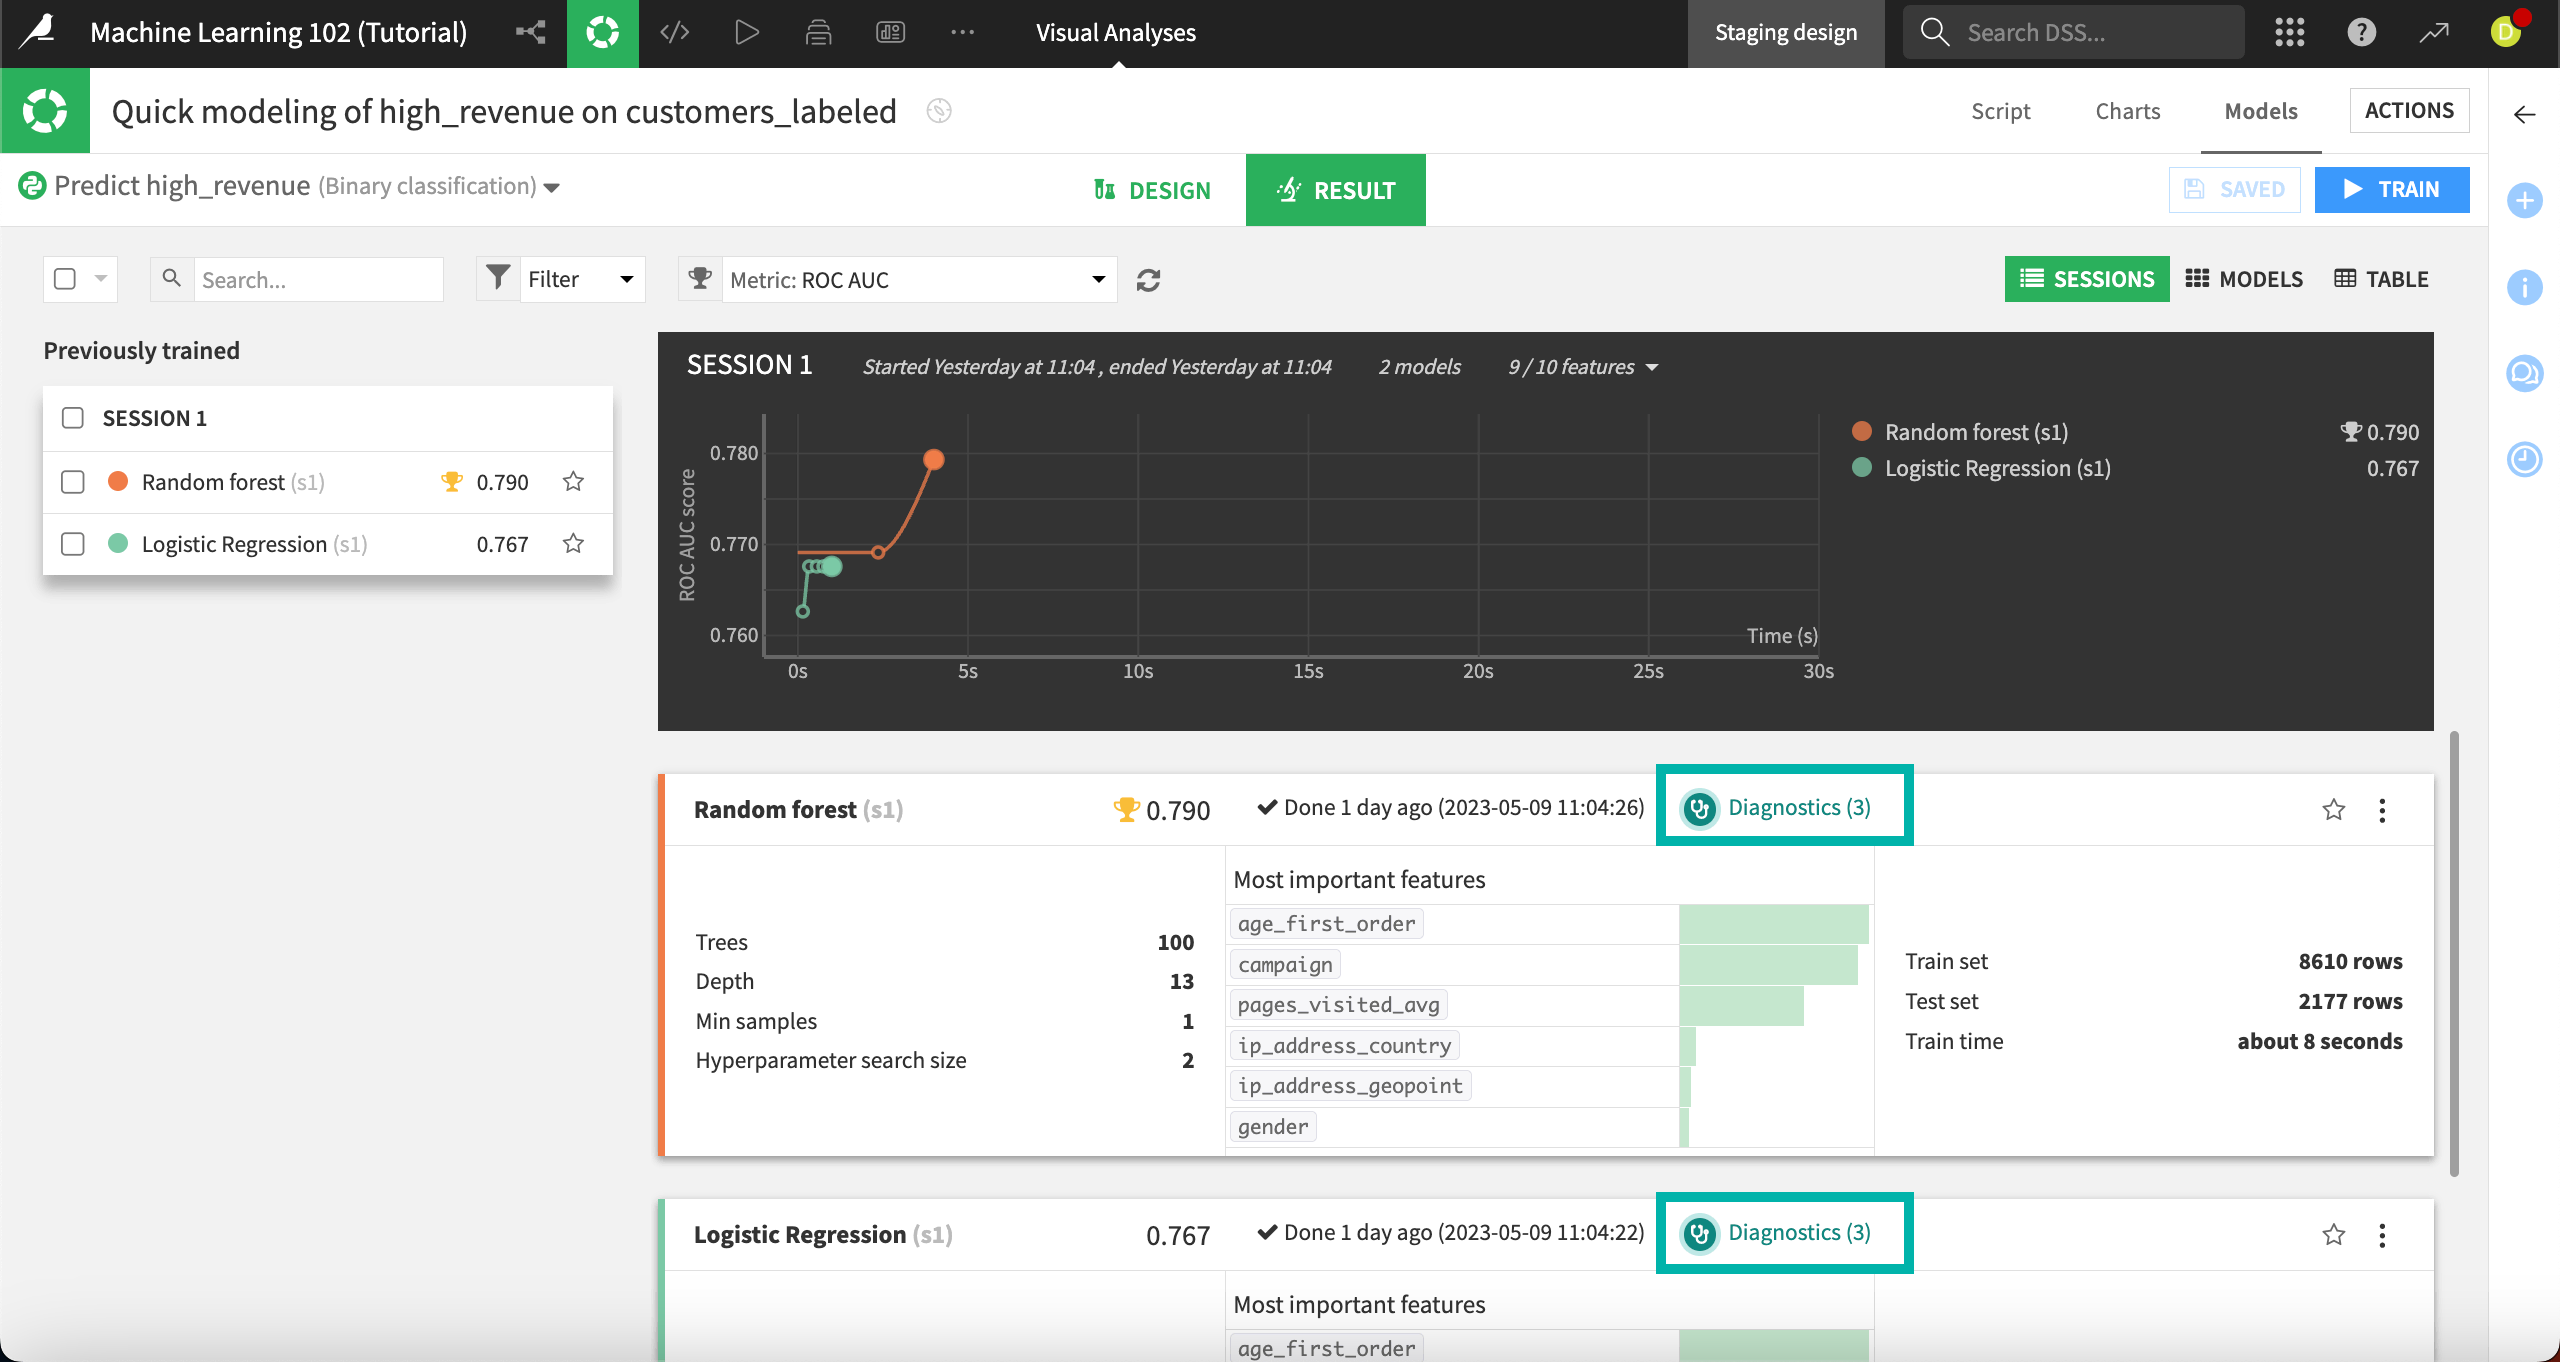
Select the model Quick modeling of high_revenue on customers labeled.

In the model Result page that appears, click on Diagnostics for the Random forest model.

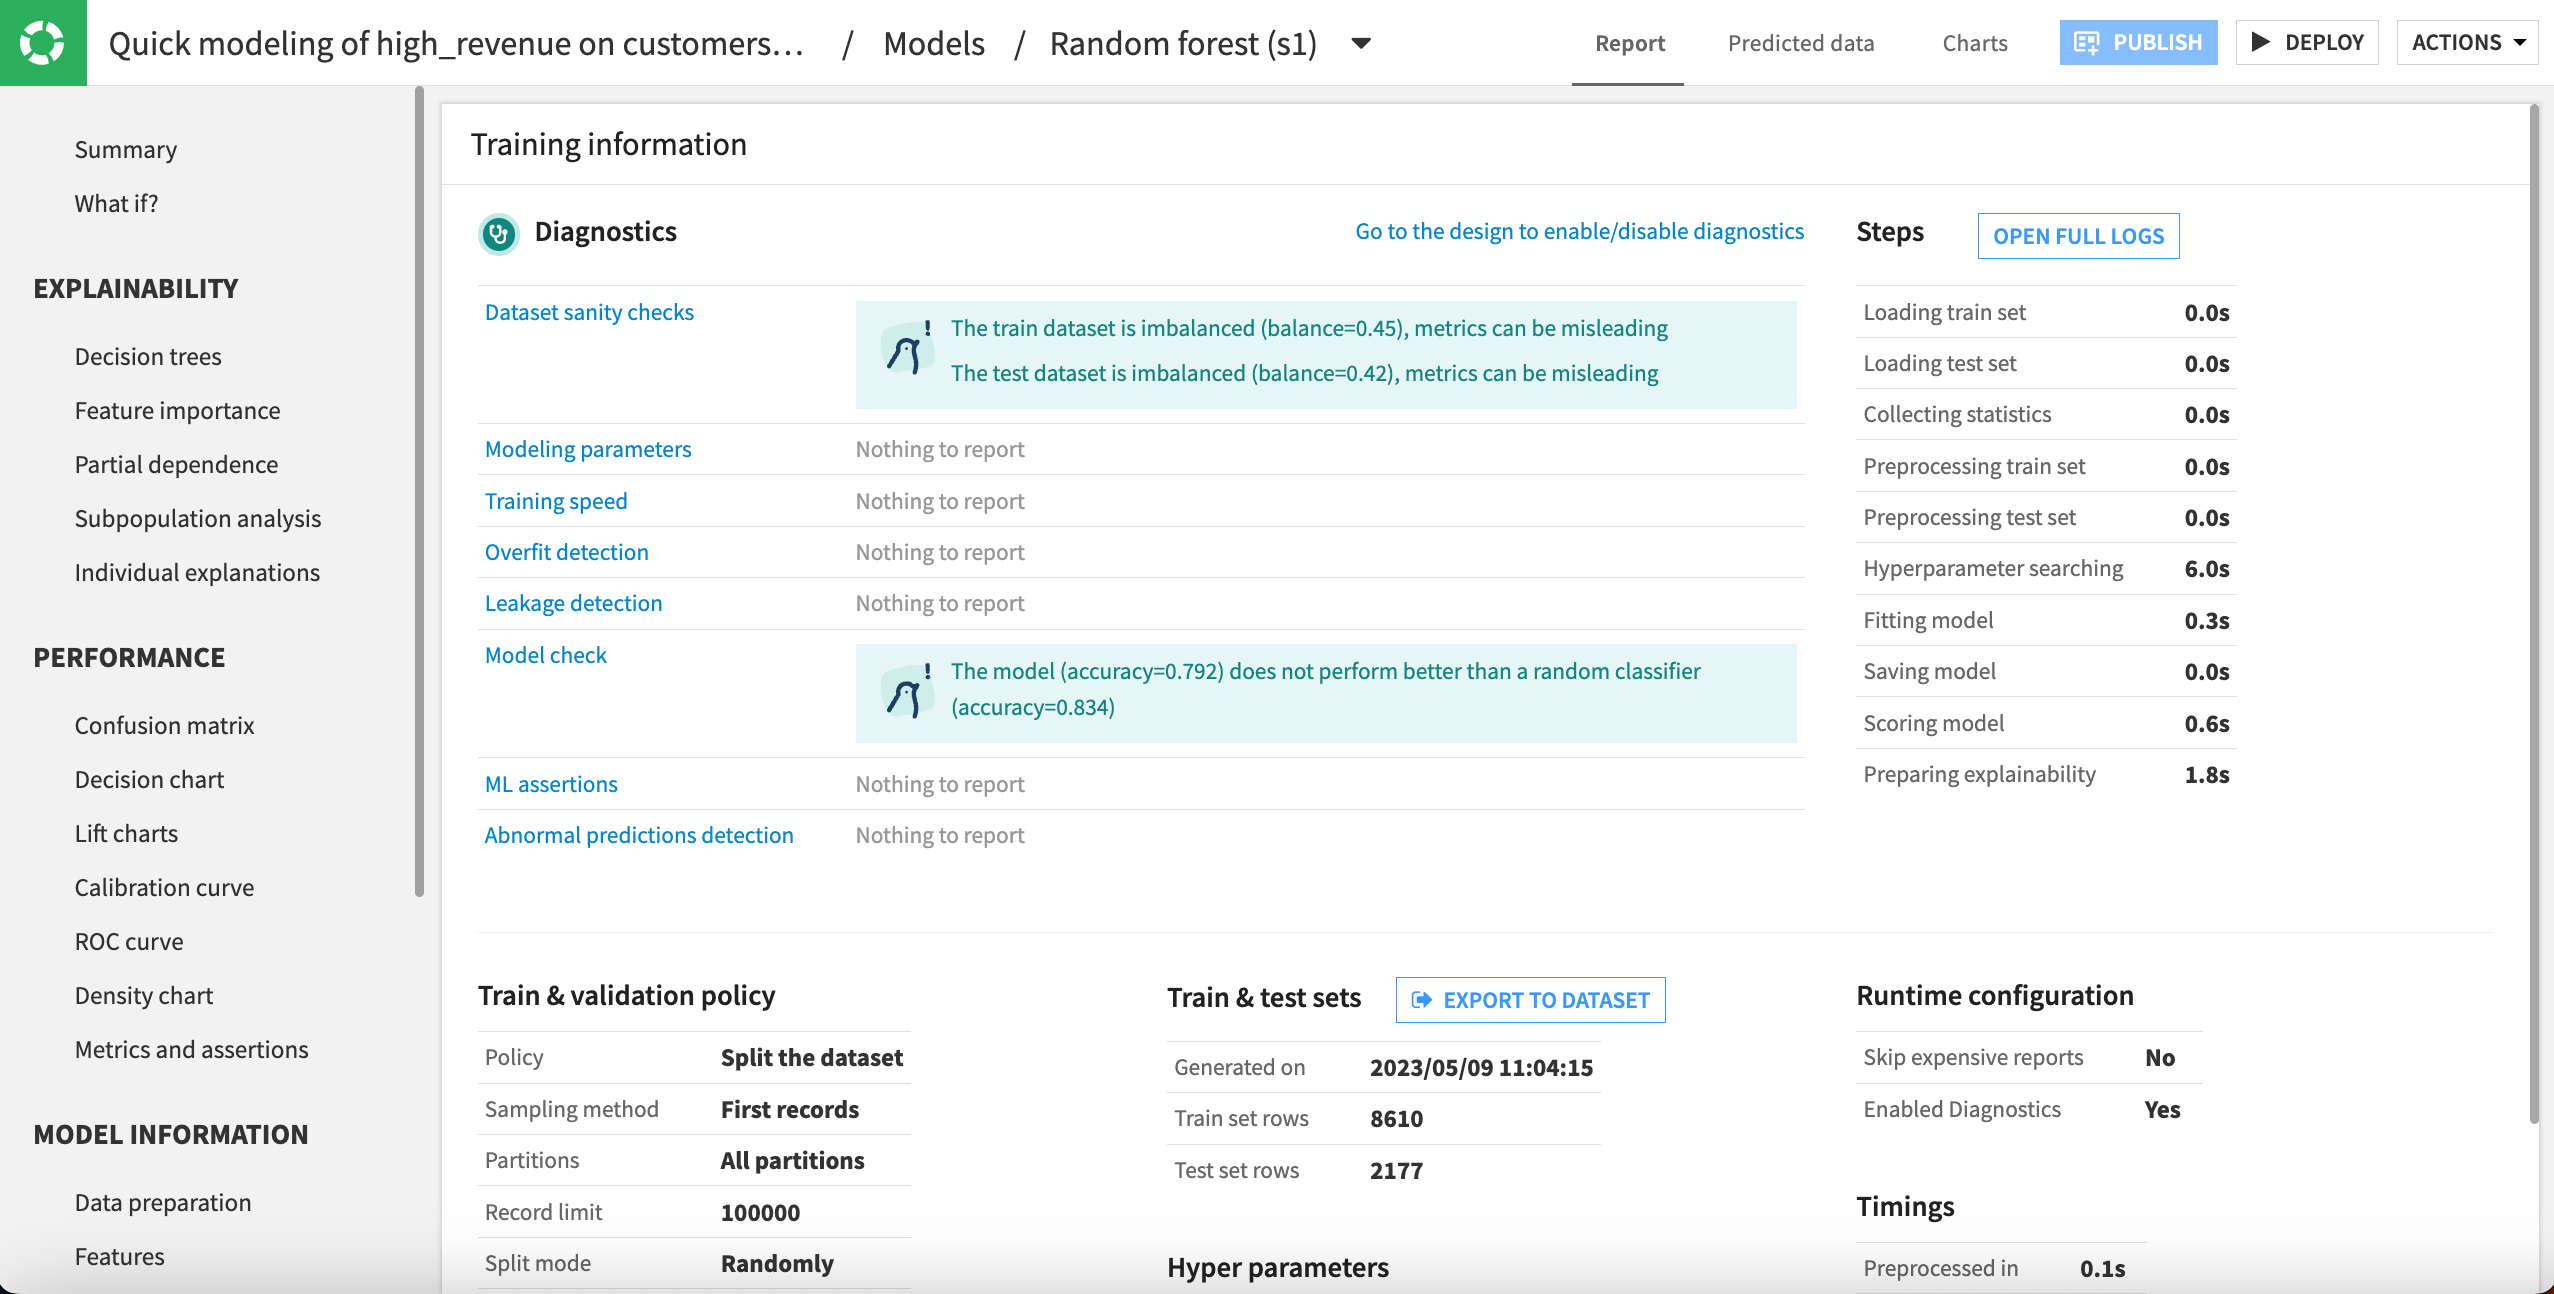
This brings you to the Training information report, where the Diagnostics section shows three warnings.

First, in Dataset sanity checks, we see warnings that the training and test sets are imbalanced. This can cause our classification model to perform poorly when attempting to predict the underrepresented value.
Now we should check how our data is imbalanced. In this data, we find that the proportion of high revenue customers is relatively small. Because these are the customers we want most to attract and retain, it’s important to identify this issue and address it.
Next, under Model check, we can see that the model doesn’t perform better than a random classifier. Dataiku calculates the performance of a dummy classifier and compares that to the trained models. The problem with our model could also relate to the underrepresented classes.
Note that the logistic regression model that also was trained has similar warnings from its diagnostic checks. You can view those diagnostics following the same steps.
Tip
Click on any of the links on the diagnostic checks, such as Dataset sanity checks or Modeling parameters to read more about that issue in the Dataiku Help Center.
Set diagnostics#
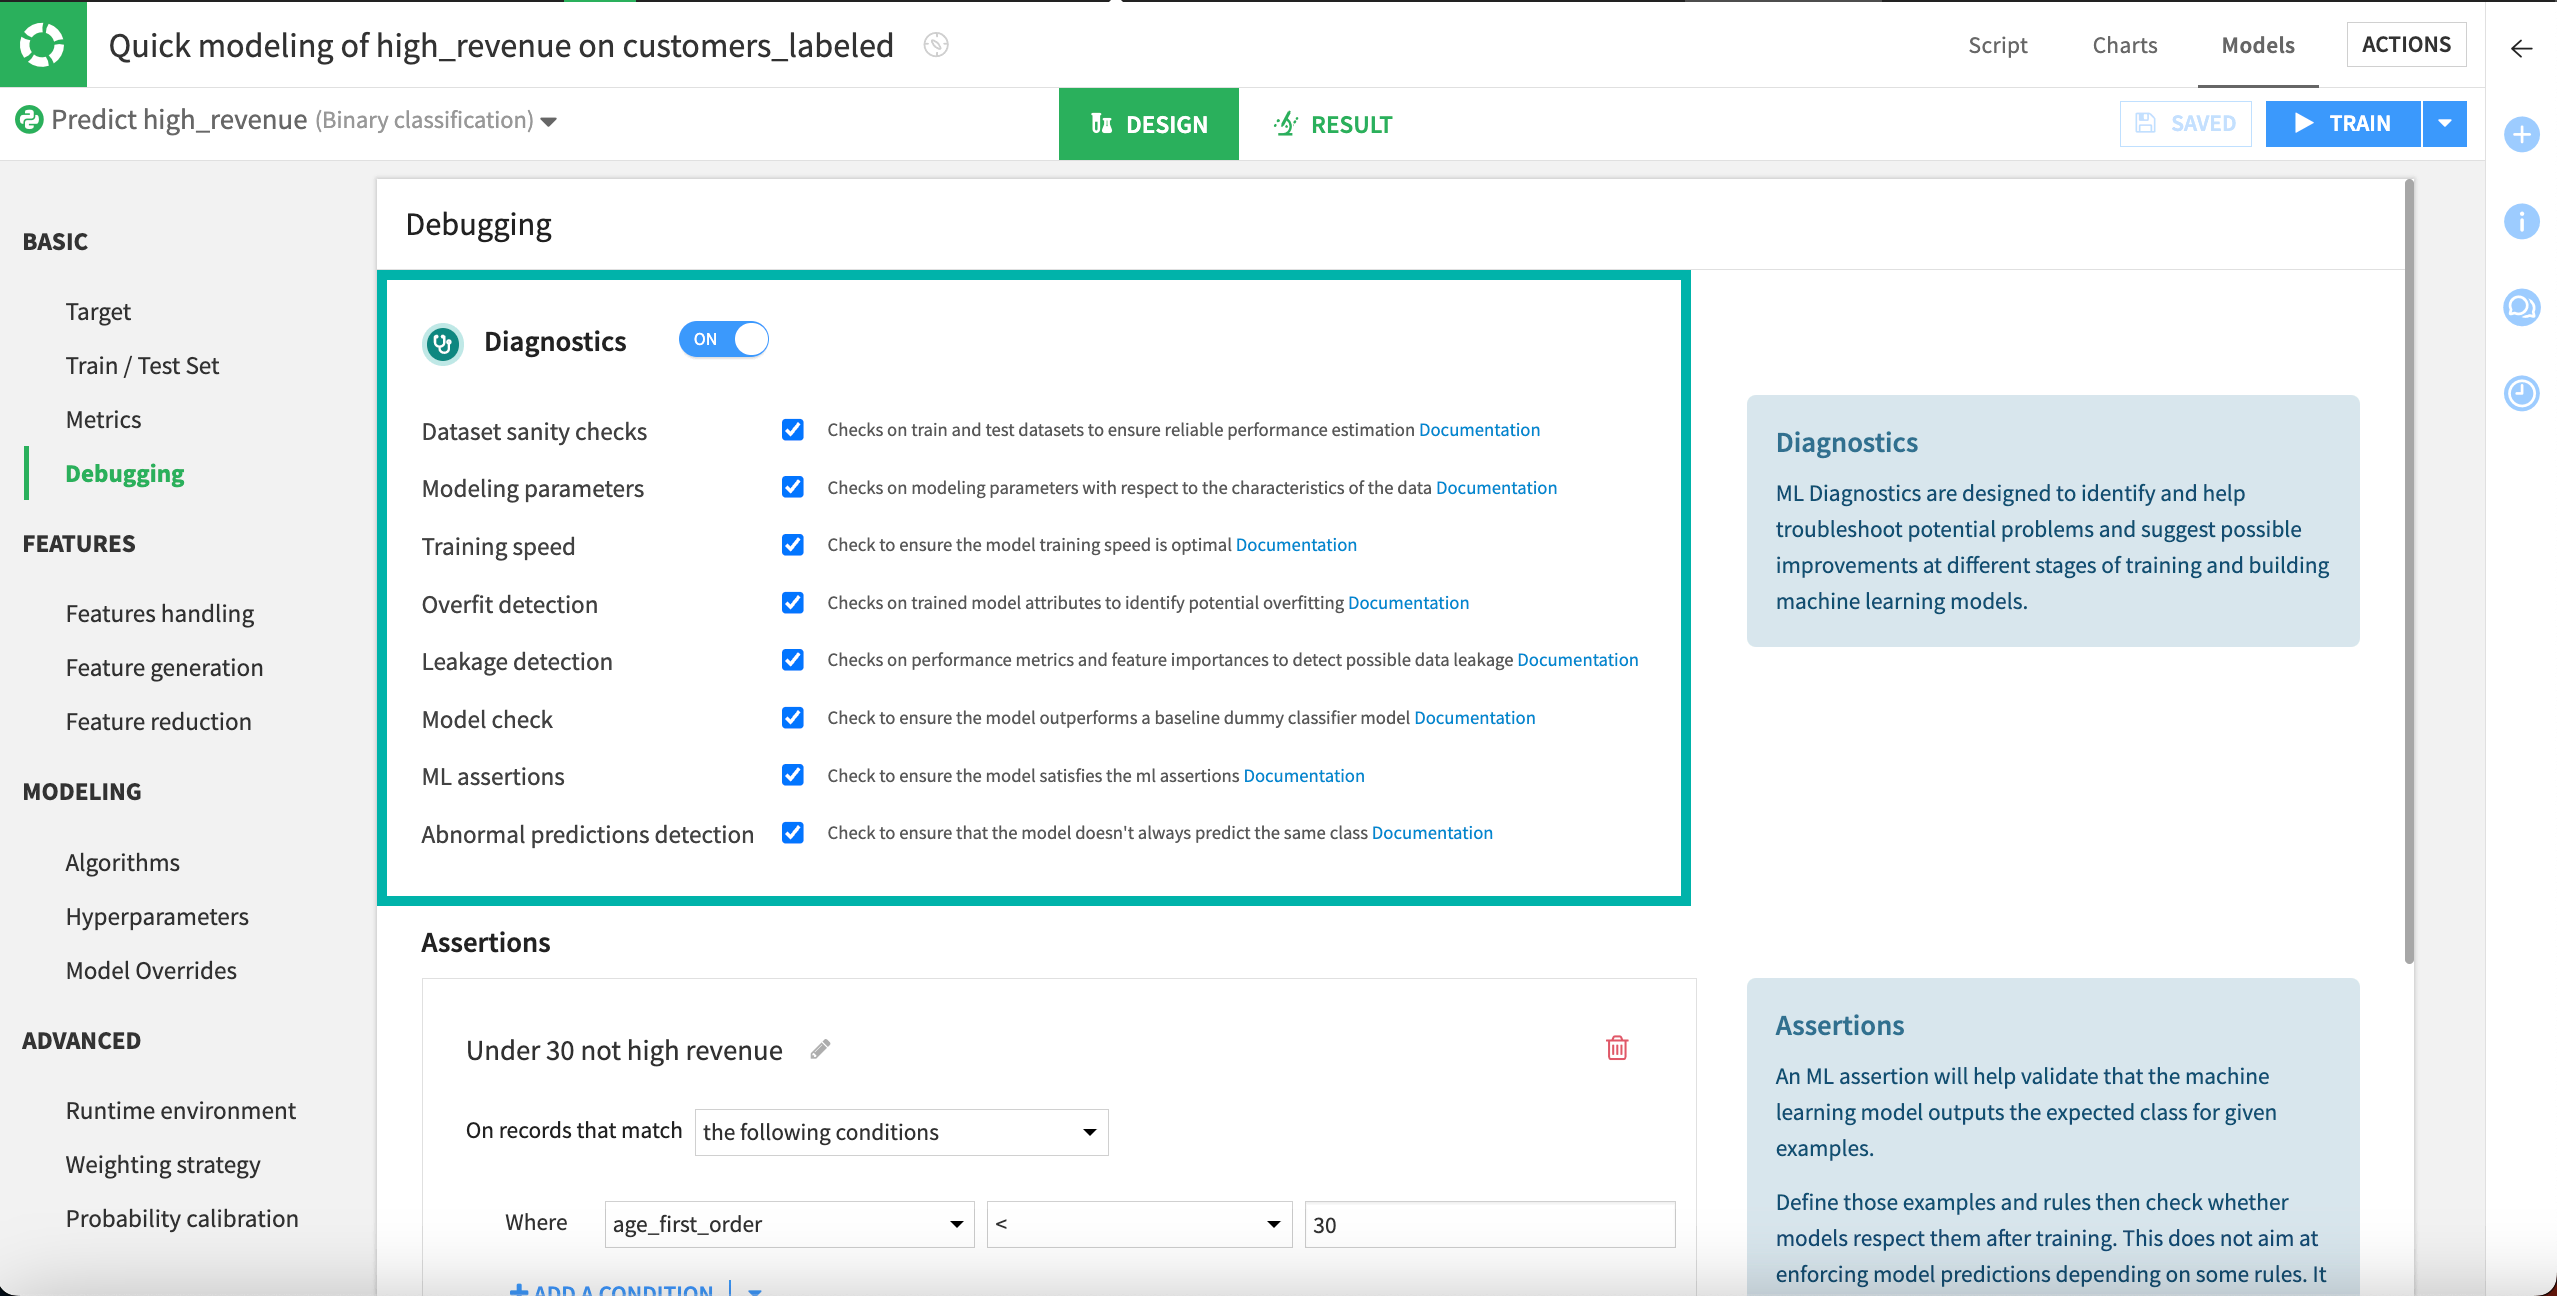
Diagnostic checks are automatically activated by default, and you can turn them off in the Design tab.
From the Training information report, click on the link to Go to the design to enable/disable diagnostics.
In this panel, you can turn off all diagnostics or selected checks.

Next steps#
Congratulations! You’ve successfully explored diagnostics for machine learning models.

