Concept | Subpopulation analysis#
Watch the video

While trying to build a high-performance model, we will have spent considerable time feature engineering, trying different algorithms, and tuning hyperparameters. Now that your overall model’s performance metrics look good, are we finished?
Before pushing our model into production, we might first want to make sure that our model is fair and transparent. Subpopulation analysis can be useful in this context.
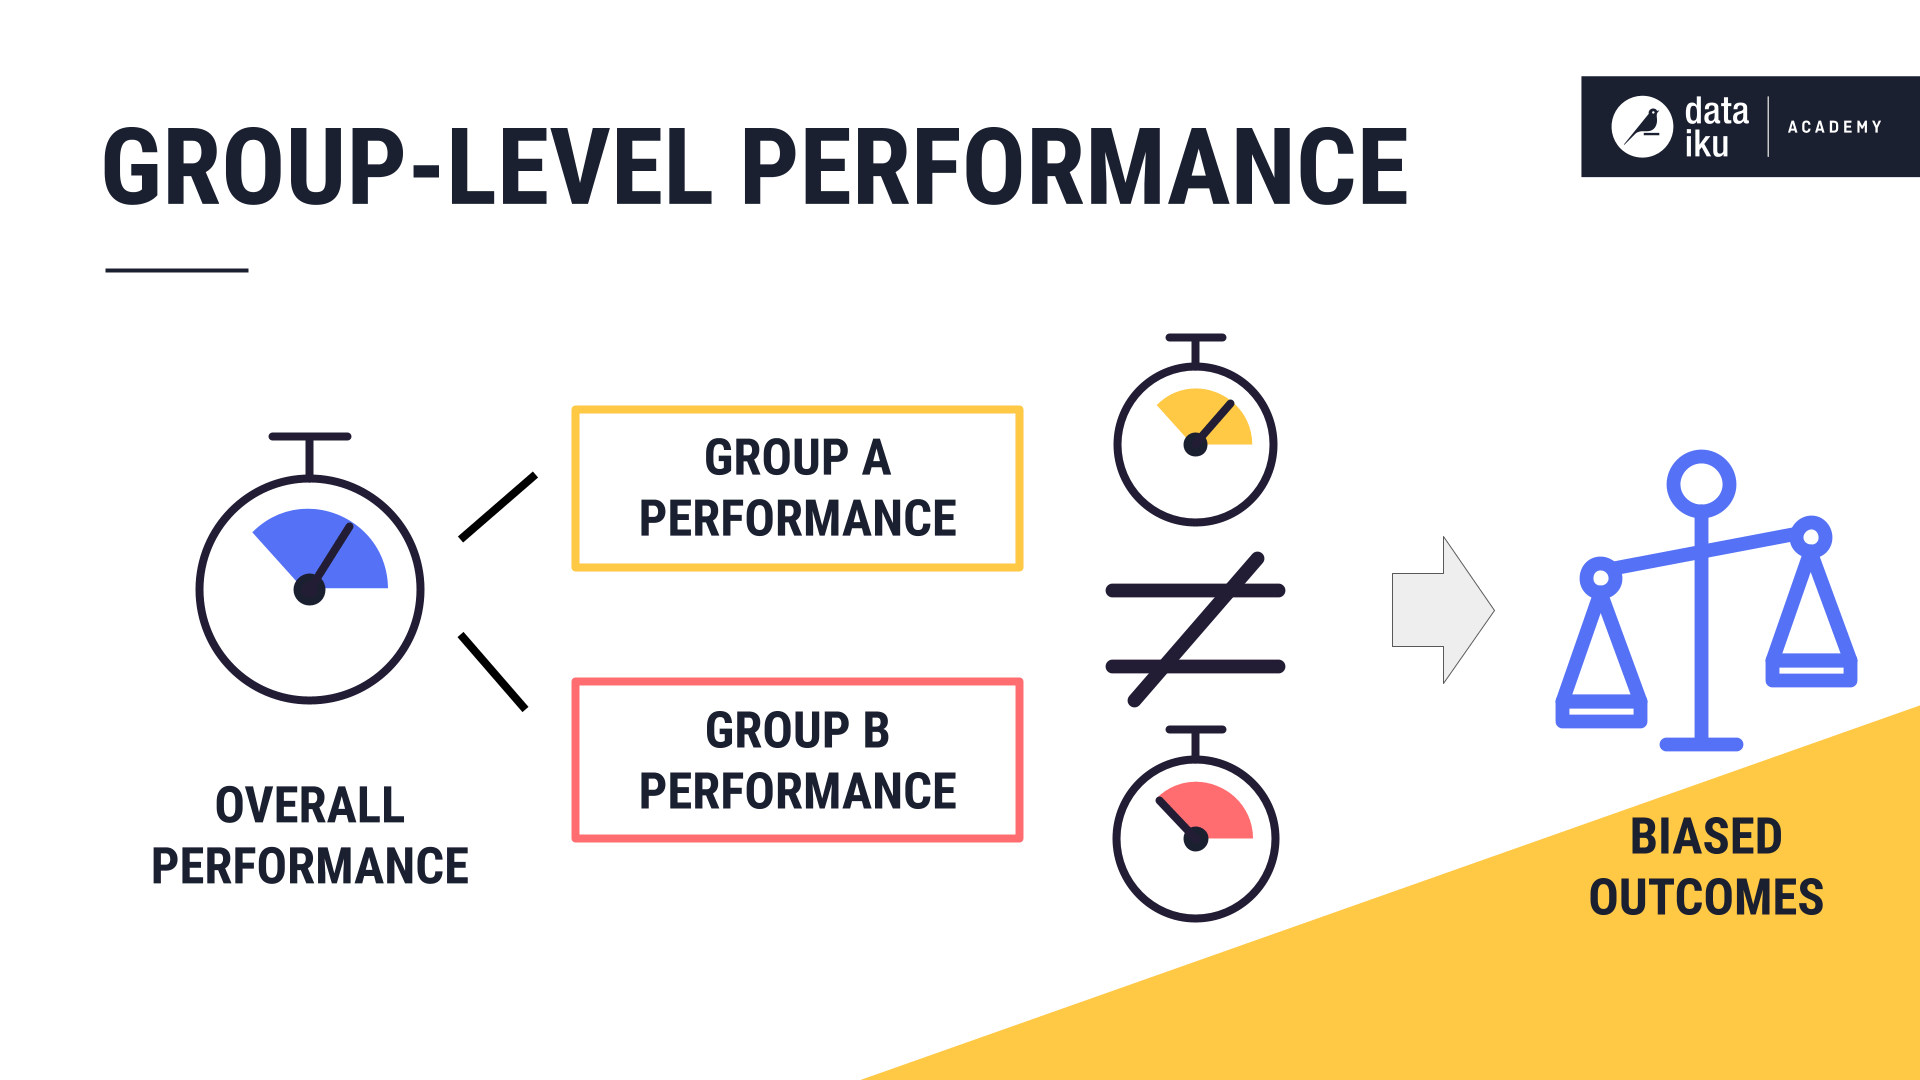
You can use subpopulation analysis to investigate whether the model performs identically across different subpopulations. Note that if the model is better at predicting outcomes for one group over another, it can lead to biased outcomes and unintended consequences when it’s put into production.

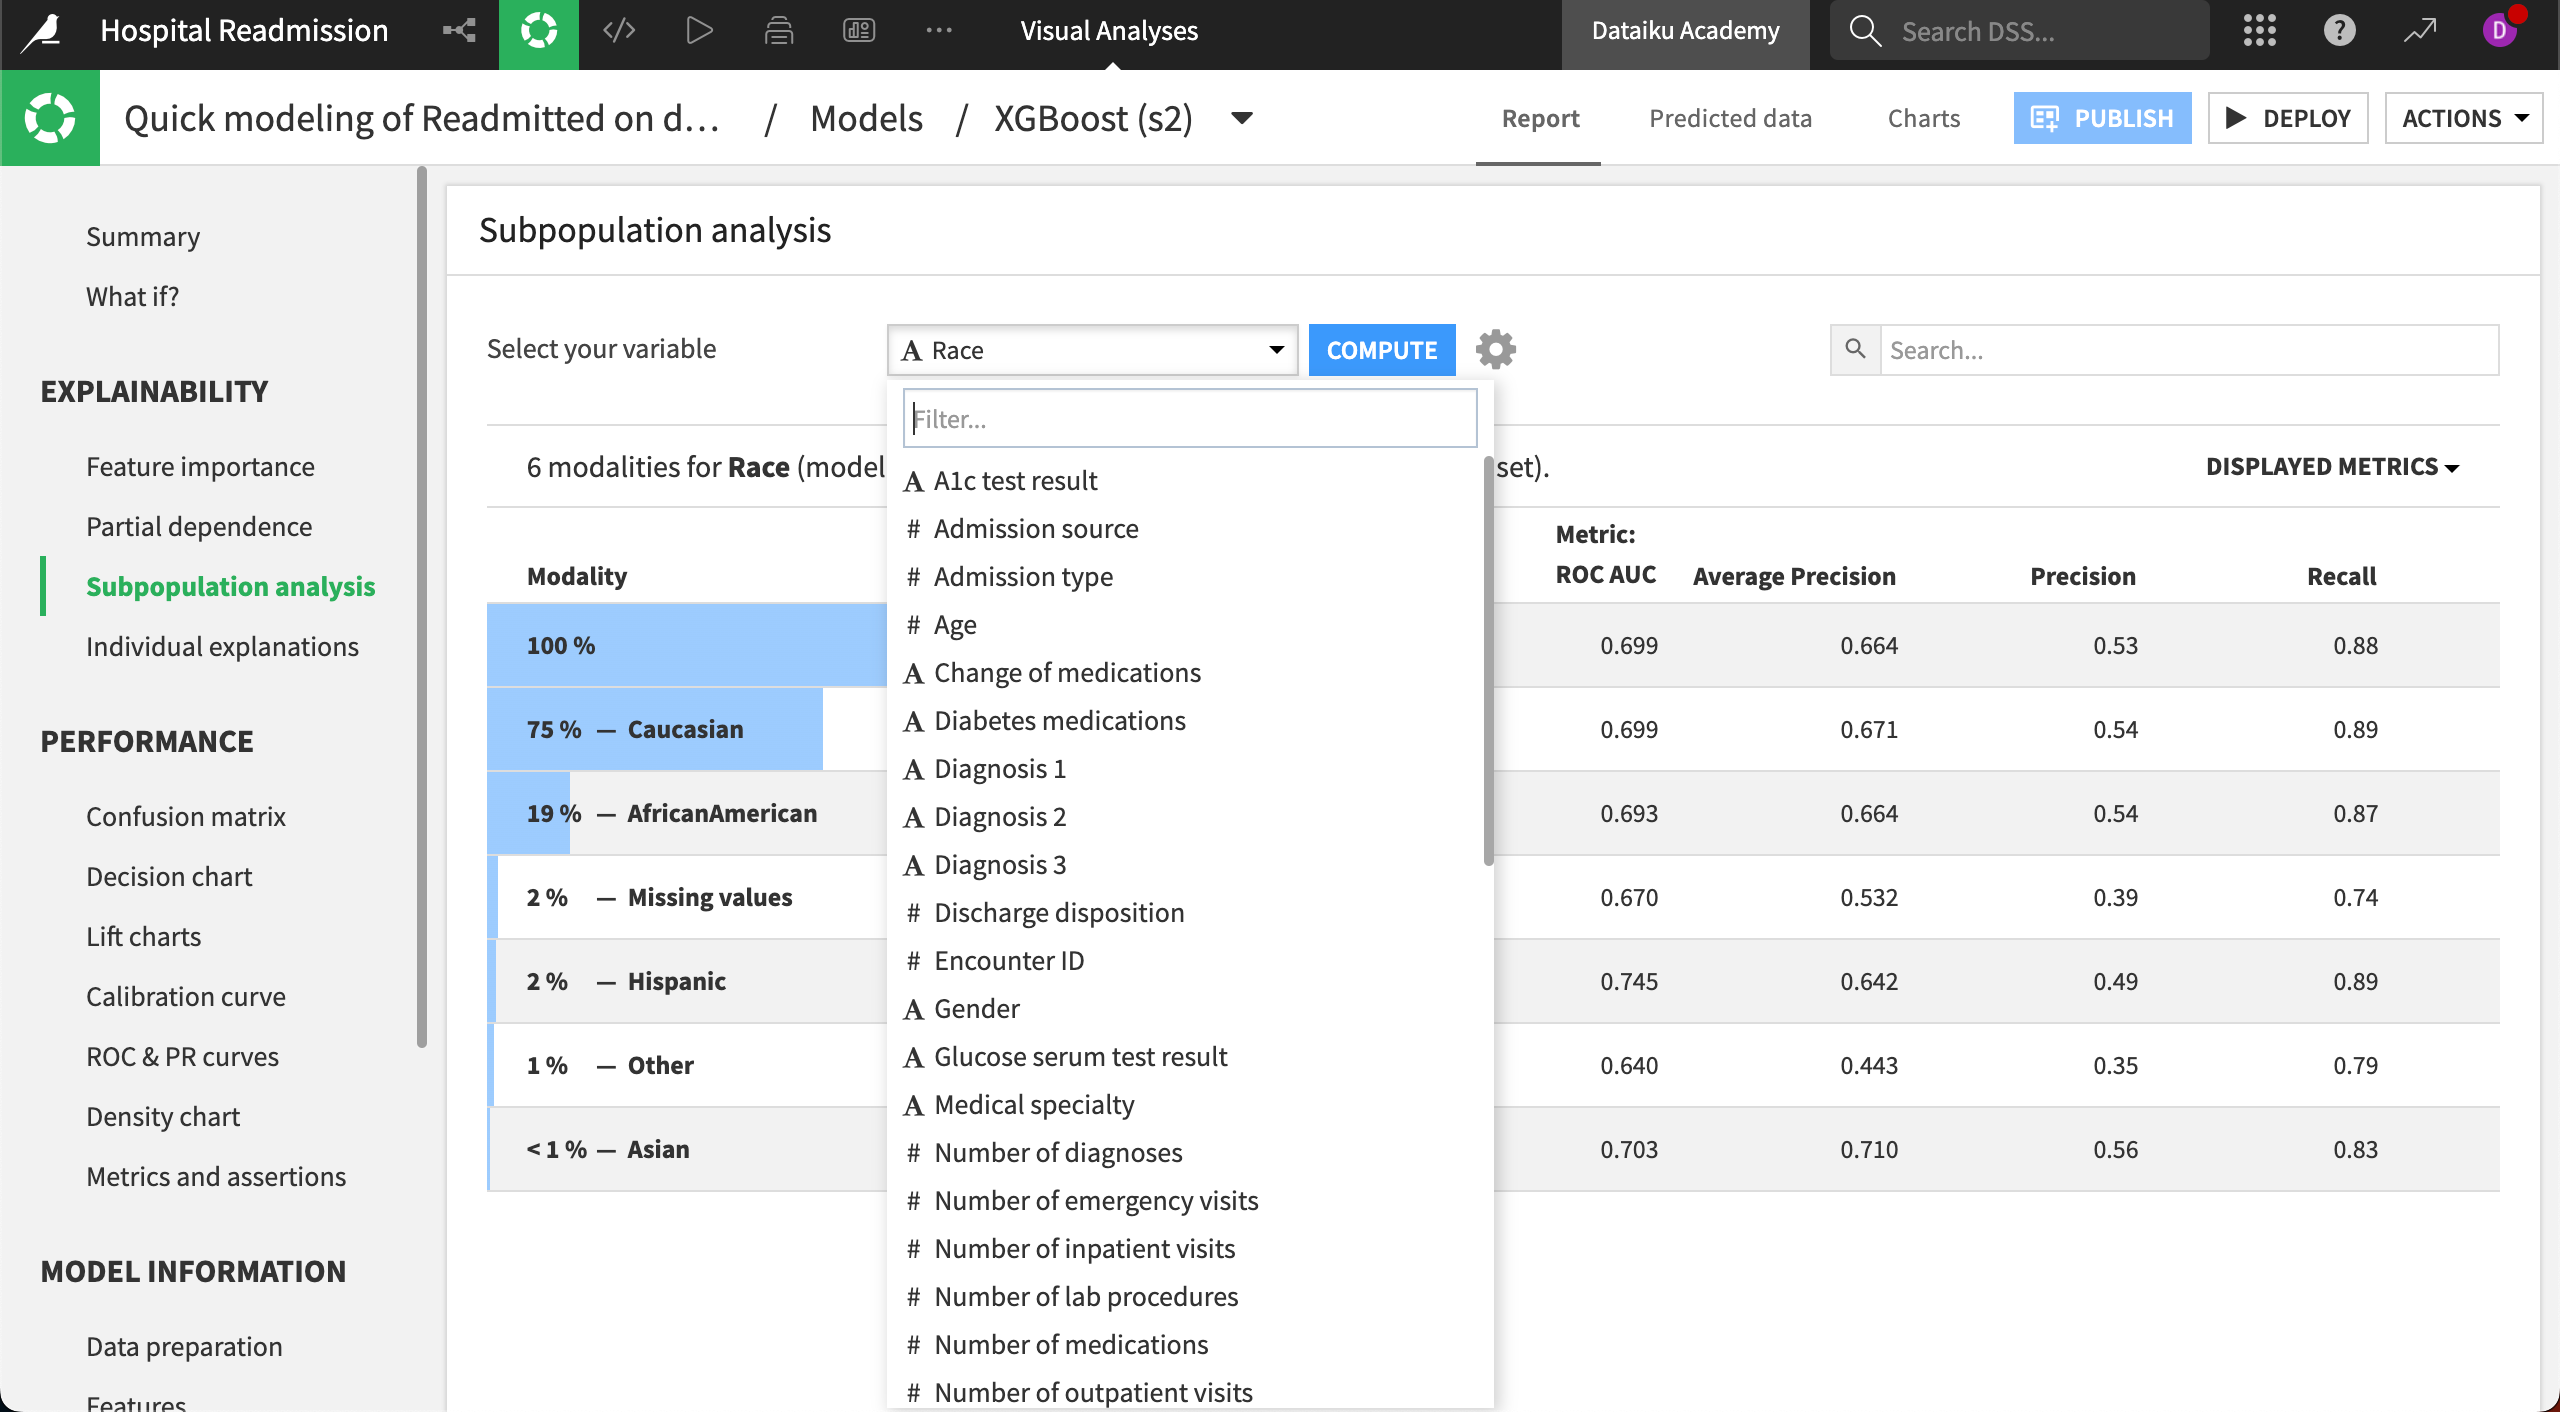
A Dataiku prediction model report includes a panel for Subpopulation analysis. In the same way we would do for a partial dependence plot, we need to choose one variable to compute the analysis.
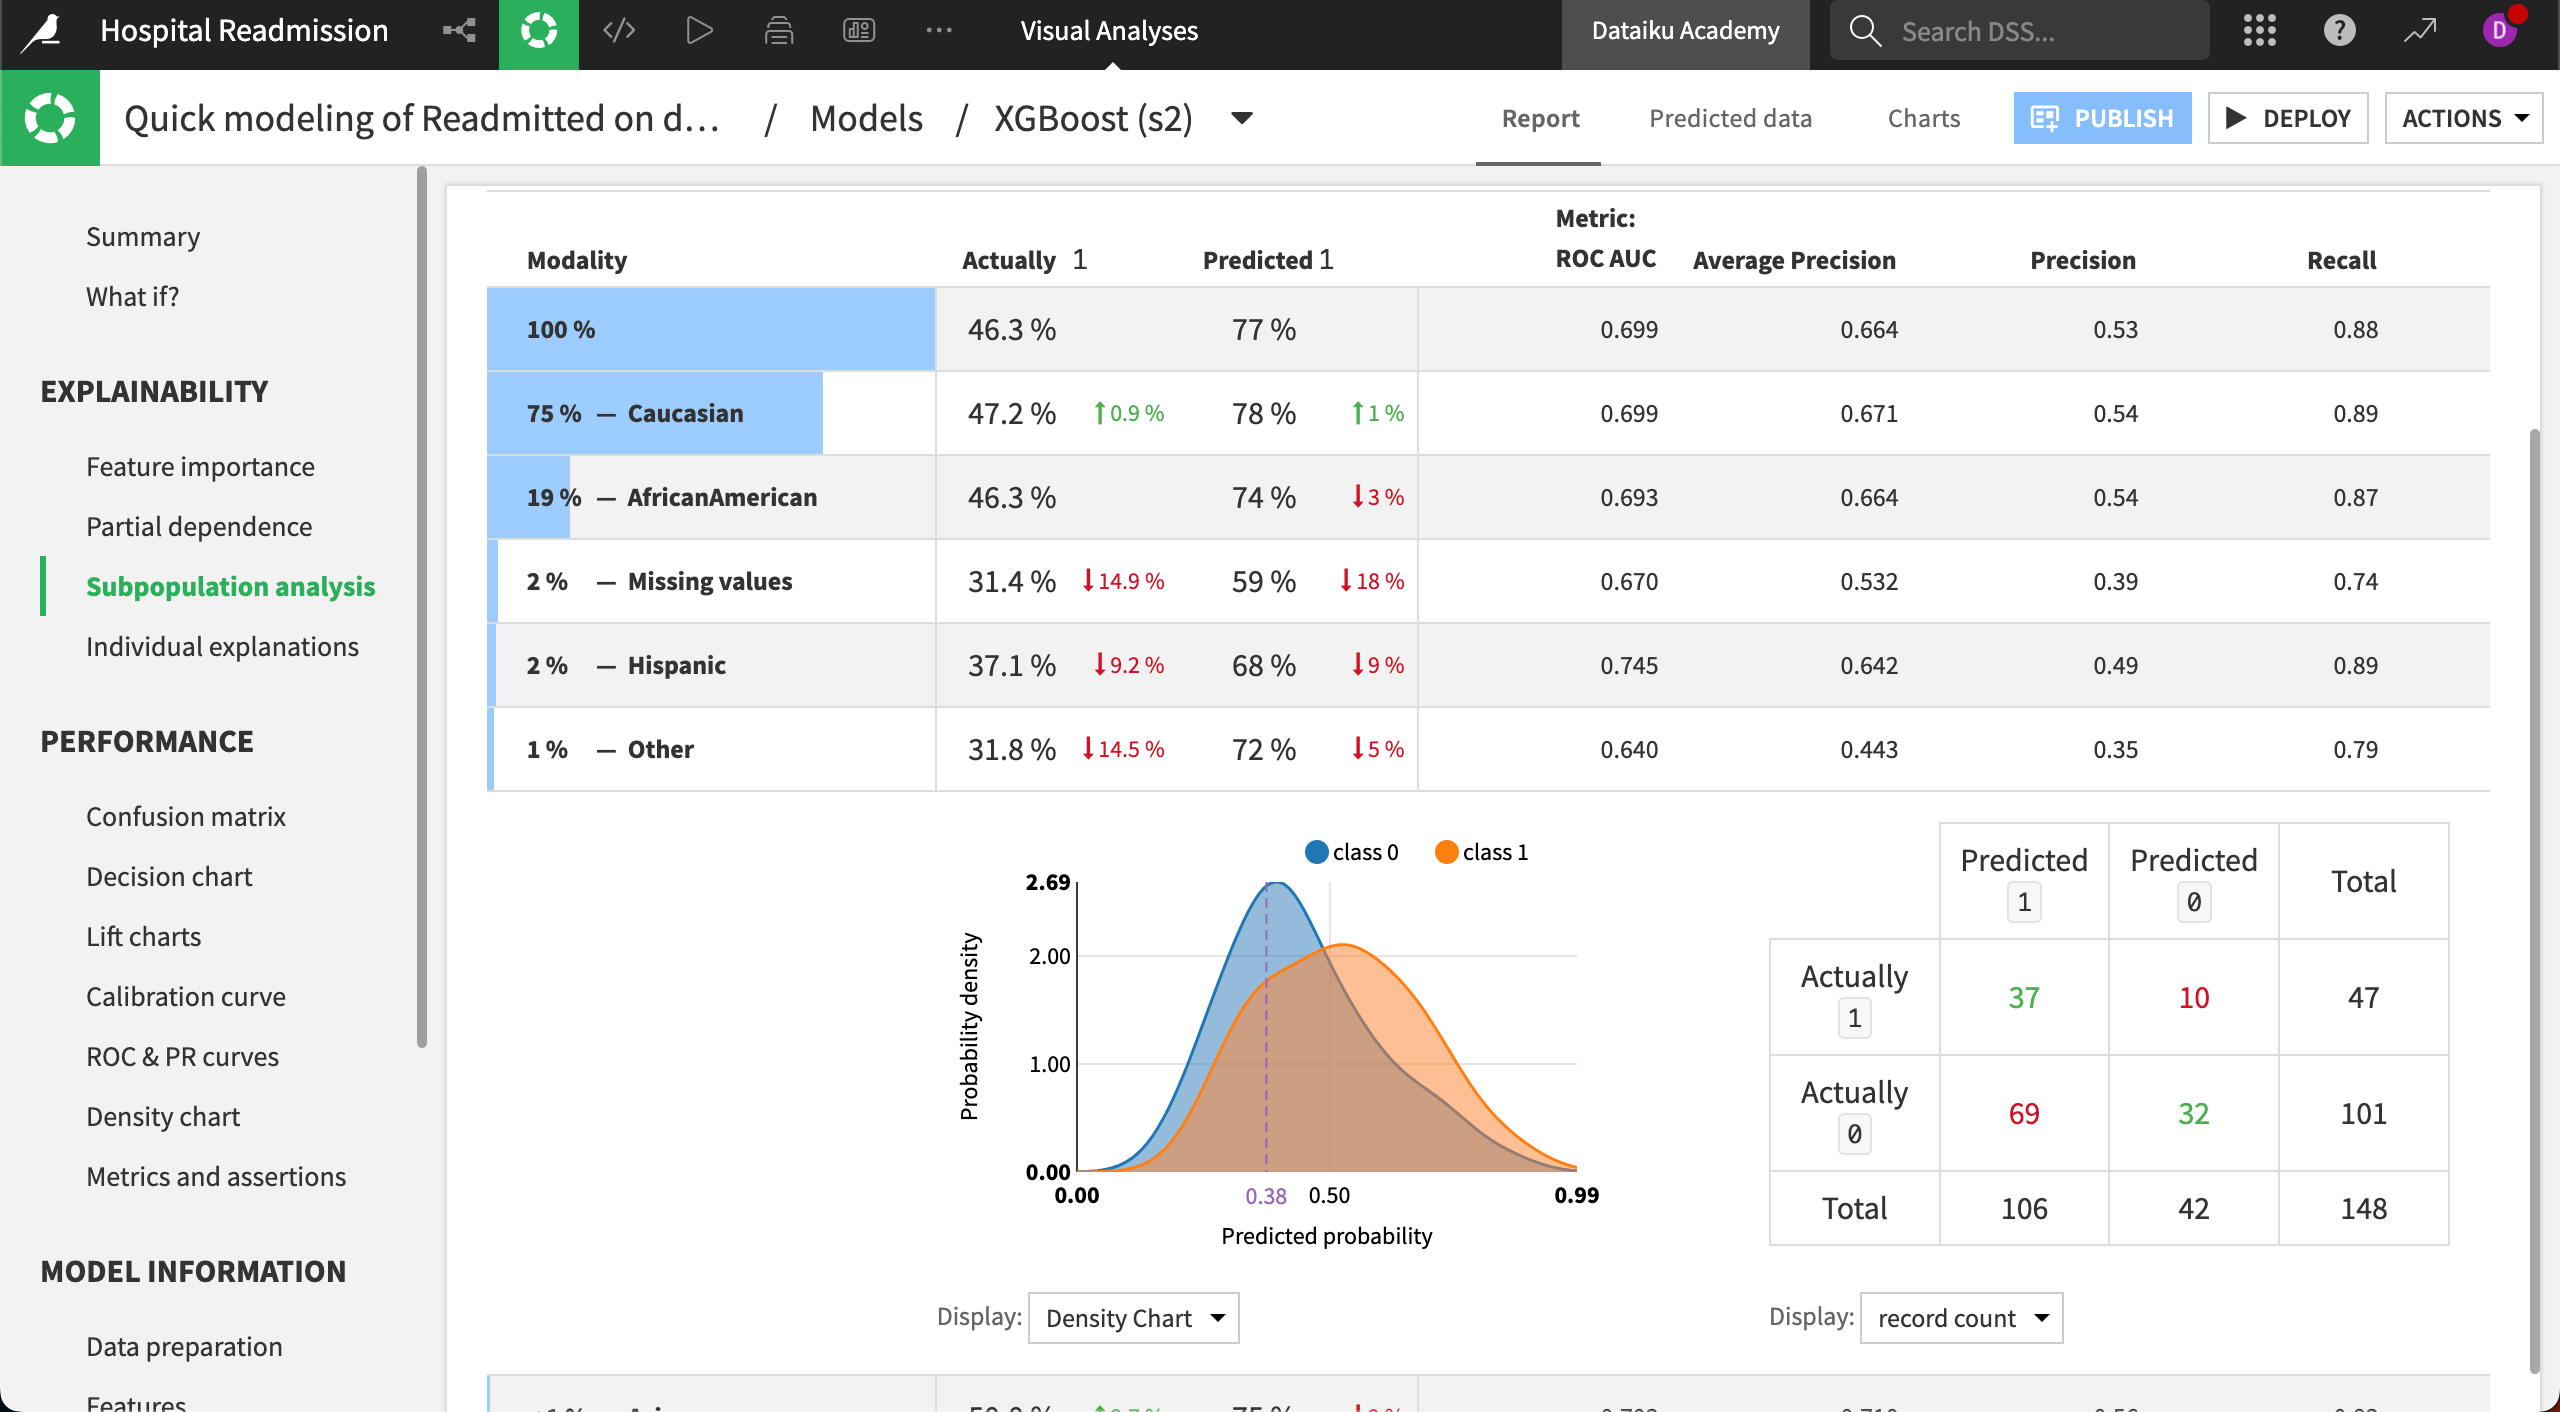
Both categorical and numeric variables can be used to define subpopulations. After selecting a variable, in the first column, we find all unique values or modalities in the dataset. The table makes it easy to compare the overall performance of the model to the performance for each subgroup, across various metrics. We can always add more metrics to the default list.

If we had chosen a numeric variable instead of a categorical one, we would find the distribution divided into bins. The blue bars represent the percentage of values belonging to that category.
Selecting a specific subpopulation reveals that group’s density chart and confusion matrix for a classification task.

In our use case, common metrics like ROC AUC, accuracy, precision, and recall appear to be quite close for the largest subgroups. There is no magic button, however, that can reveal whether our model is fair. It’s ultimately up to us to decide what degree of difference between subgroups is meaningful for our use case and how we want to address those differences.

