Concept | Advanced What if? simulators#
Watch the video or read the summary below.

After you’ve made some predictions with your model, you might want to know if specific changes in your data would yield different outcomes. Knowing what inputs to change and how much to change them to impact a specific outcome is valuable information that can drive business decisions.
Dataiku offers What if analysis, an interactive scoring simulator, to address this need. You can take your interactive scoring even further with advanced options in the What if simulator.
These simulators can help businesses answer questions such as, “What control parameters should we input to ensure an optimized yield of our factory?” or “What changes in features about a transaction might cause that transaction to be labeled as fraudulent?”
The What if simulator offers different options depending on the type of model you are working with:
For classification models, the Explore Neighborhood button will help you explore similar records of a reference point to find out how small changes in inputs could return an alternate class.
For regression models, the Optimize Outcome button allows you to generate records to reach a minimal, maximal, or specific prediction.
Explore neighborhood#
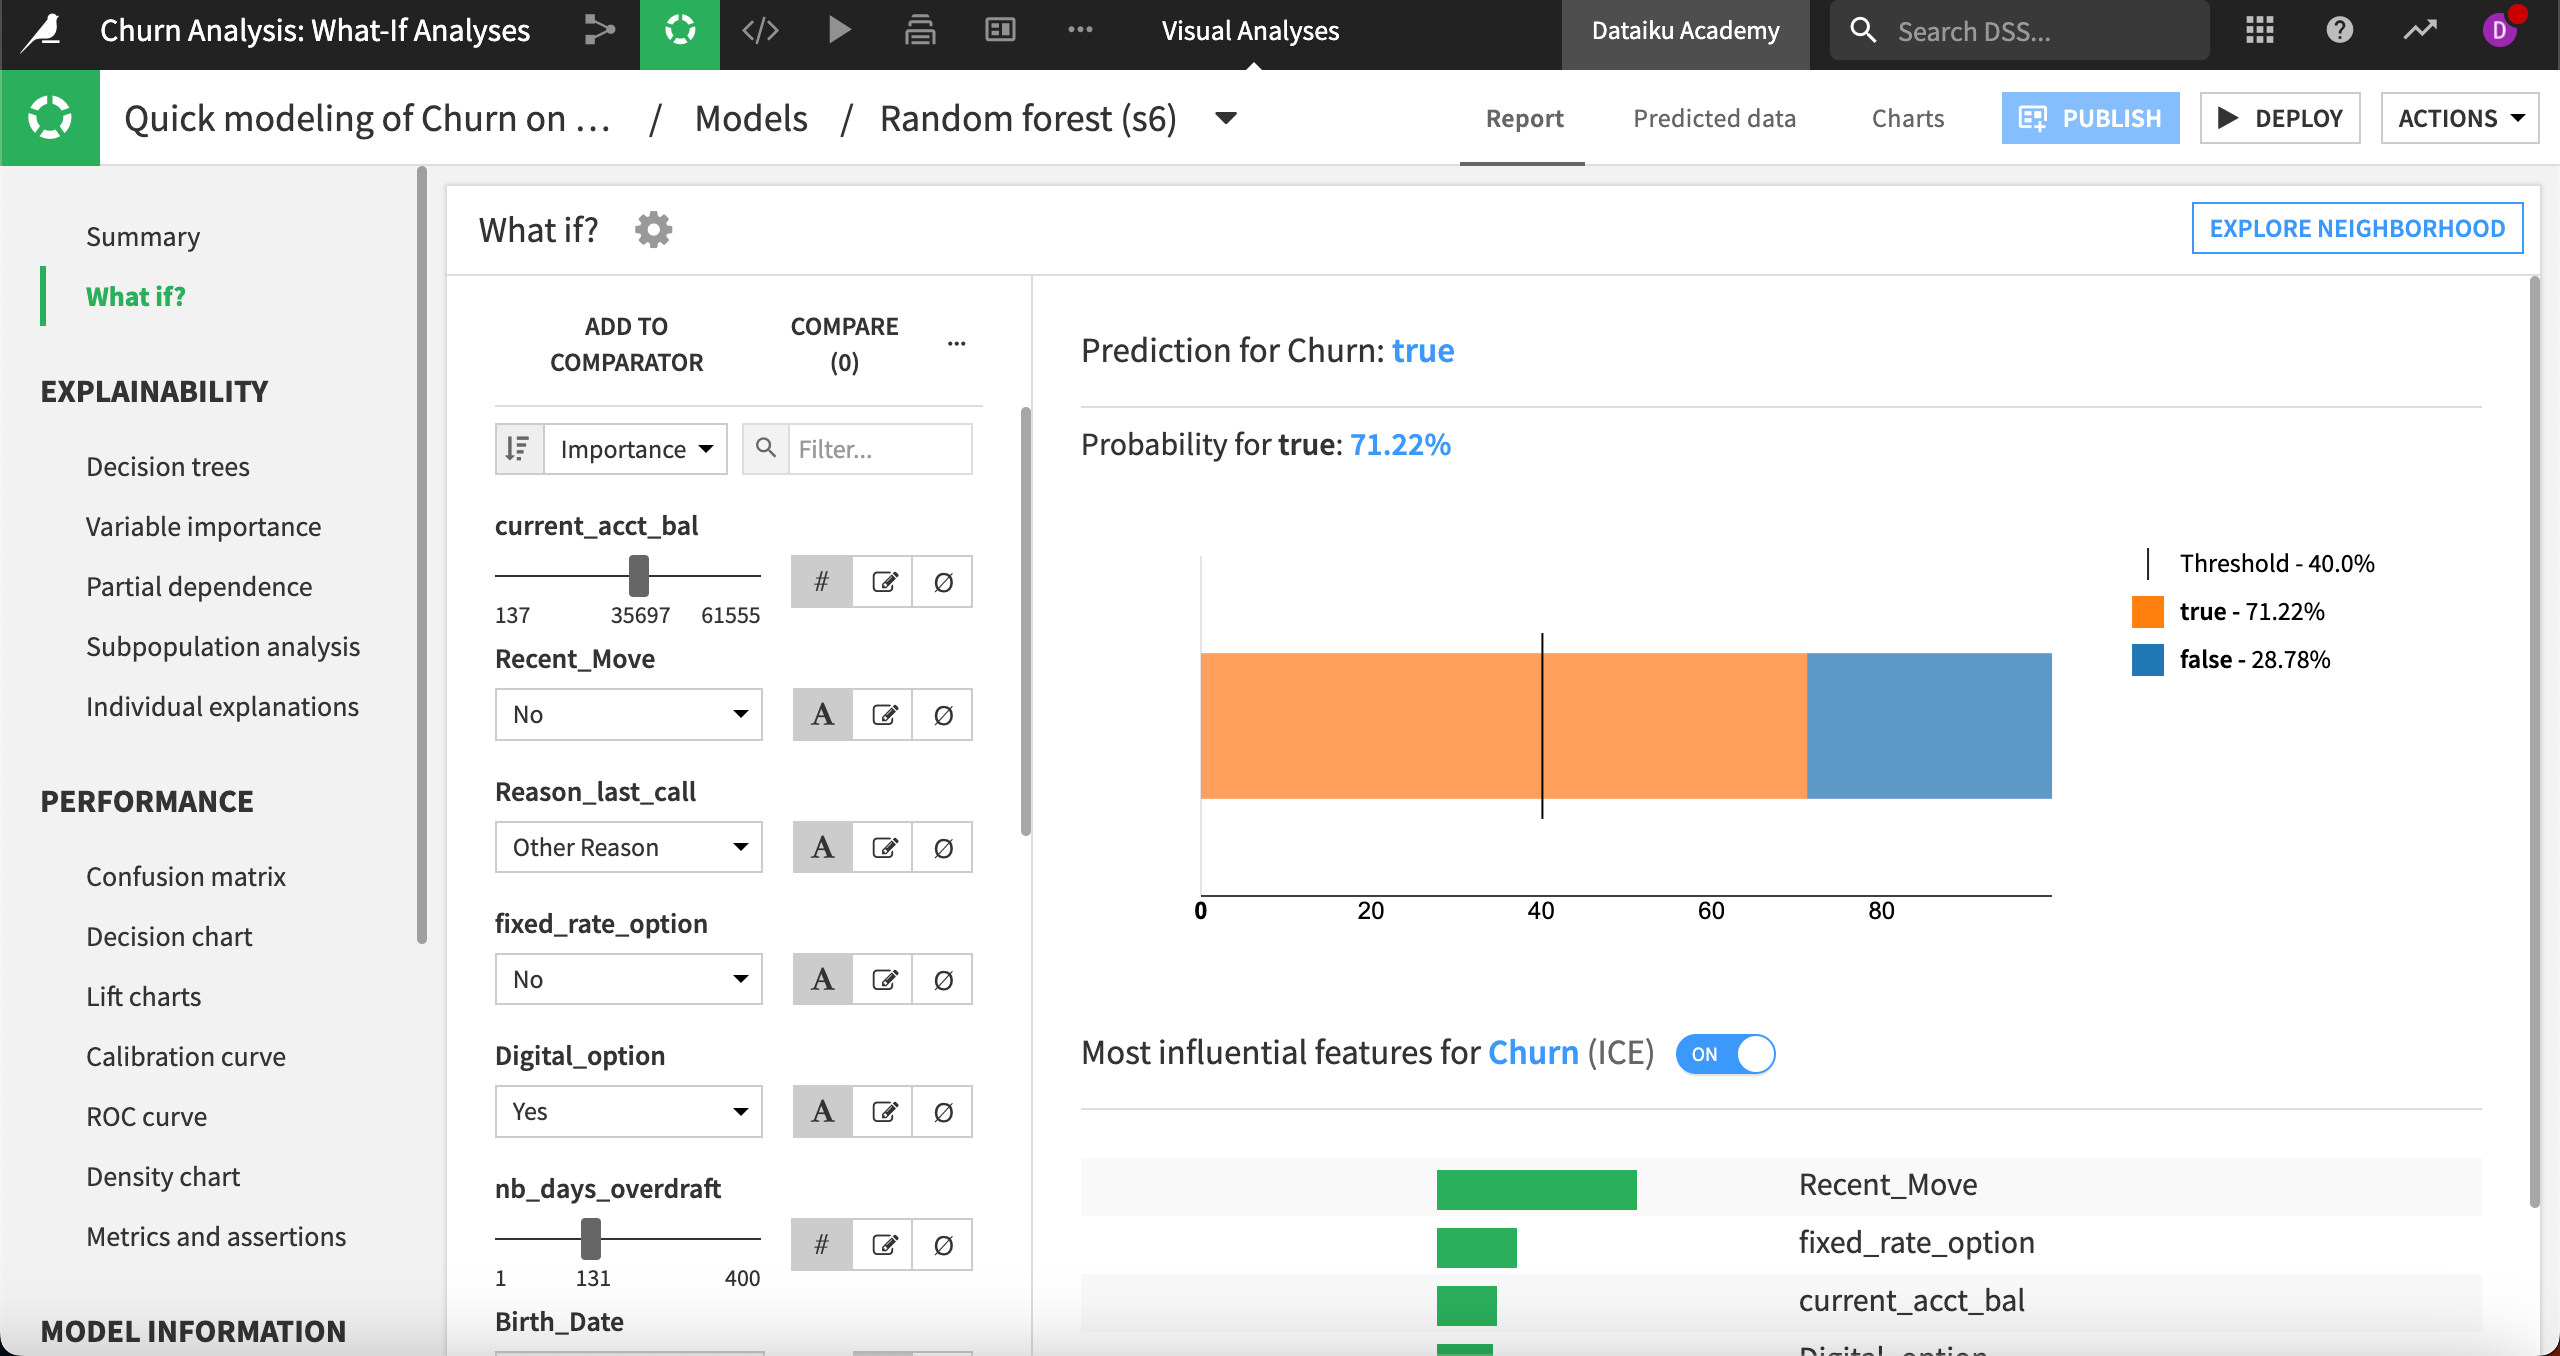
To illustrate how these options work for classification, we’ll use a model predicting whether customers will churn from a subscription.
In our example, we’ve used the What if simulator to create an example customer, or reference record, to see what the model will predict when certain changes are made to features like recent_move, current_acct_bal, and nb_days_overdraft.
For this particular reference record, the results show that the probability of churning is approximately 71%, given our inputs.
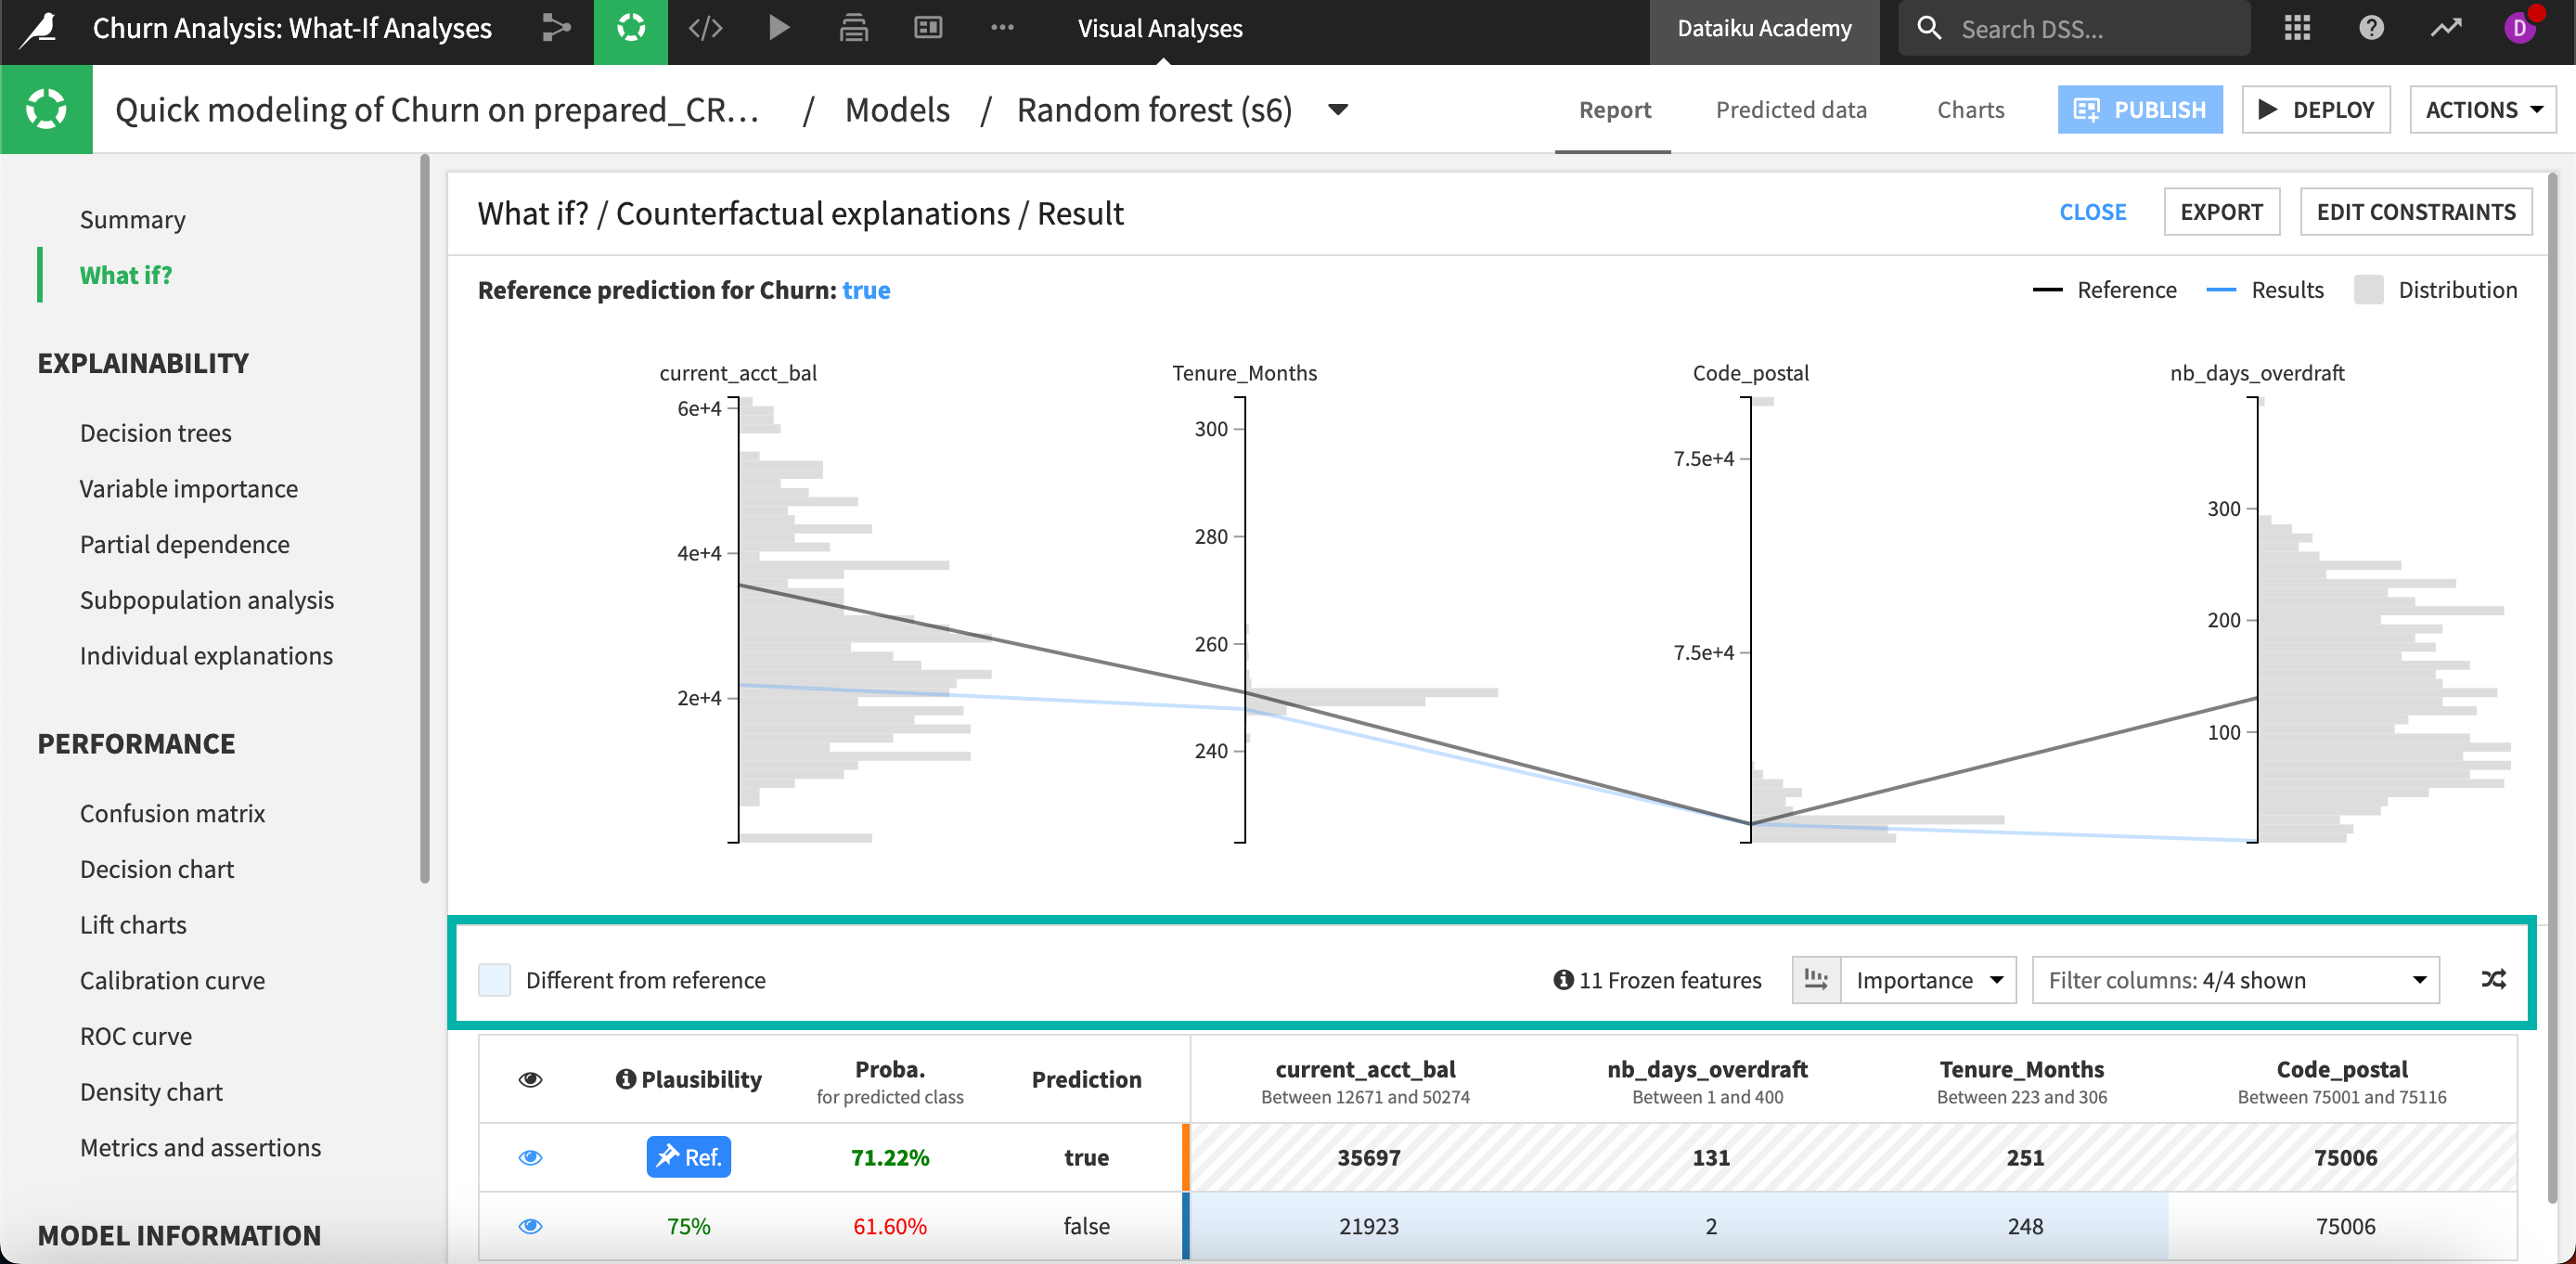
Exploring lots of similar records in this way could get tedious. To automate this task, we’ll go to Explore Neighborhood in the top right and look at Counterfactual explanations.
In the What if? / Counterfactual explanations panel, we can choose which features we want to be actionable, then configure each actionable feature’s minimum and maximum restraints. Note that actionable features represent the variables that will differ from your reference record in your simulations.
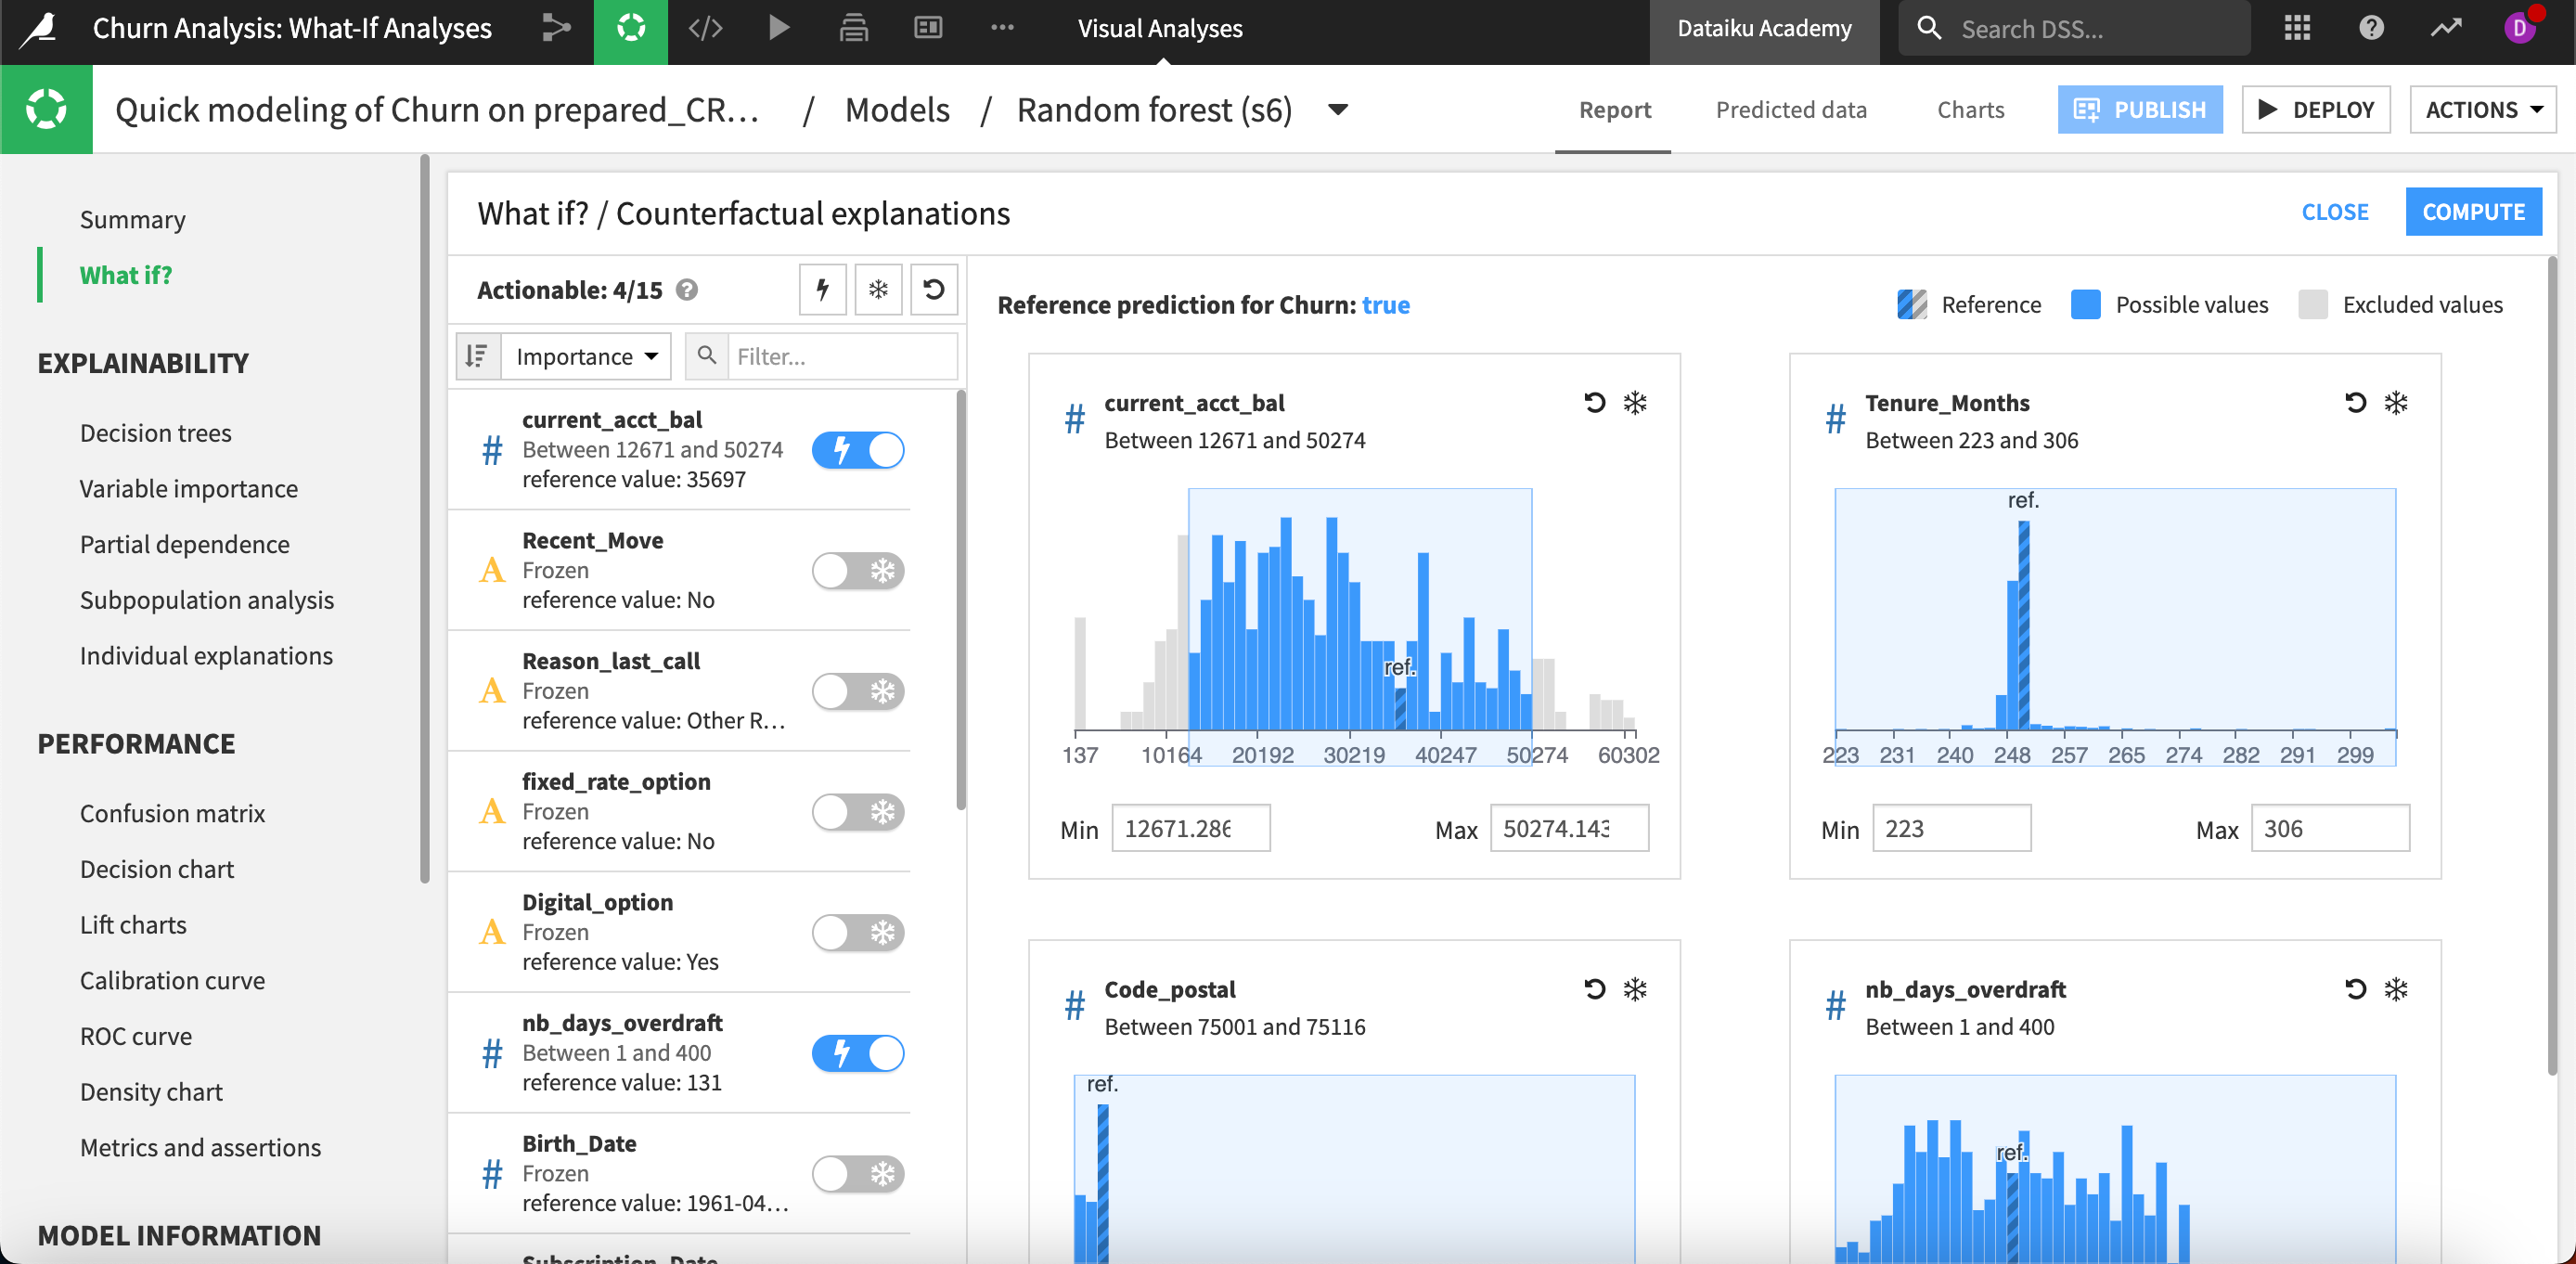
When we click Compute, Dataiku systematically computes new sample records using the actionable features and the specified restraints. The resulting samples represent observations that could happen but haven’t necessarily been seen in the training dataset, each with its plausibility measure.
In this example, we can see a counterfactual record (the blue line on the chart) where the prediction is false. This record is similar to our reference record (the thicker black line on the chart) but differs most in the nb_days_overdraft feature, which could lead to actionable business insights.
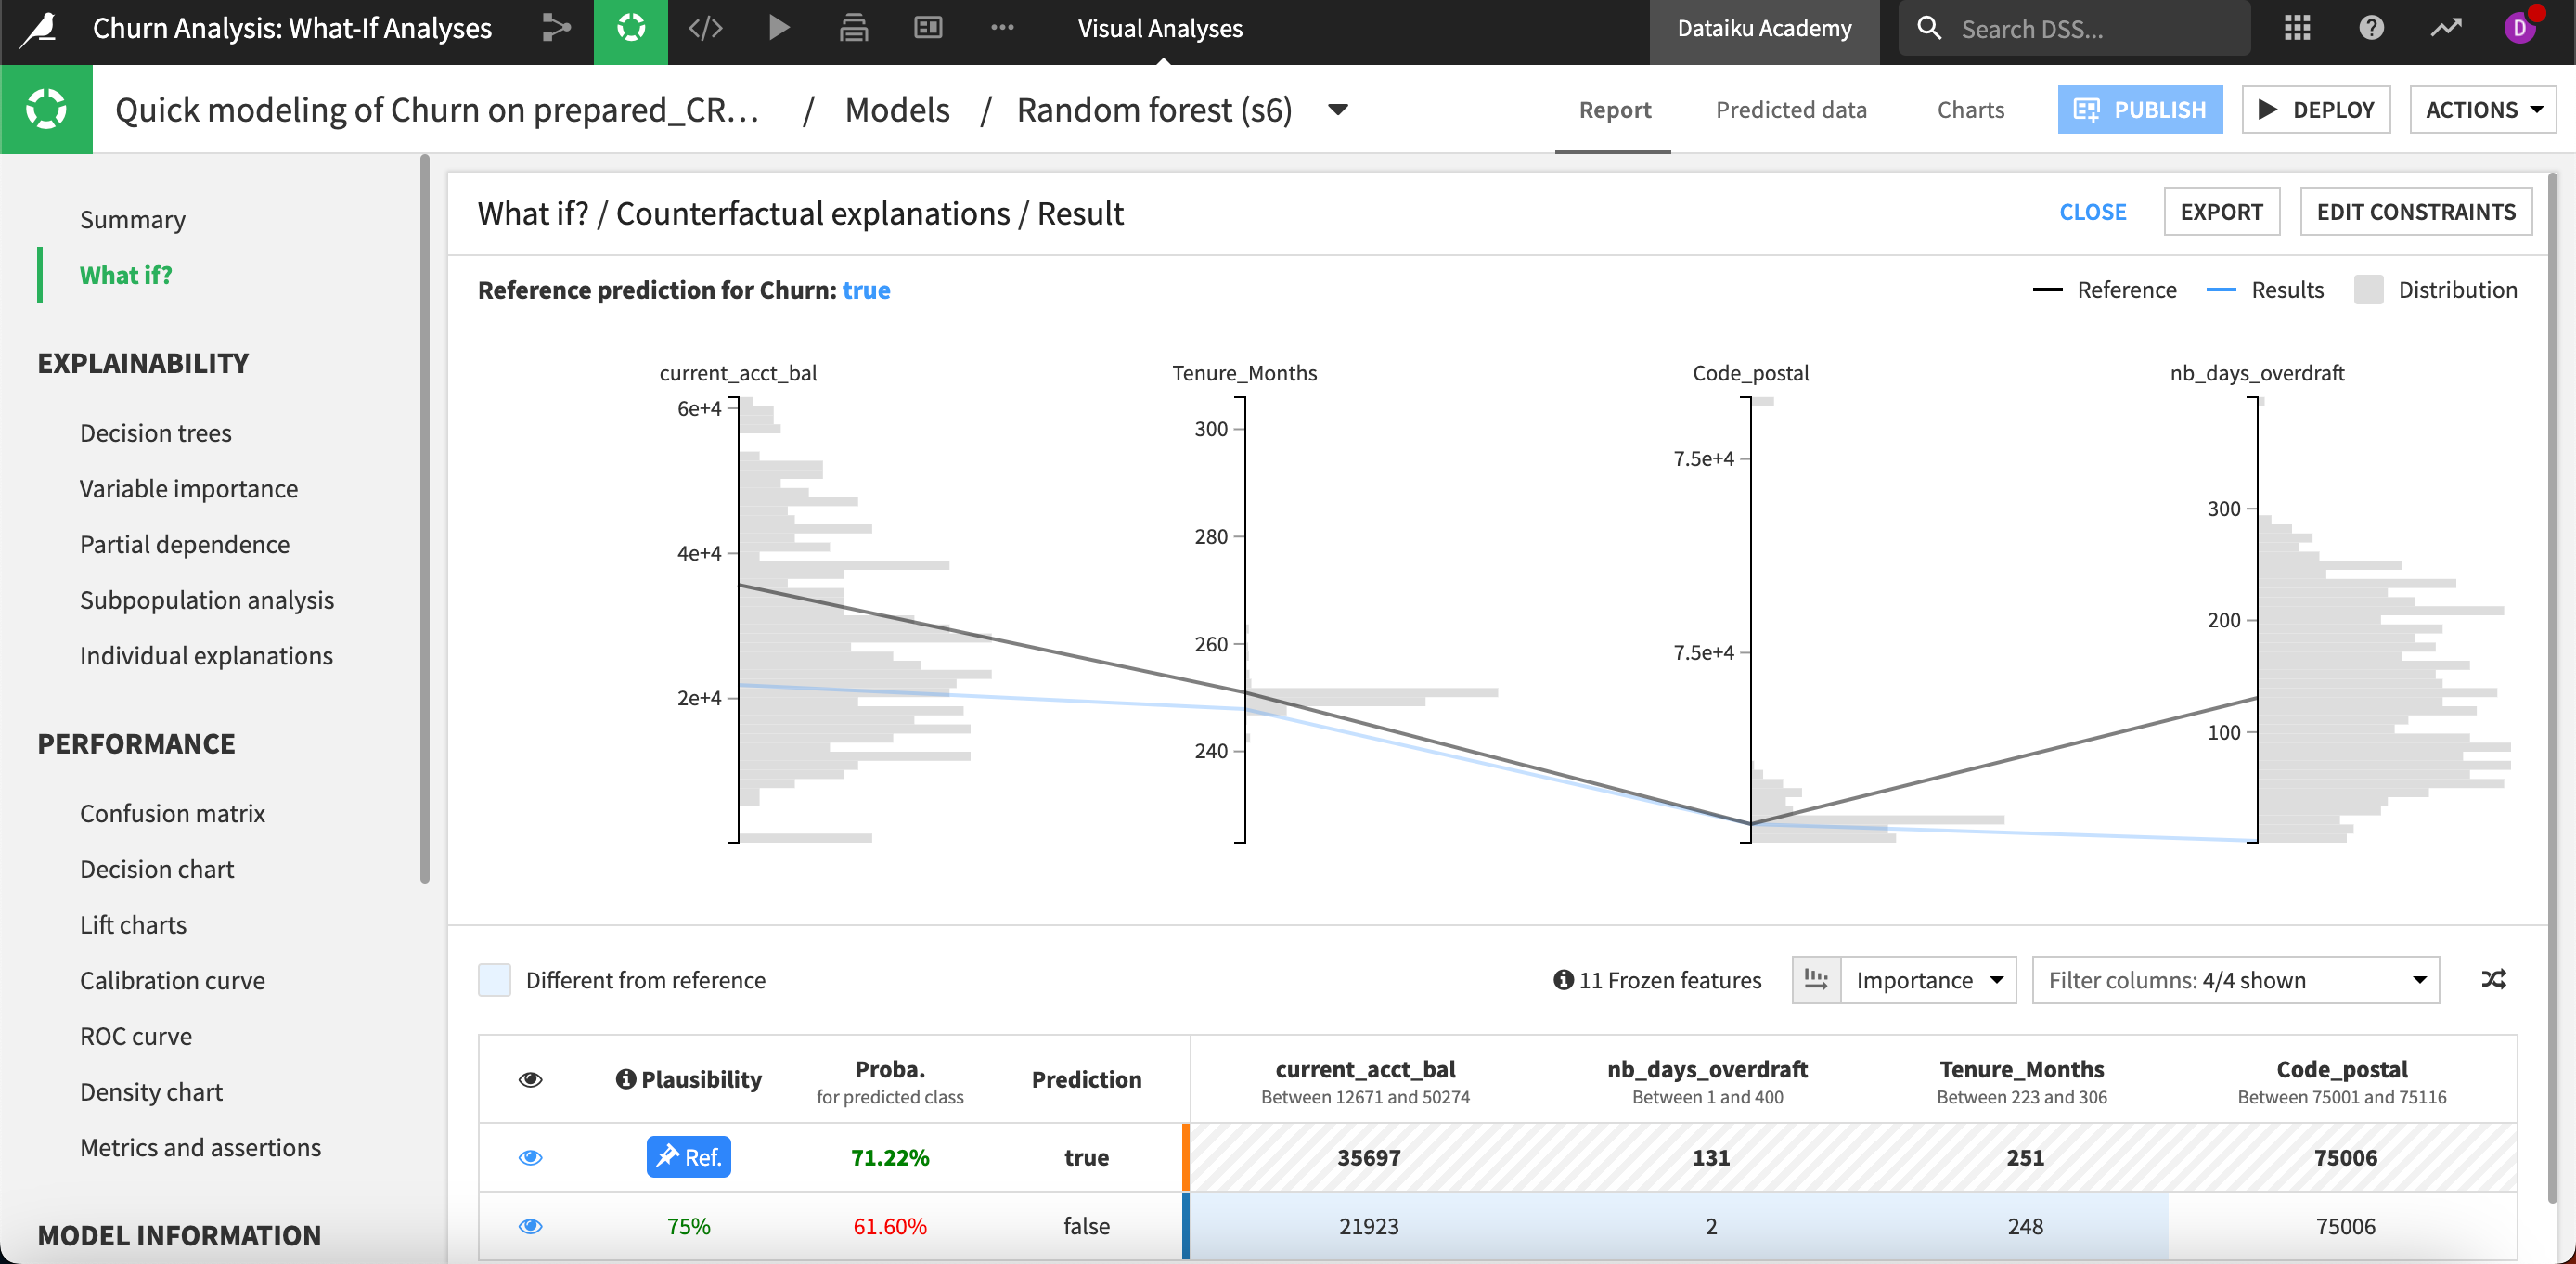
Next, we can interact with the results by selecting to display specific features. We can also return to the What if? simulator and create a new reference record.
Optimize outcome#
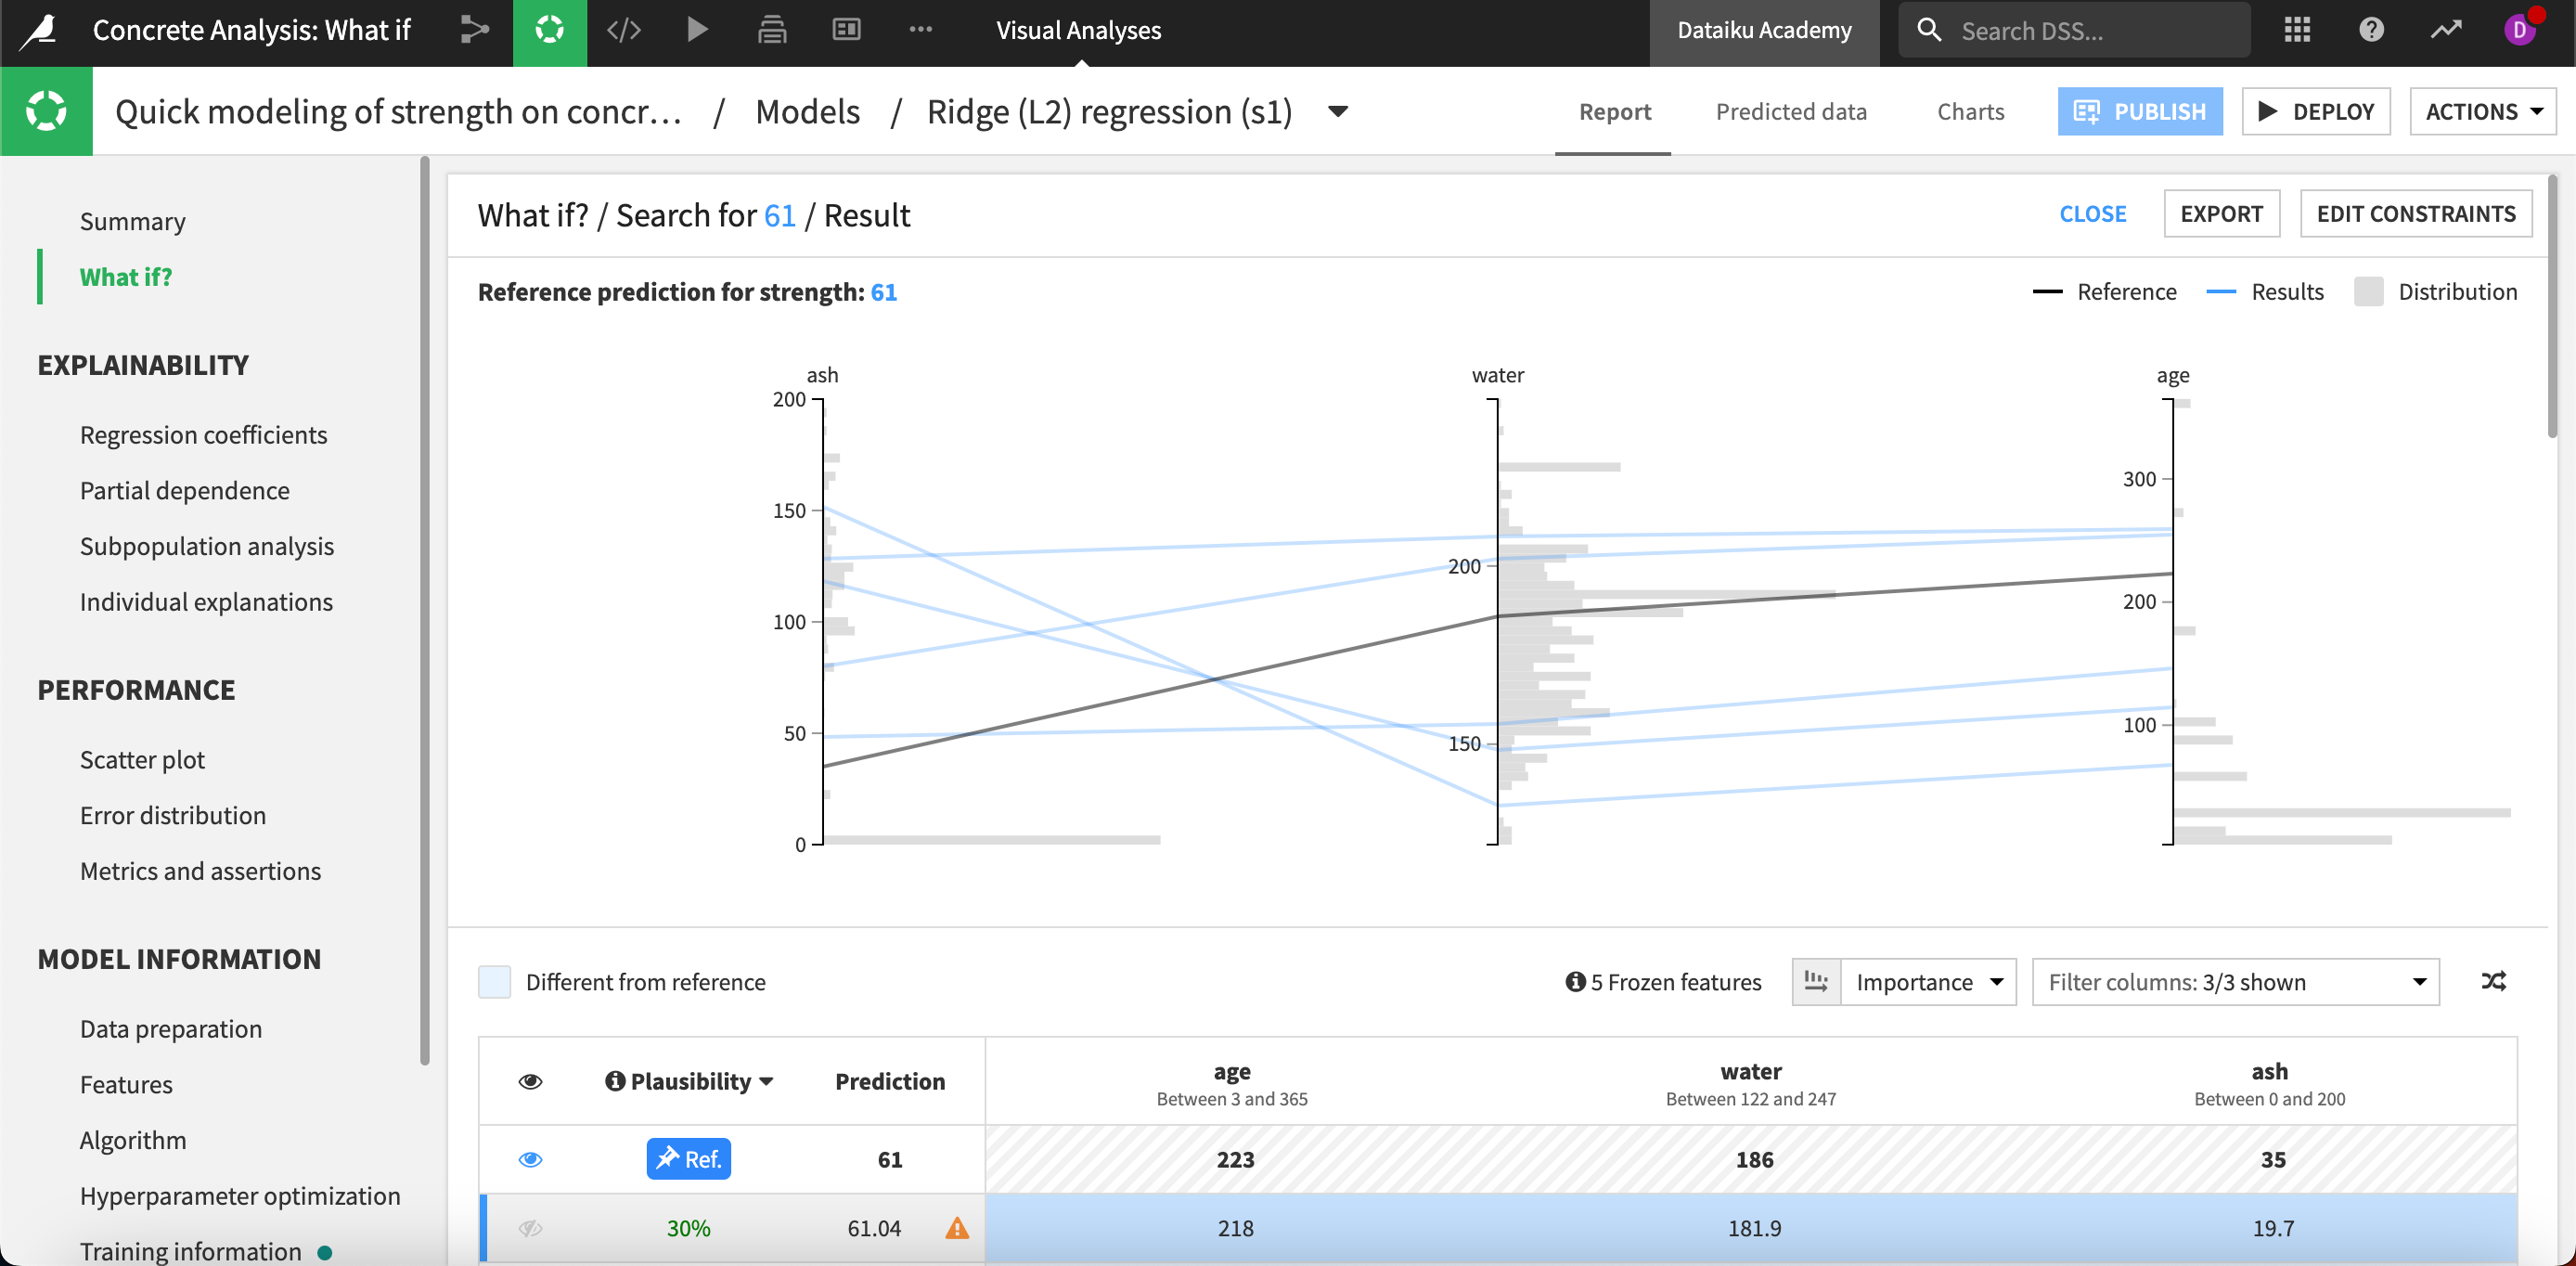
On regression models, the What if accelerator Optimize outcome allows you to change different inputs to achieve a minimum, maximum, or specific target. To illustrate how this works, we’ll use a dataset to predict the strength of concrete based on several features about its components and age.
Again we’ll start by creating a reference record. In this case, our reference point targets the high end of concrete strength.
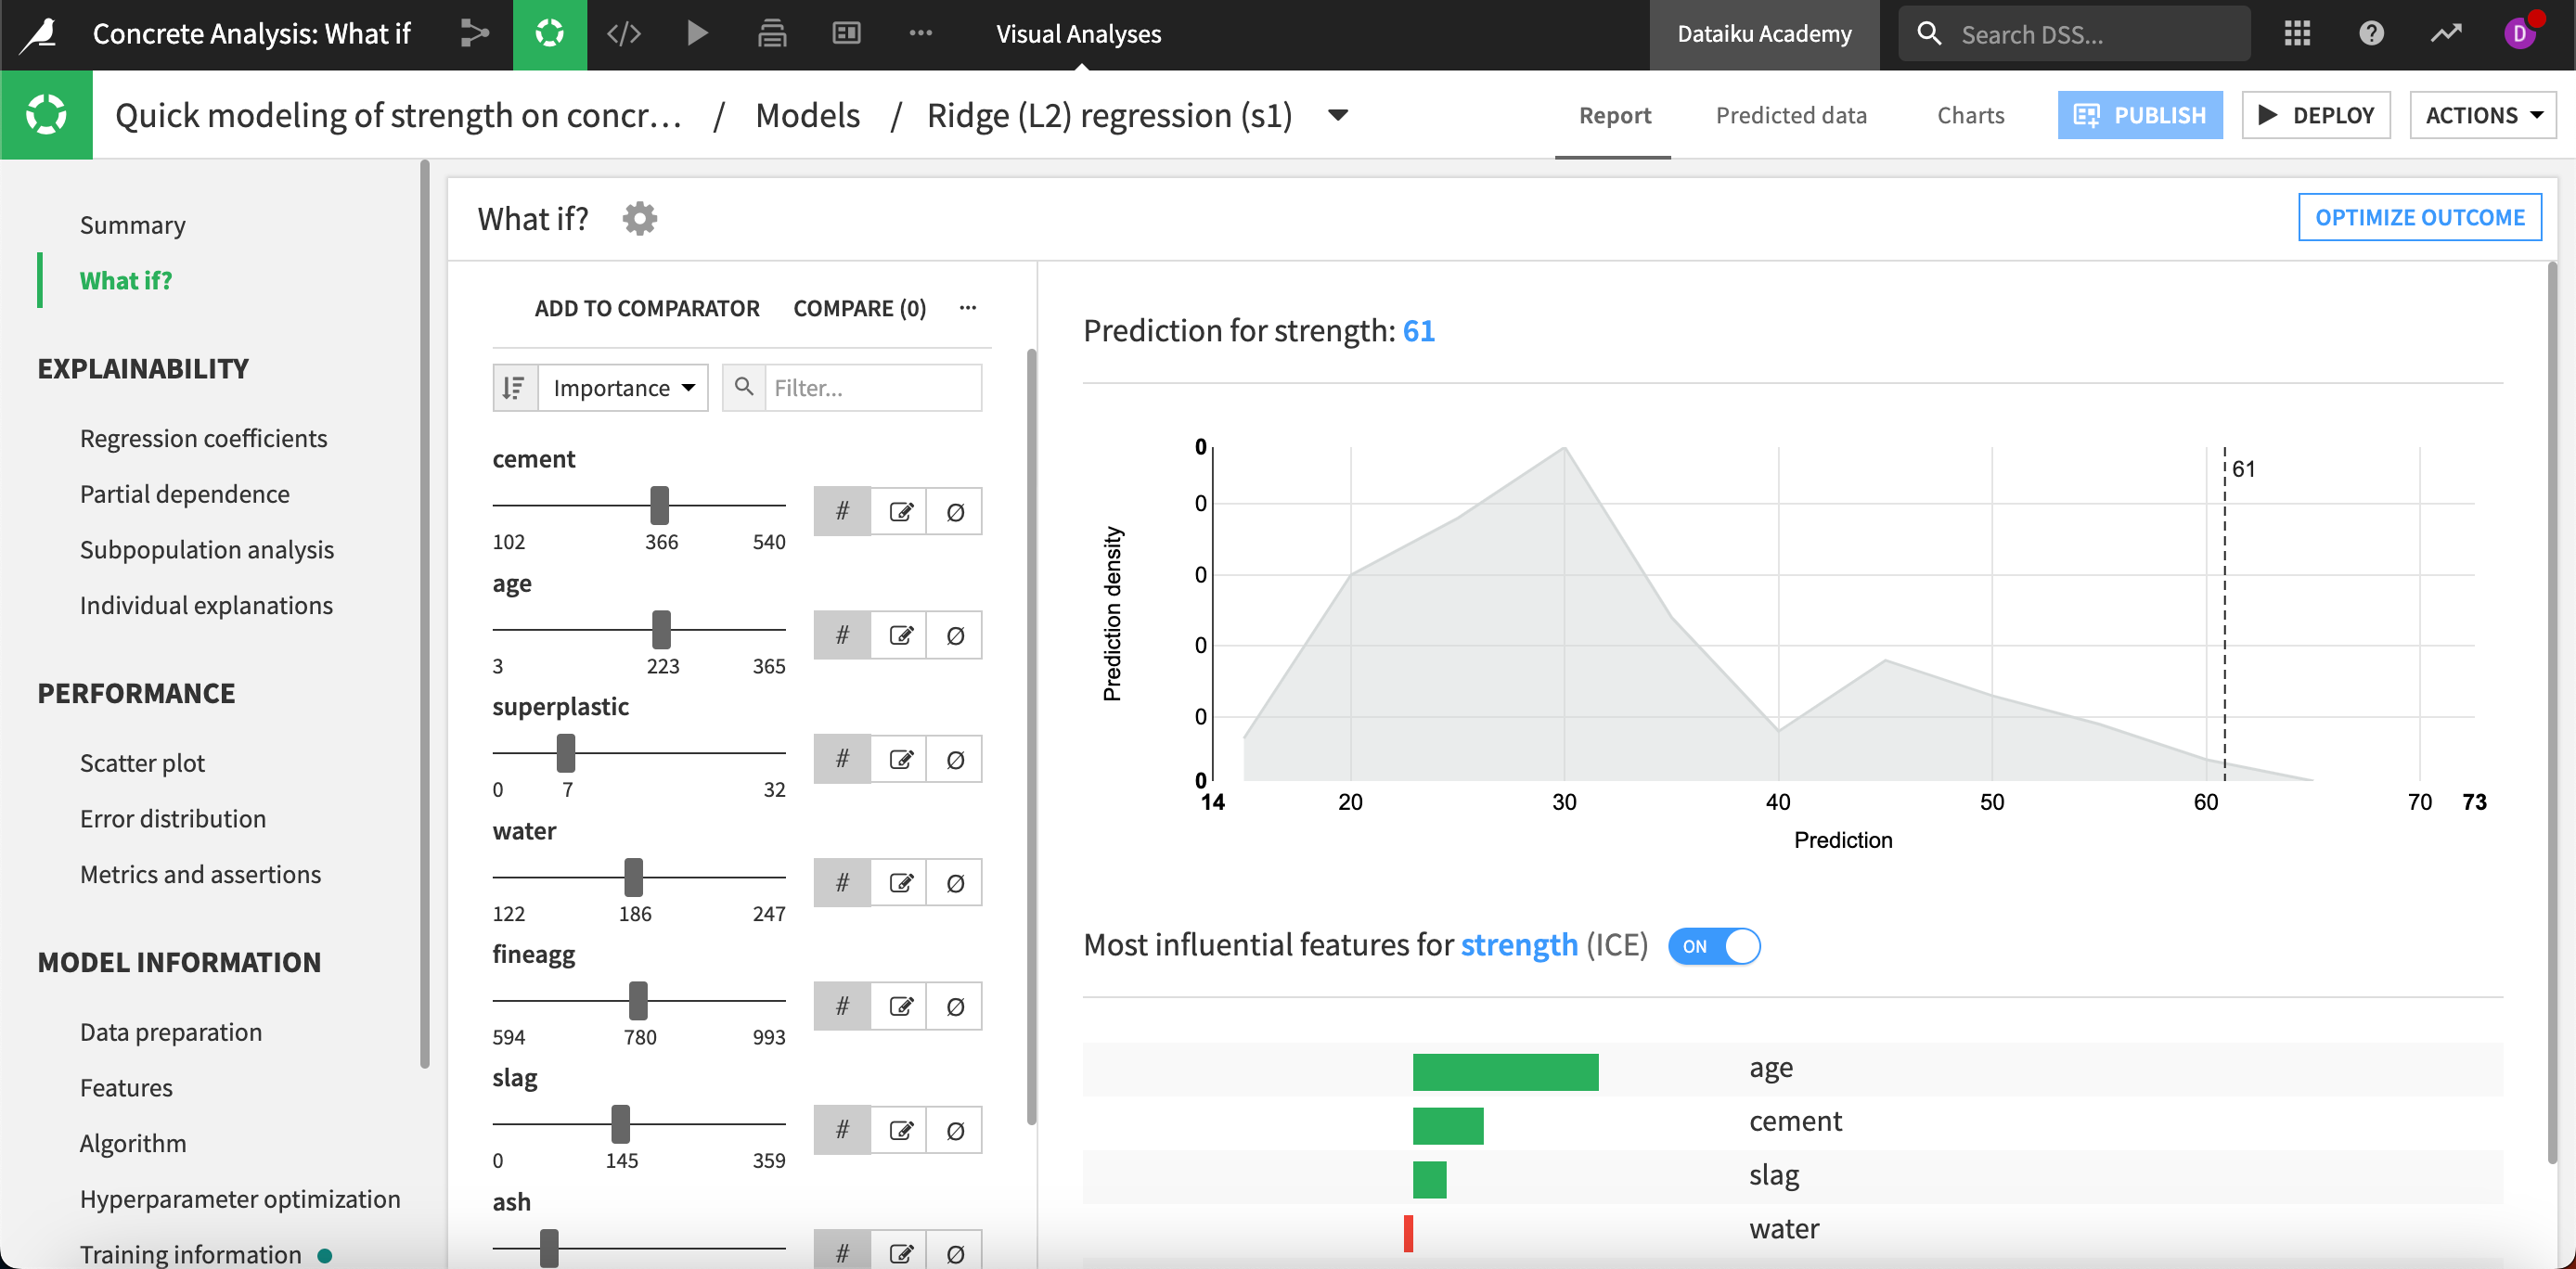
Then, after selecting Optimize outcome in the top right, we can choose which features to be actionable and then set ranges we want to explore for each actionable feature. In addition, we can choose to search for a minimum, maximum, or specific value. We’ll choose our strength value of 61 because we want our concrete to be as strong as it can reasonably be.
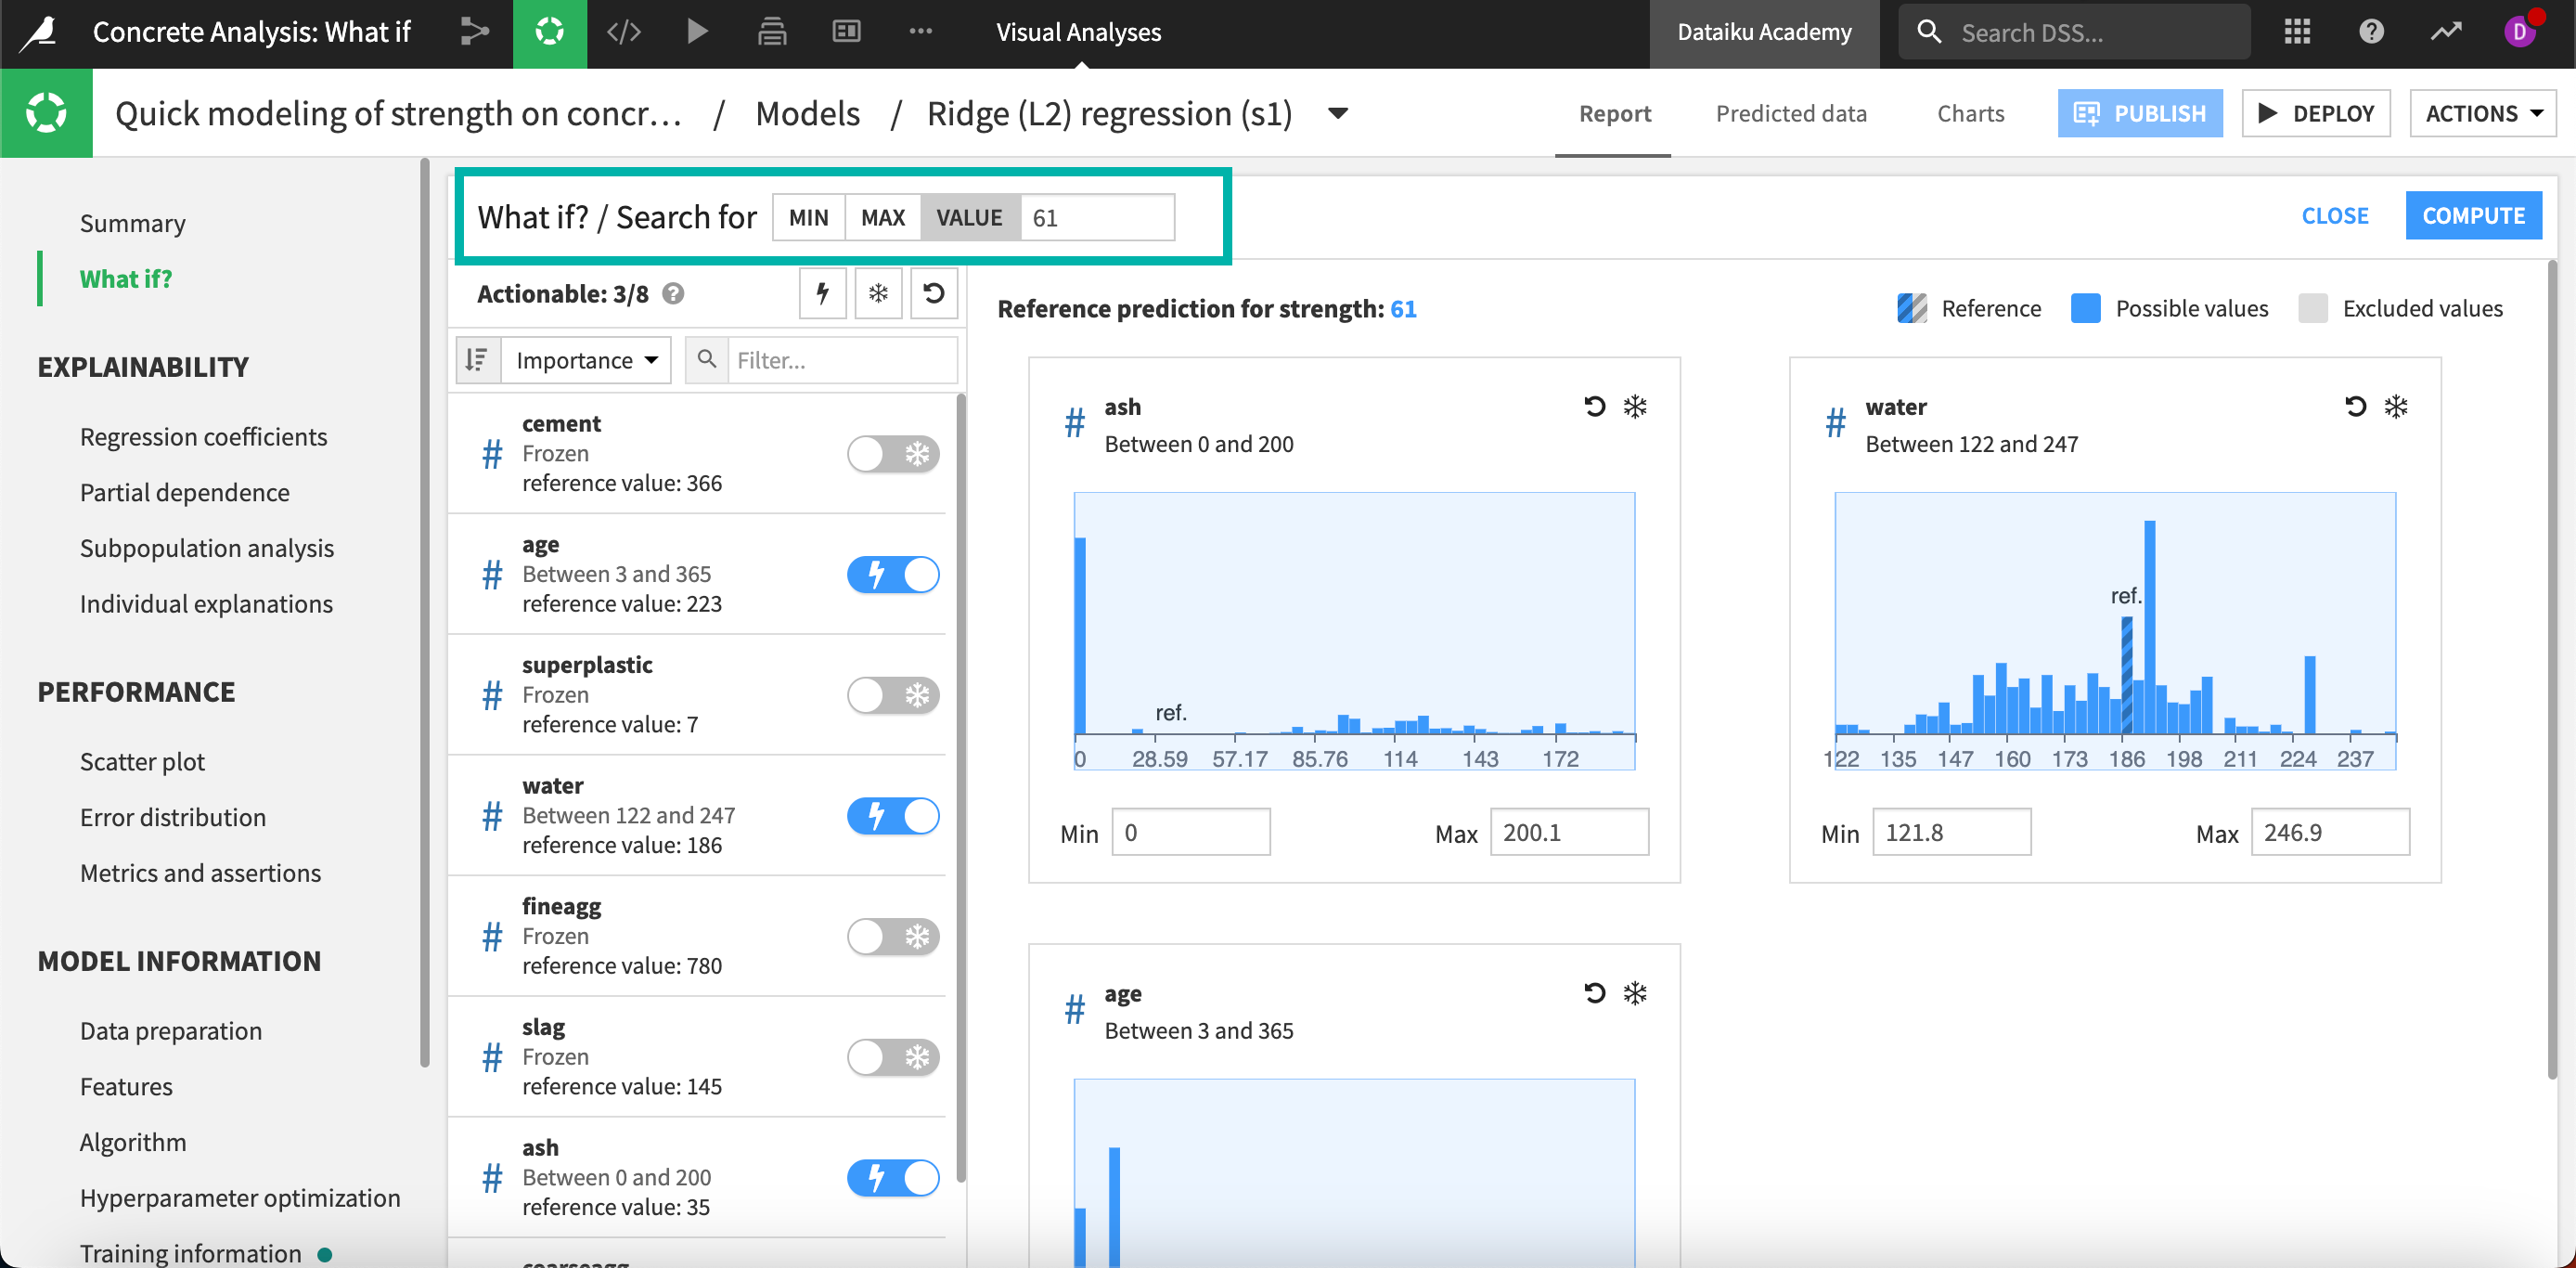
After clicking Compute, the algorithm will explore the actionable features and find combinations where the predicted strength is our target of 61. We can see in the results that the simulated records aren’t very plausible, which means we likely need to edit our constraints or change our target to find more plausible results.