
Concept | Top N recipe#
Watch the video or read the summary below.
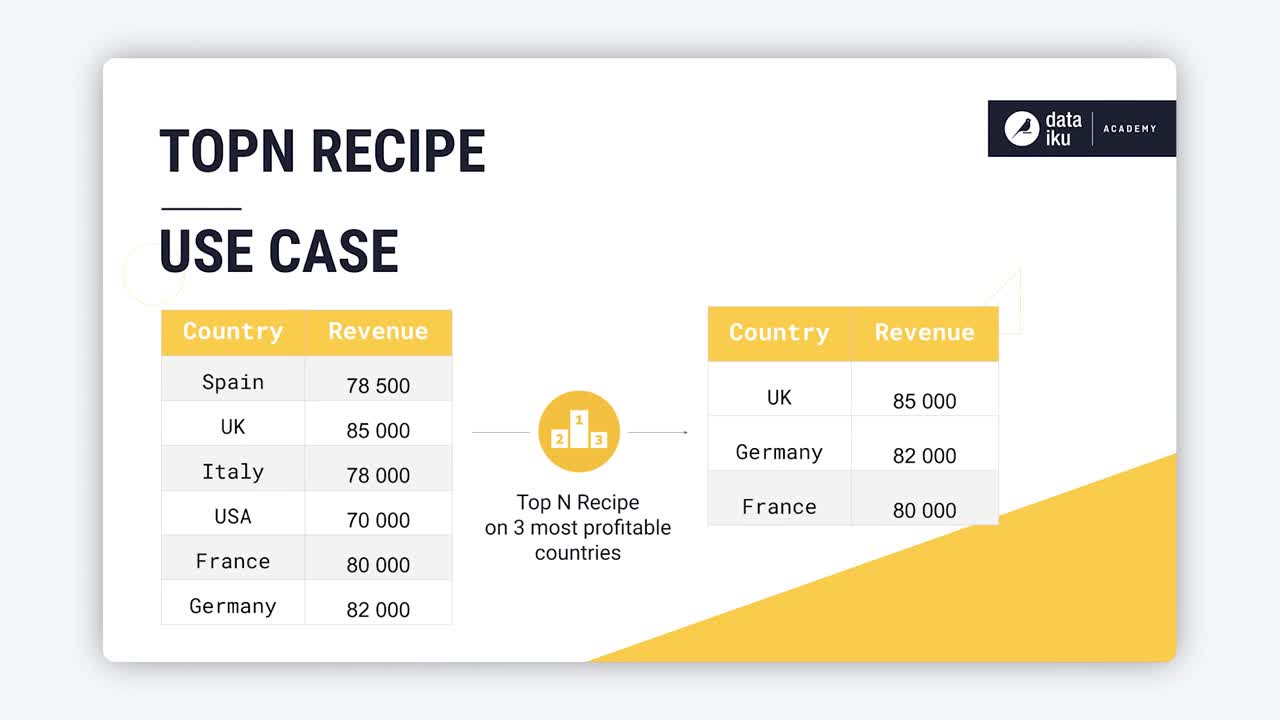
The Top N recipe allows you to extract the highest or lowest rows of a dataset based on one or more sort columns, including with respect to groups.
Use case#
Throughout an analytics process, there are many potential situations where you may need to extract rows that represent the largest or smallest records according to some feature. You might also need to do this with respect to groups within a population.
If you imagine a dataset of credit card transactions, where each row is a unique transaction, you could find the Top N recipe helpful in any of the following situations:
Common use case |
Example |
|---|---|
Identify the most significant records. |
Rank and retain the |
Find the top performers within each group. |
Select the |
Validate data quality and investigate outliers. |
Review the |
Prioritize records for review or action. |
Send the |
Partition a dataset into a target population and the remainder. |
Select the top |
Reduce data volume before downstream processing. |
Keep only the |
A concrete example may better illustrate this kind of transformation. Compare the two datasets below. The dataset on the right has extracted the top two transactions per customer by amount and assigned a rank within each customer.
Top N with other technologies#
The Top N pattern is common across many analytical tools. While syntax differs, the underlying operation is the same: sort a dataset by a metric and retain only the highest (or lowest) ranked rows.
Technology |
Typical expression |
|---|---|
Excel |
Sort a column and take the first |
SQL |
|
Python (pandas) |
|
R (tidyverse) |
|
You could perform the same SQL, Python, or R operation with a code recipe. However, in Dataiku, you’ll often want to reach for the visual Top N recipe for these kinds of data transformations. This recipe unifies multiple transformations into a single reusable operation with built-in ranking, grouping, and dataset splitting.
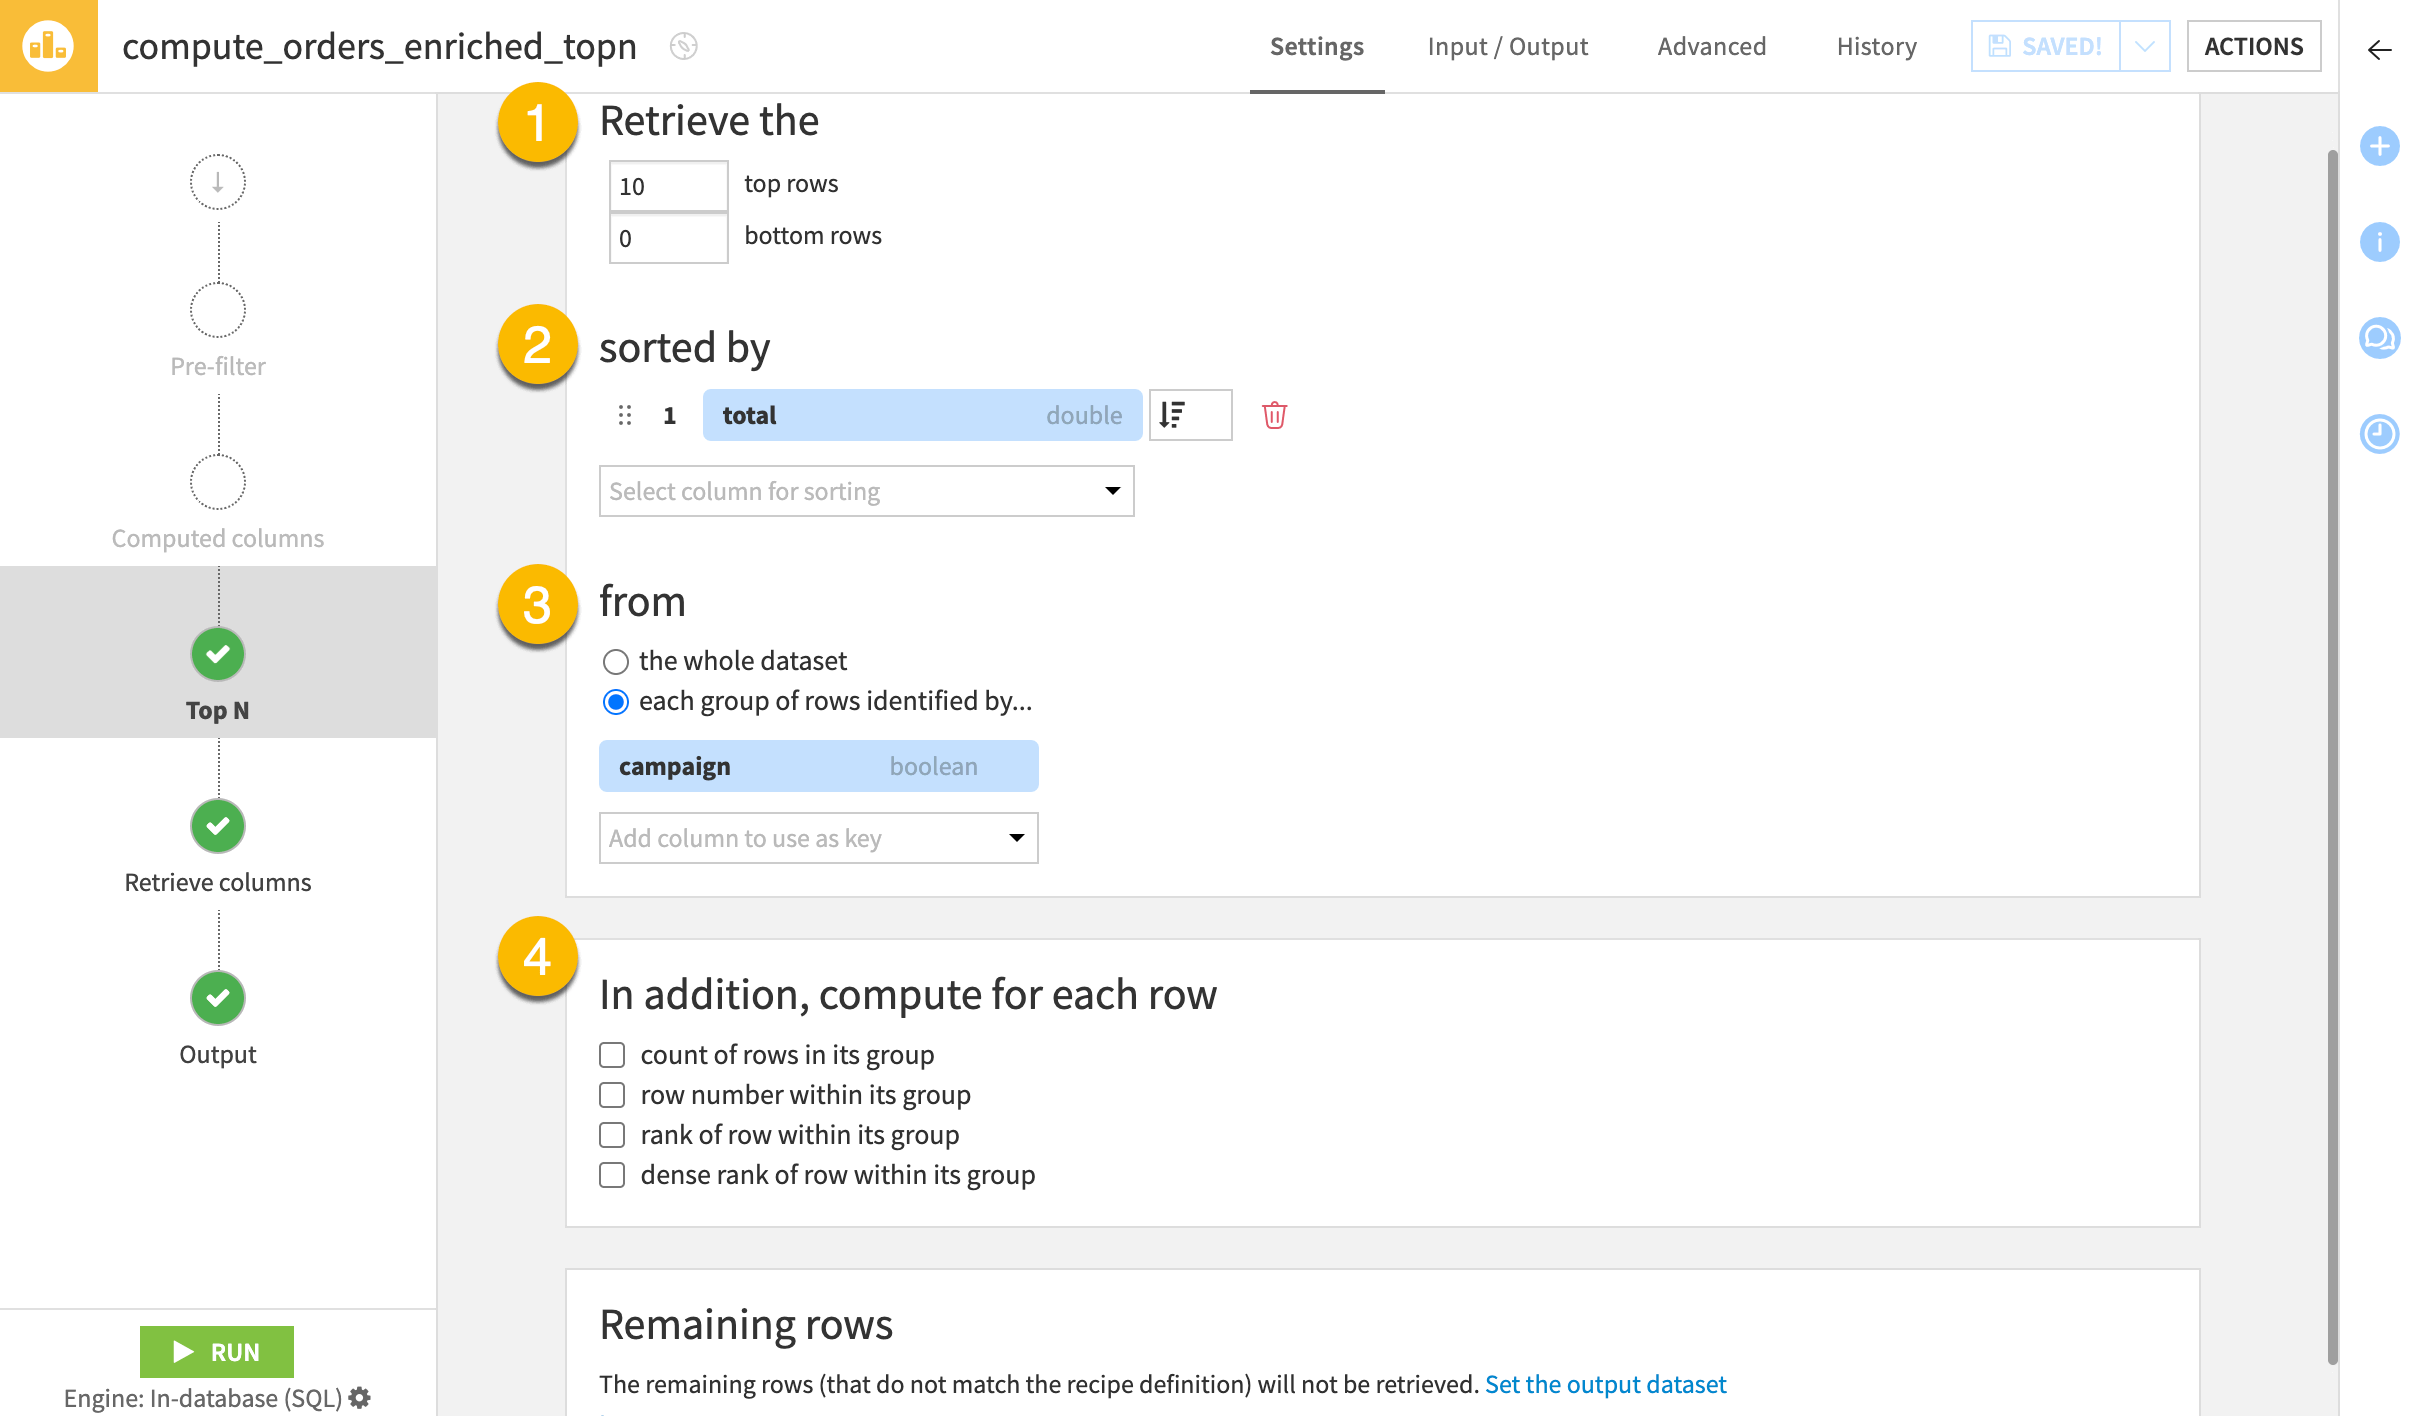
Top N configuration#
To configure the Top N recipe, you need to understand the following five fields found on the Top N step. The example column refers to the tables above.
Top N step field |
Purpose |
Example |
|---|---|---|
Retrieve the (1) |
The number of rows to return from the top or bottom of the dataset |
2, 0 |
sorted by (2) |
The column(s) and the direction by which to arrange the rows |
amount (descending) |
from (3) |
Whole dataset or group subsets |
customer |
In addition, compute for each row (4) |
Optional count or rank columns |
rank of row within its group |
Remaining rows (5) |
Option to send non-qualifying rows to another dataset |
remaining_transactions |
Tip
When defining a sort column(s), think about whether the resulting order is deterministic. In this example, amount, on its own, may result in a number of ties. Different recipe engines may handle ties differently. You’ll want to think about possible edge cases when configuring the recipe.
Next steps#
Continue learning about this recipe by working through the Tutorial | Top N recipe article.
Tip
You can find this content (and more) by registering for the Dataiku Academy course, Visual Recipes. When ready, challenge yourself to earn a certification!