
Concept | Pivot recipe#
Watch the video or read the summary below.
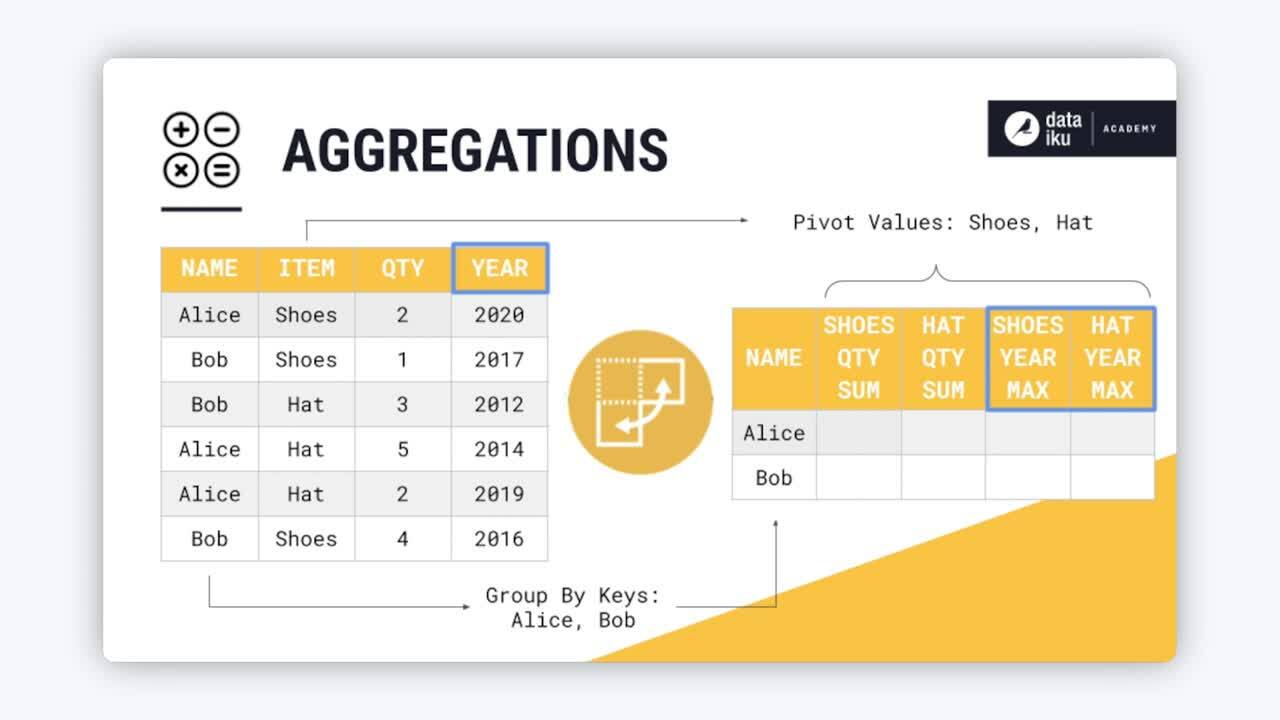
The Pivot recipe transforms datasets into pivot tables, which are tables of summary statistics. You might also refer to this operation as reshaping from long to wide format.
Use case#
For most data work, it’s helpful when one row is one observation. As shown in the the table below, this long format has a number of advantages. For example, if the data records sales per year, it’s easier to have all year values in one column. The alternative would be needing a new column for every year.
name |
item |
quantity |
year |
|---|---|---|---|
Alice |
shoes |
2 |
2020 |
Bob |
shoes |
1 |
2017 |
Bob |
hat |
3 |
2012 |
Alice |
hat |
5 |
2014 |
Alice |
hat |
2 |
2019 |
Bob |
shoes |
4 |
2016 |
However, wide format has its uses too. For example, wide format can be more human readable. This makes it helpful for the summary stage. Think of presentations, reporting, and dashboards. For example, the long format dataset above can’t tell you the total sales of an item for a particular customer. The wide format dataset below can answer these kinds of questions:
name |
shoes_qty_sum |
hat_qty_sum |
shoes_year_max |
hat_year_max |
|---|---|---|---|---|
Alice |
2 |
7 |
2020 |
2019 |
Bob |
5 |
3 |
2017 |
2012 |
Pivoting with other technologies#
Depending on your previous experience with data tools, you’ve likely already performed a pivot.
Technology |
Tool/Function |
|---|---|
Excel |
PivotTable |
SQL |
|
Python (pandas) |
|
R (tidyverse) |
|
You could perform the same SQL, Python, or R operation with a code recipe. However, in Dataiku, you’ll often want to reach for the visual Pivot recipe for this kind of data transformation.
Tip
Dataiku’s Prepare recipe also has a Pivot processor. If you need a basic pivot operation in an existing Prepare recipe, this may be an option for you.
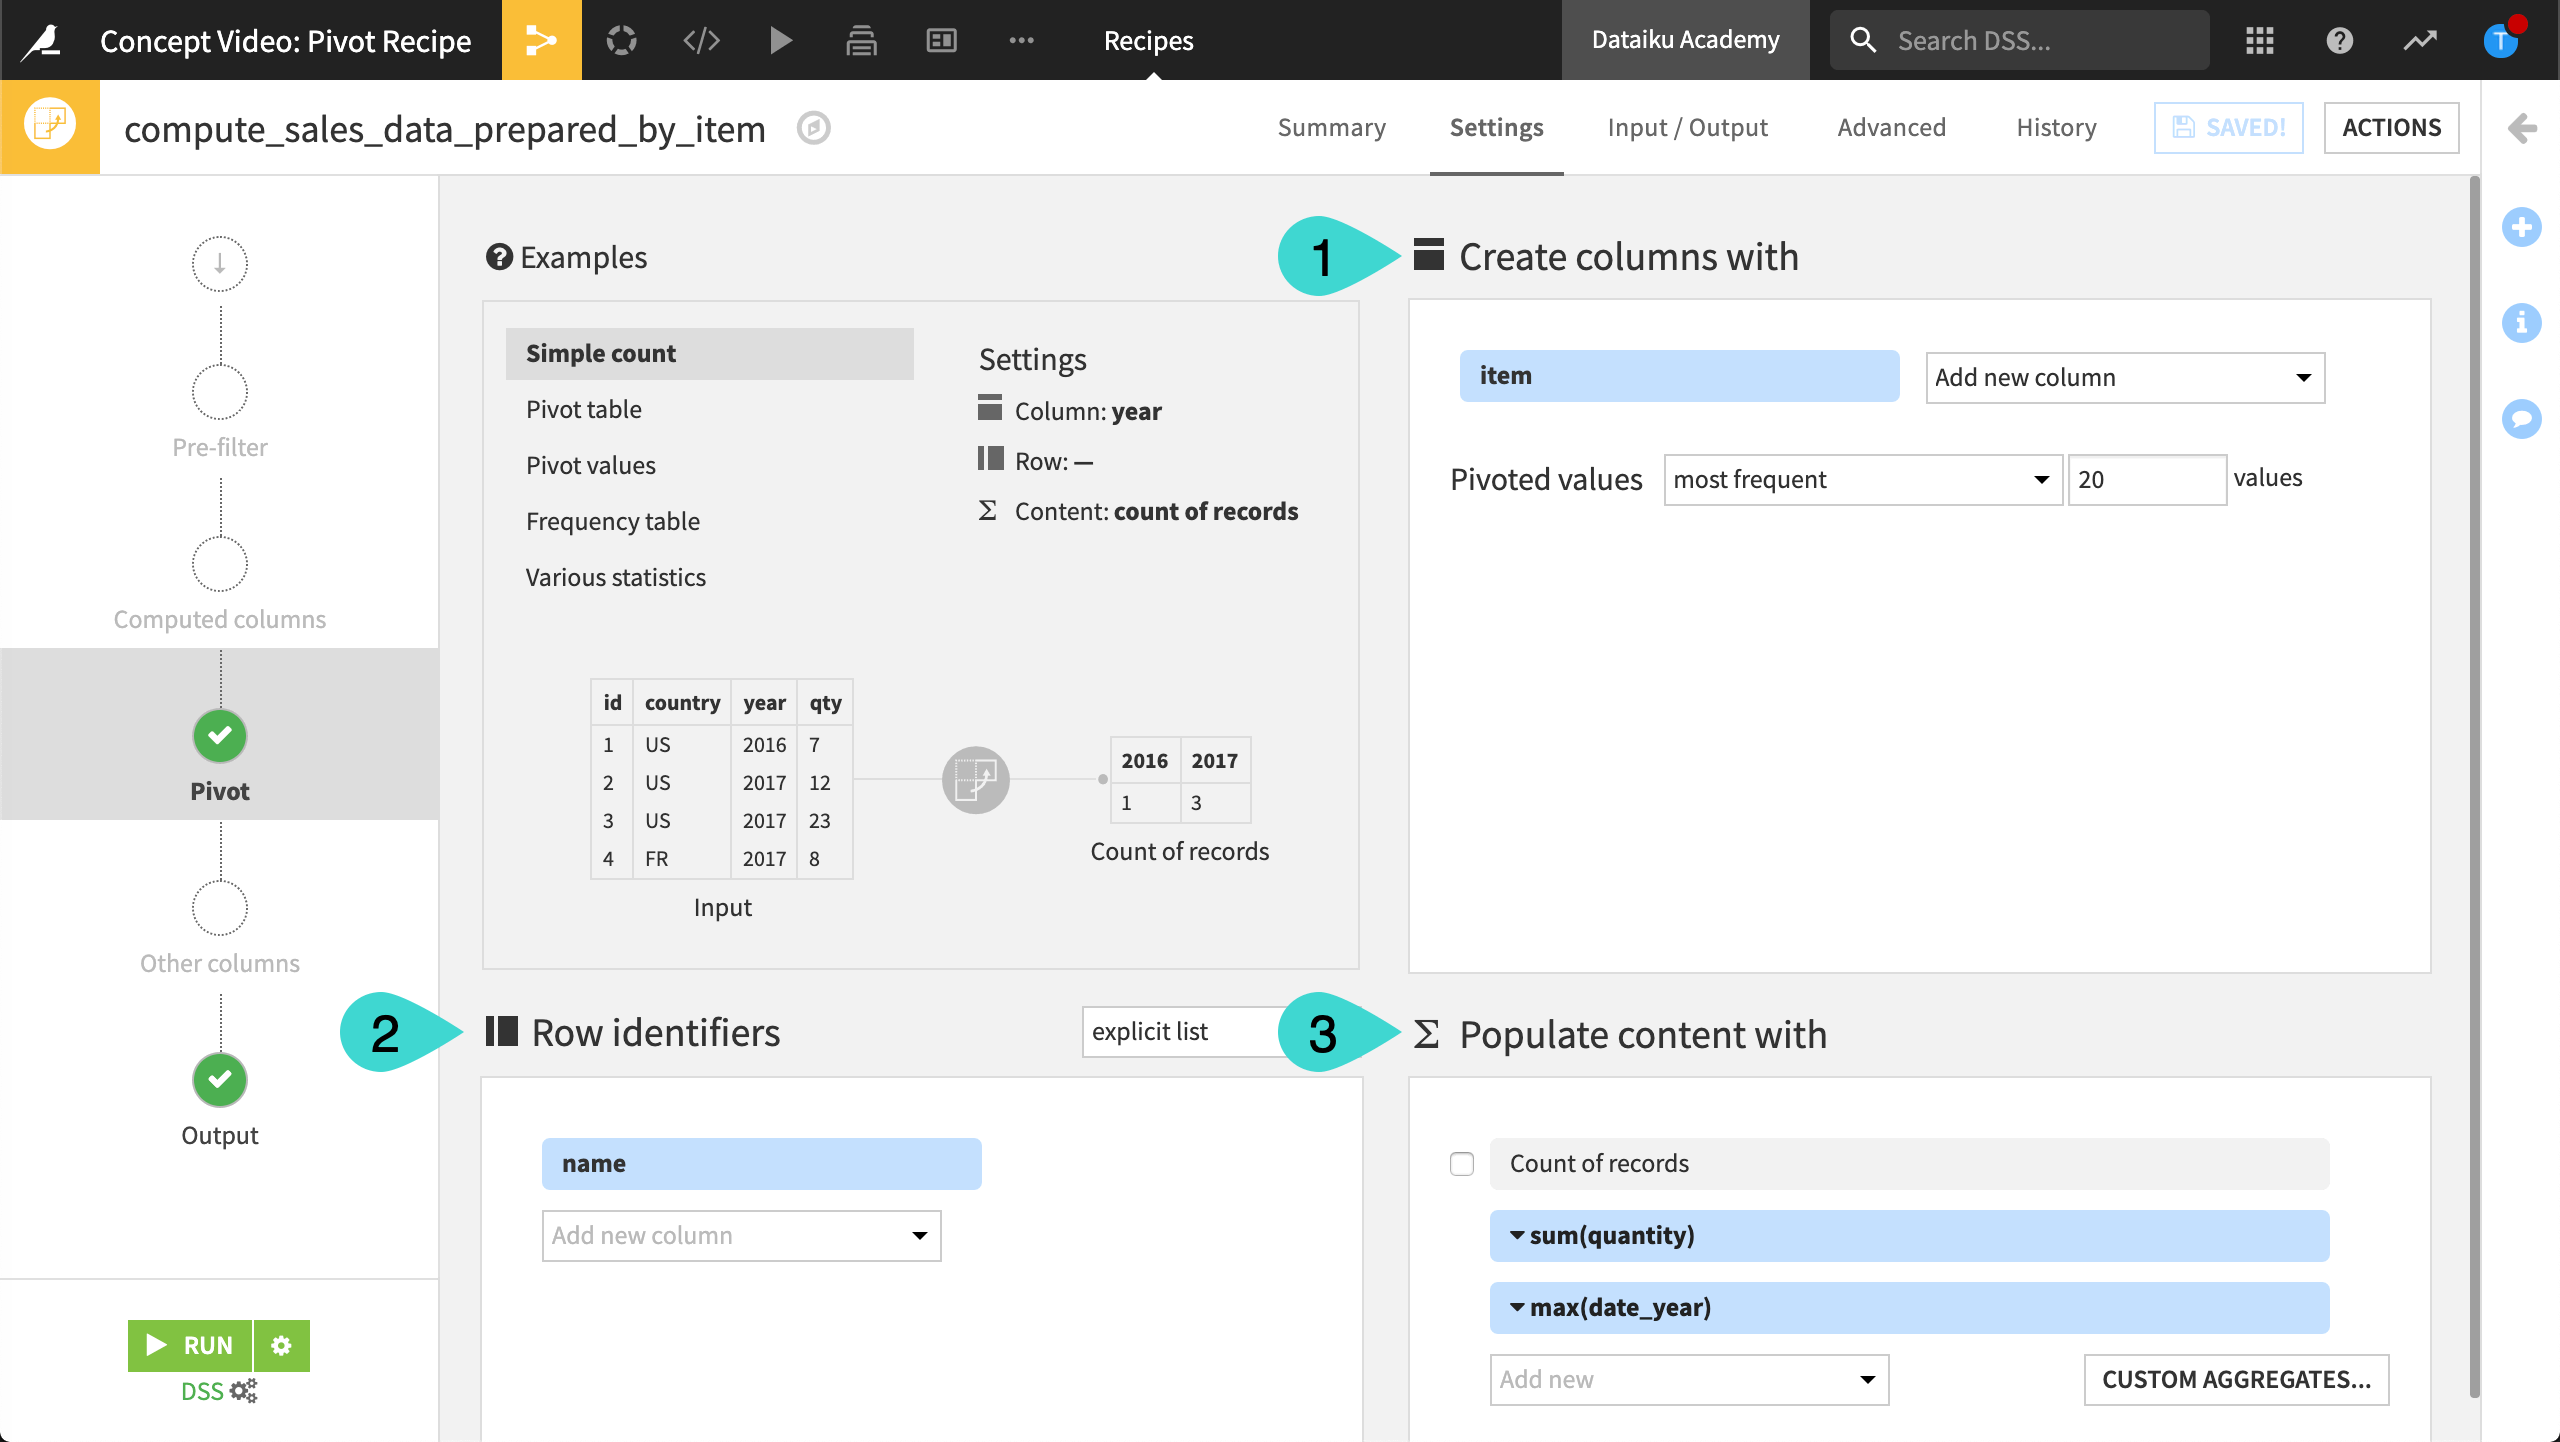
Pivot configuration#
To configure the Pivot recipe, you need to understand the following three fields found on the Pivot step. The example column refers to the long and wide tables shared above.
Pivot step field |
The values in this column(s) are … |
Example |
|---|---|---|
Create columns with (1) |
The new columns |
item |
Row identifiers (2) |
The group key |
name |
Populate content with (3) |
Used for aggregations |
sum(qty), max(year) |
Output interpretation#
Given this Pivot step configuration, and the example long format dataset as input, analyze the results in the output pivot table:
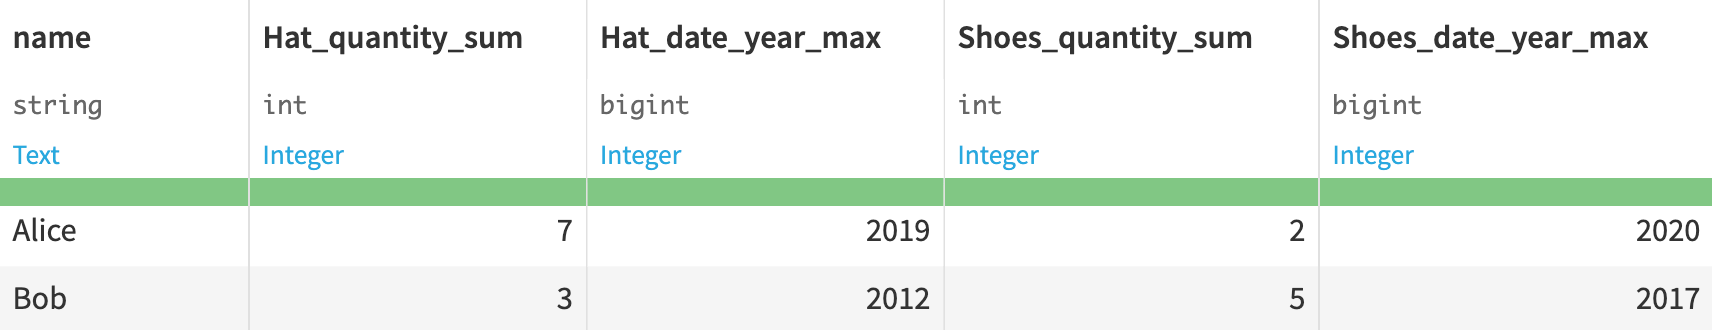
The first column is the group key column (the row identifier). Here, it’s name.
The rows of the dataset refer to the distinct values of the group key column (
Alice,Bob).The remaining columns are a combination of two factors:
They begin with the distinct values of the item column (
hat_*andshoes_*).They end with the requested aggregations (
*_qty_sum,*_year_max).
Next steps#
Continue learning about this recipe by working through the Tutorial | Pivot recipe article.
See also
If you’re looking for a pivot table visualization, instead of a dataset output, see Tutorial | Pivot tables.
See the reference documentation on the Pivot recipe for more implementation details.
Tip
You can find this content (and more) by registering for the Dataiku Academy course, Visual Recipes. When ready, challenge yourself to earn a certification!