
Understand the project#
See a screencast covering this section’s steps.
Before rushing into data preparation, take a moment to understand the goals for this quick start and the data at hand.
Objectives#
In this quick start, you’ll:
Interactively explore a dataset.
Clean data and create new features.
Import new data into a Dataiku project.
Join two datasets together.
Optional: Write code in a notebook and insert it into a visual Flow.
Tip
To check your work, you can review a completed version of this entire project from data preparation through MLOps on the Dataiku gallery.
Explore the data#
The project you’ve created includes a labeled dataset of real and fake job postings. Before actually preparing the data, explore it briefly.
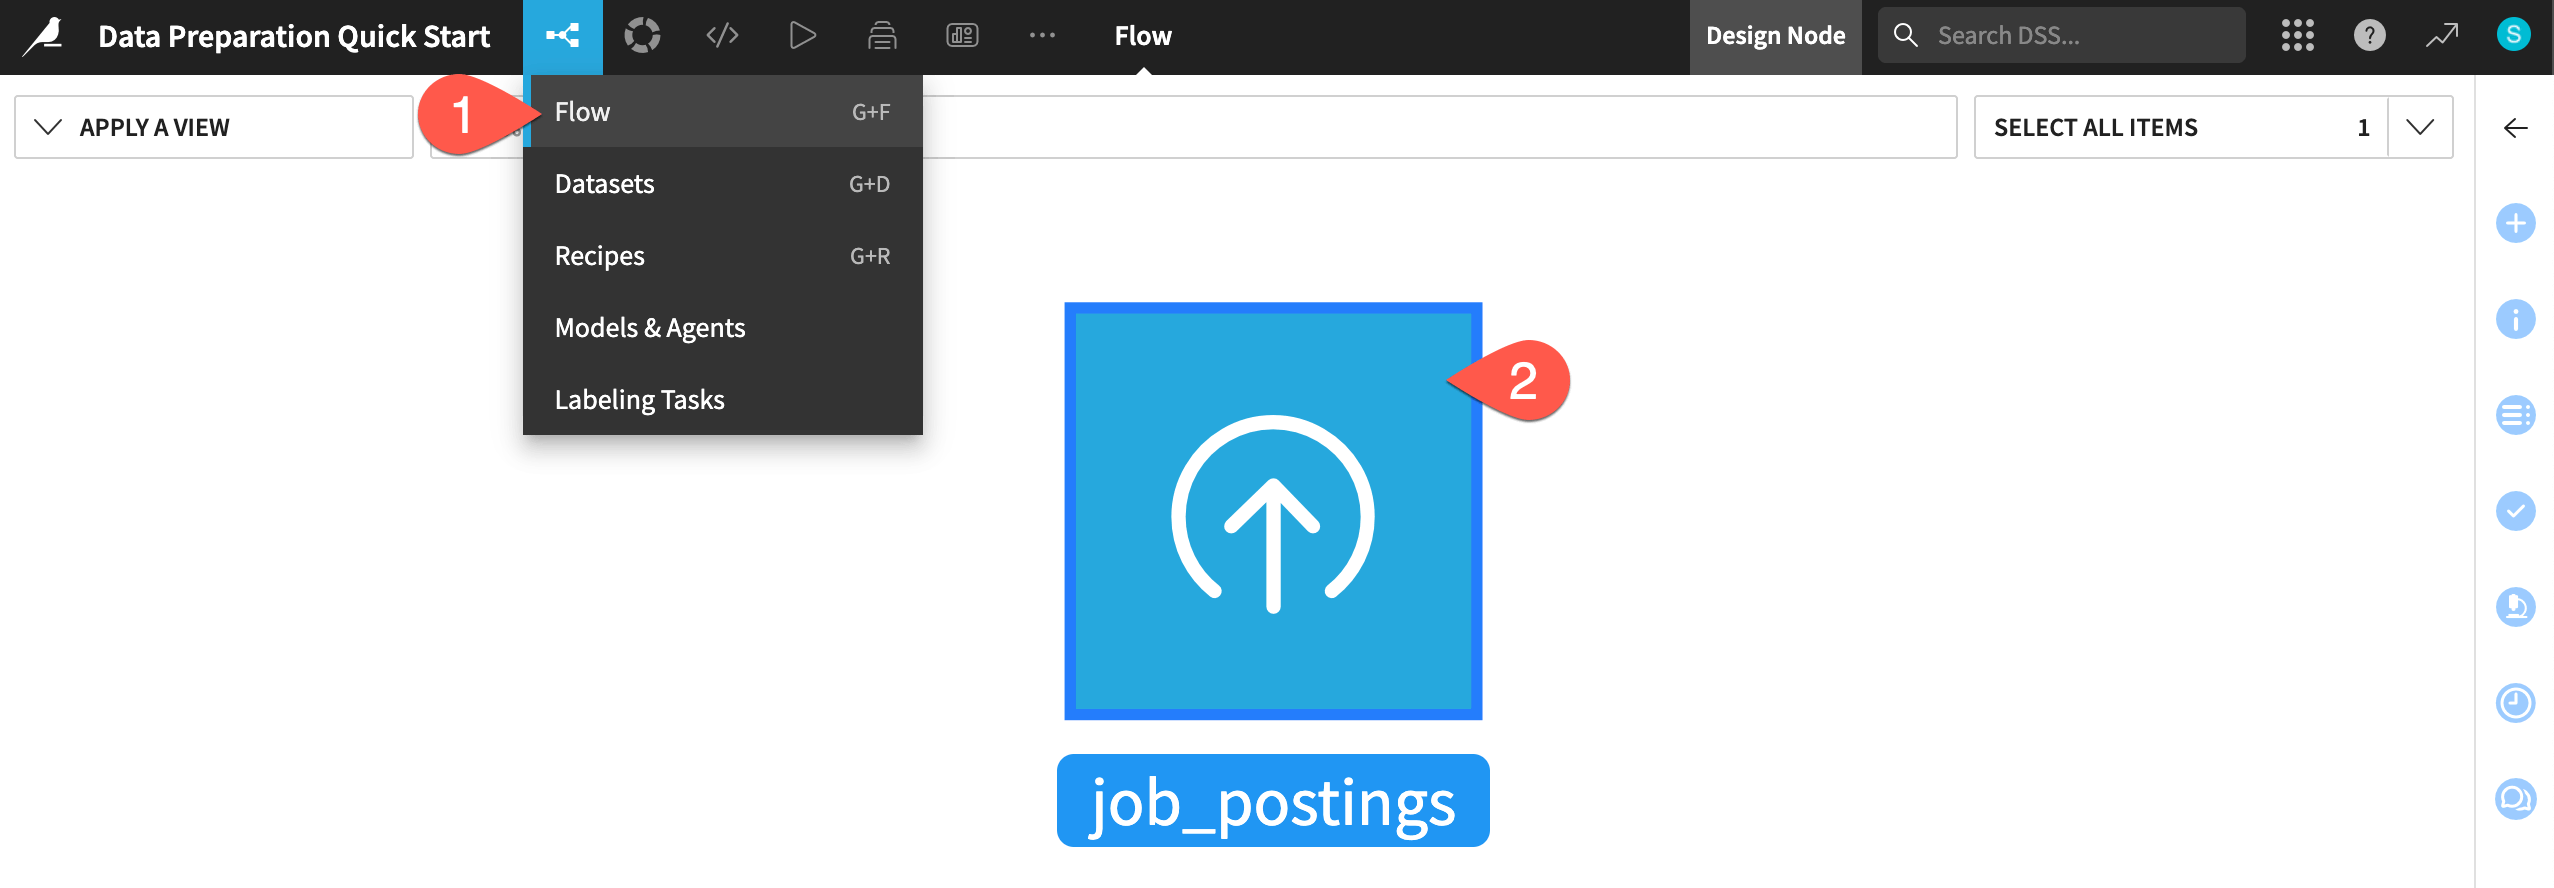
If not already there, from the (
 ) menu in the top navigation bar, select the Flow (or use the keyboard shortcut
 g+f).Double click on the job_postings dataset to open it.
Tip
There are many other keyboard shortcuts! Type ? to pull up a menu or see the Accessibility page in the reference documentation.
Compute the row count#
One of the first things to recognize when exploring a dataset in Dataiku is that you are viewing only a sample of the data. This enables you to work interactively even with large datasets.
From within the Explore tab of the job_postings dataset, click the Compute row count (
 ) icon to determine the row count of the entire dataset.
Click the Sample button to open the Sample settings panel.
Click the Sampling method dropdown to see options other than the default first records. No changes are required.
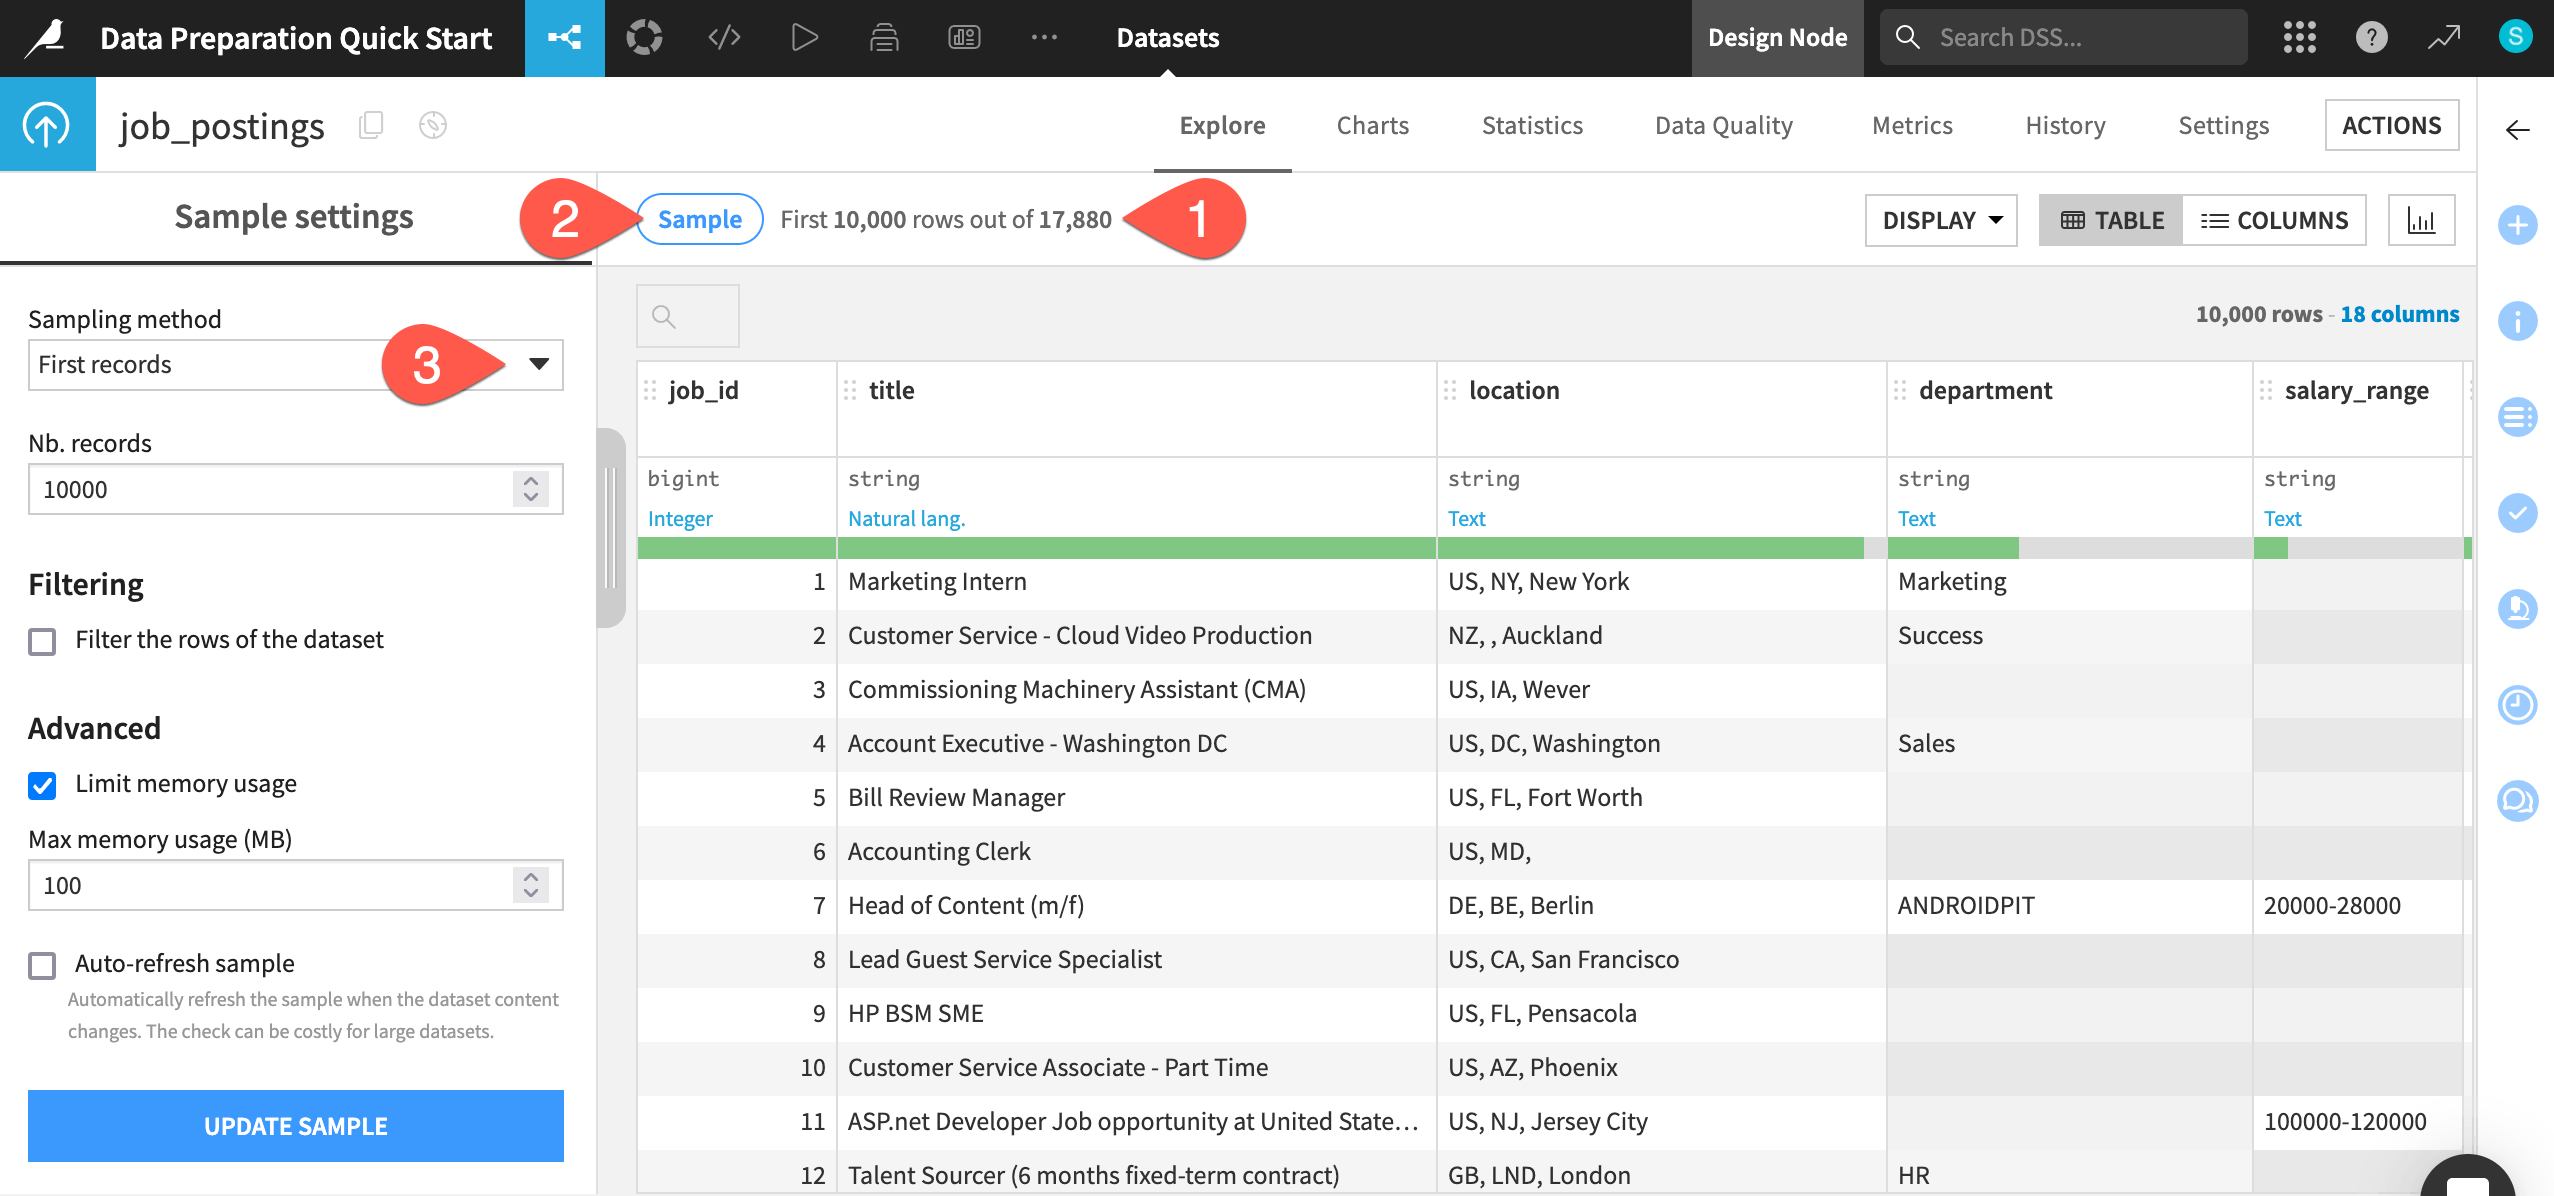
When ready, click the Sample button again to collapse the panel.
Analyze column distributions#
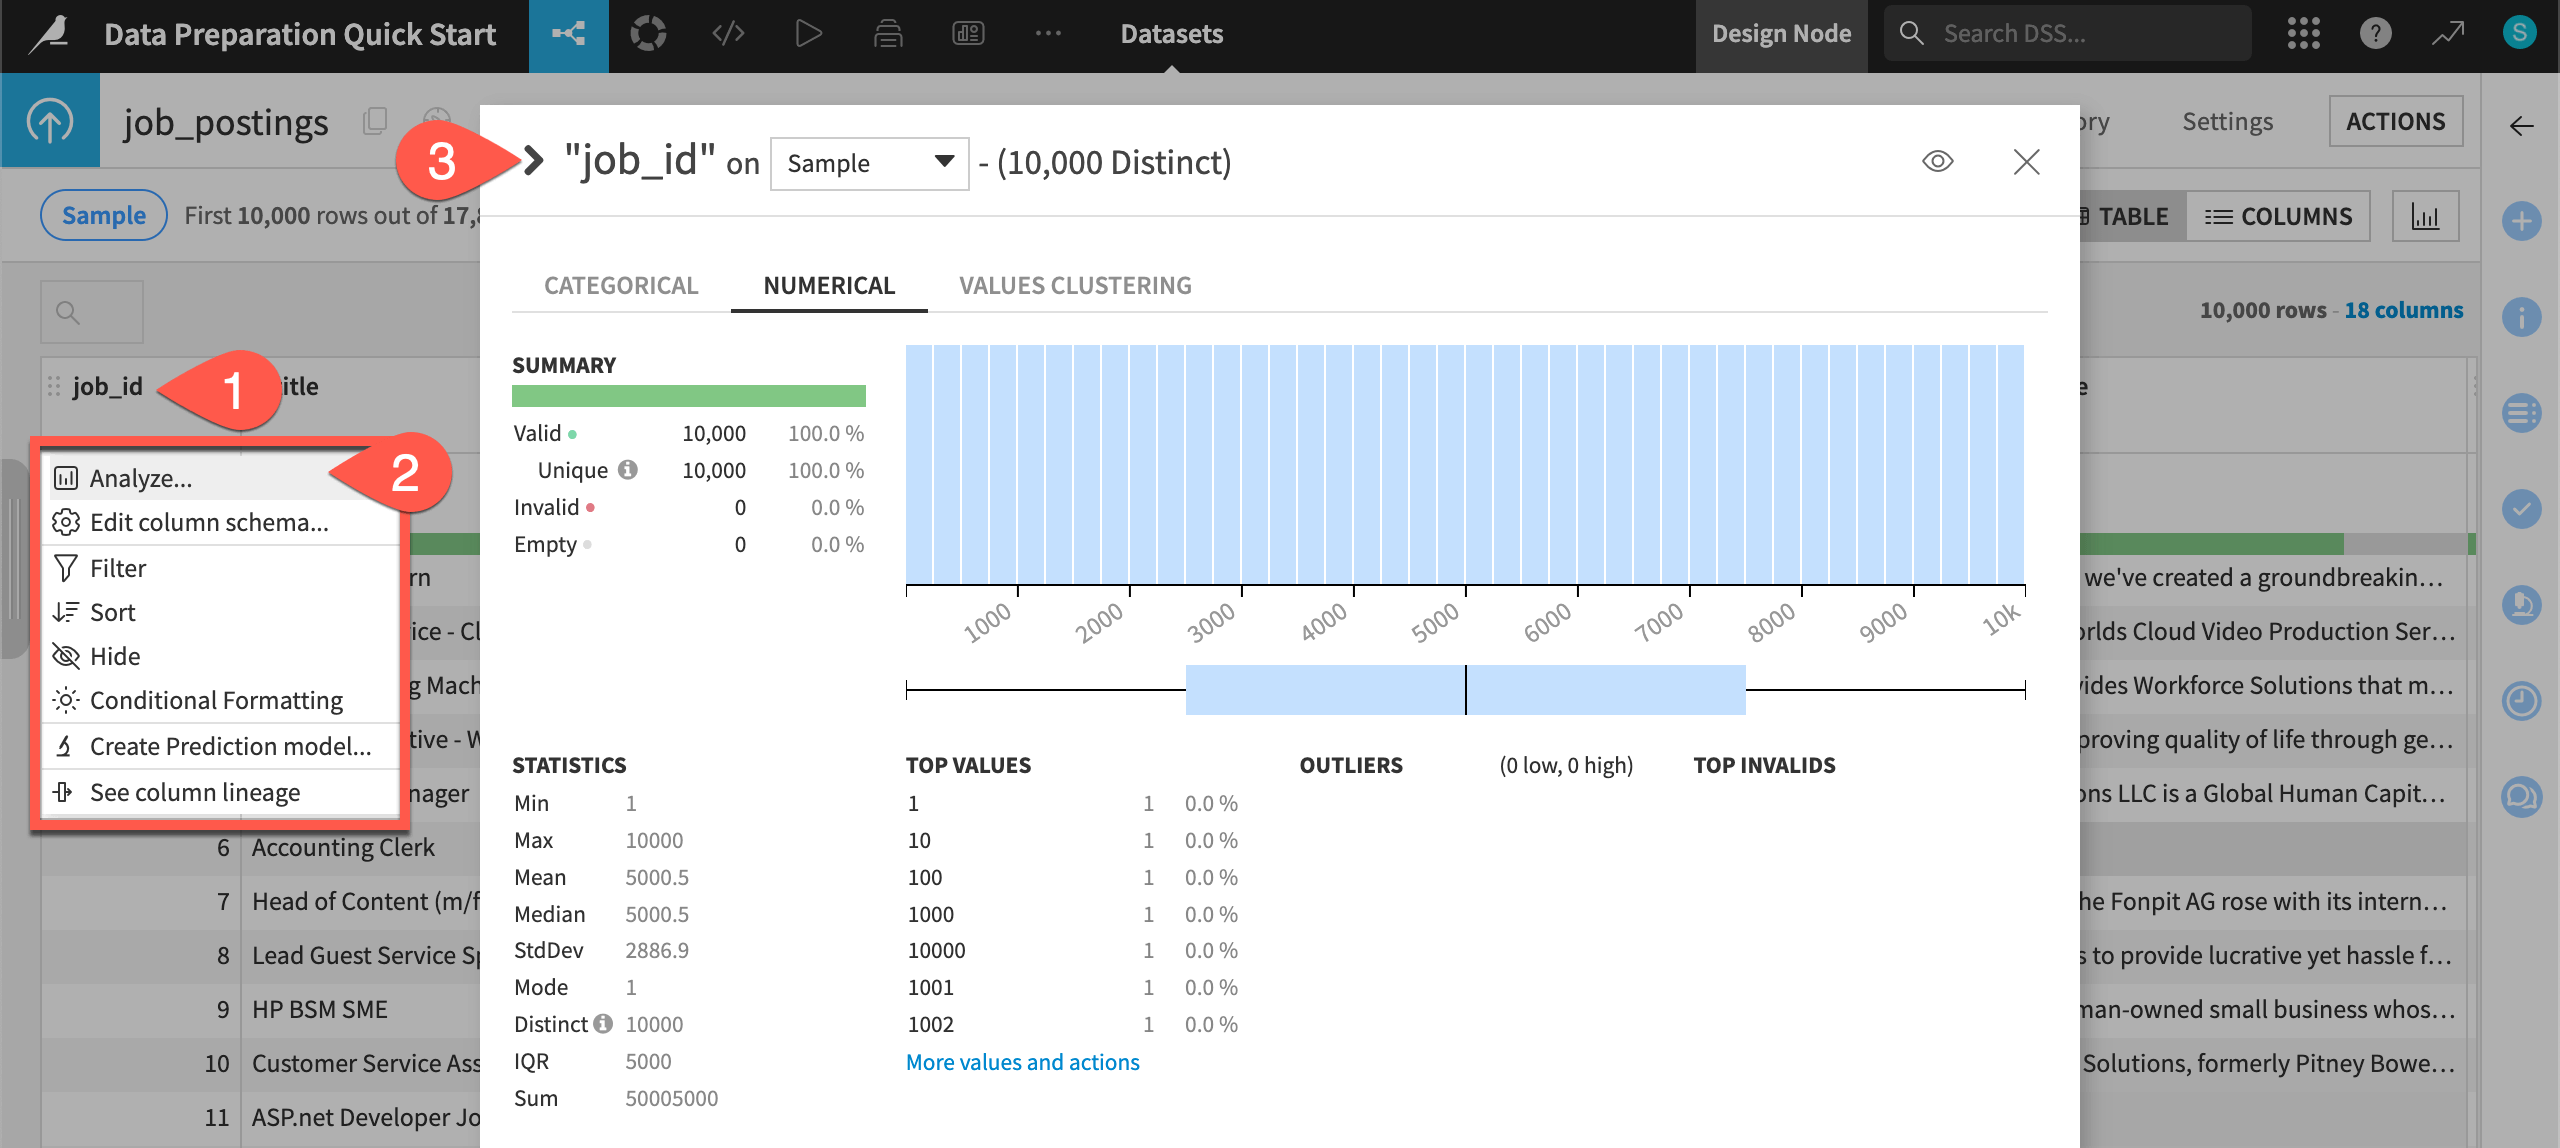
When exploring a dataset, you’ll also want an overview of the columns’ distributions and summary statistics.
Click on the header of the first column job_id to open a menu of options.
Select Analyze.
Use the arrow (
 ) to cycle through each column distribution until reaching the target variable fraudulent.
Tip
Applying the Analyze tool on the fraudulent column shows that about 5% of records in the sample are labeled as fake (a value of 1). The remaining 95% are real job postings (a value of 0).
You can adjust the dropdown from sample to Whole data, and click Save and Compute to see if this statistic differs for the whole dataset.