
Tutorial | Managed folders#
Get started#
Although Dataiku supports many data formats, datasets alone aren’t always sufficient for every data science project. Managed folders, often in conjunction with code recipes, can be a handy tool for programmatically working with non-supported file types (like images, PDFs, and more) and supported file types, too.
In this tutorial, you will work with data tables printed in a UN report on urban population growth that you want to extract into Dataiku.
Objectives#
In this tutorial, you will learn how to:
Parse and extract data from a PDF in a folder using Python.
Create a Dataiku dataset from a folder of files.
Work with a folder as both input and output to a Python recipe.
Publish the contents of a managed folder on a dashboard.
Prerequisites#
To complete this tutorial, you will need:
Dataiku 12.0 or later.
An Advanced Analytics Designer or Full Designer user profile.
A 3.8 Python environment with the packages:
matplotlib
tabula-py
matplotlib
tabula-py
jpype1
Create the project#
From the Dataiku Design homepage, click + New Project.
Select Learning projects.
Search for and select Managed Folders.
If needed, change the folder into which the project will be installed, and click Install.
From the project homepage, click Go to Flow (or type
g+f).
From the Dataiku Design homepage, click + New Project.
Select DSS tutorials.
Filter by Developer.
Select Managed Folders.
From the project homepage, click Go to Flow (or type
g+f).
Note
You can also download the starter project from this website and import it as a zip file.
Explore the folder#
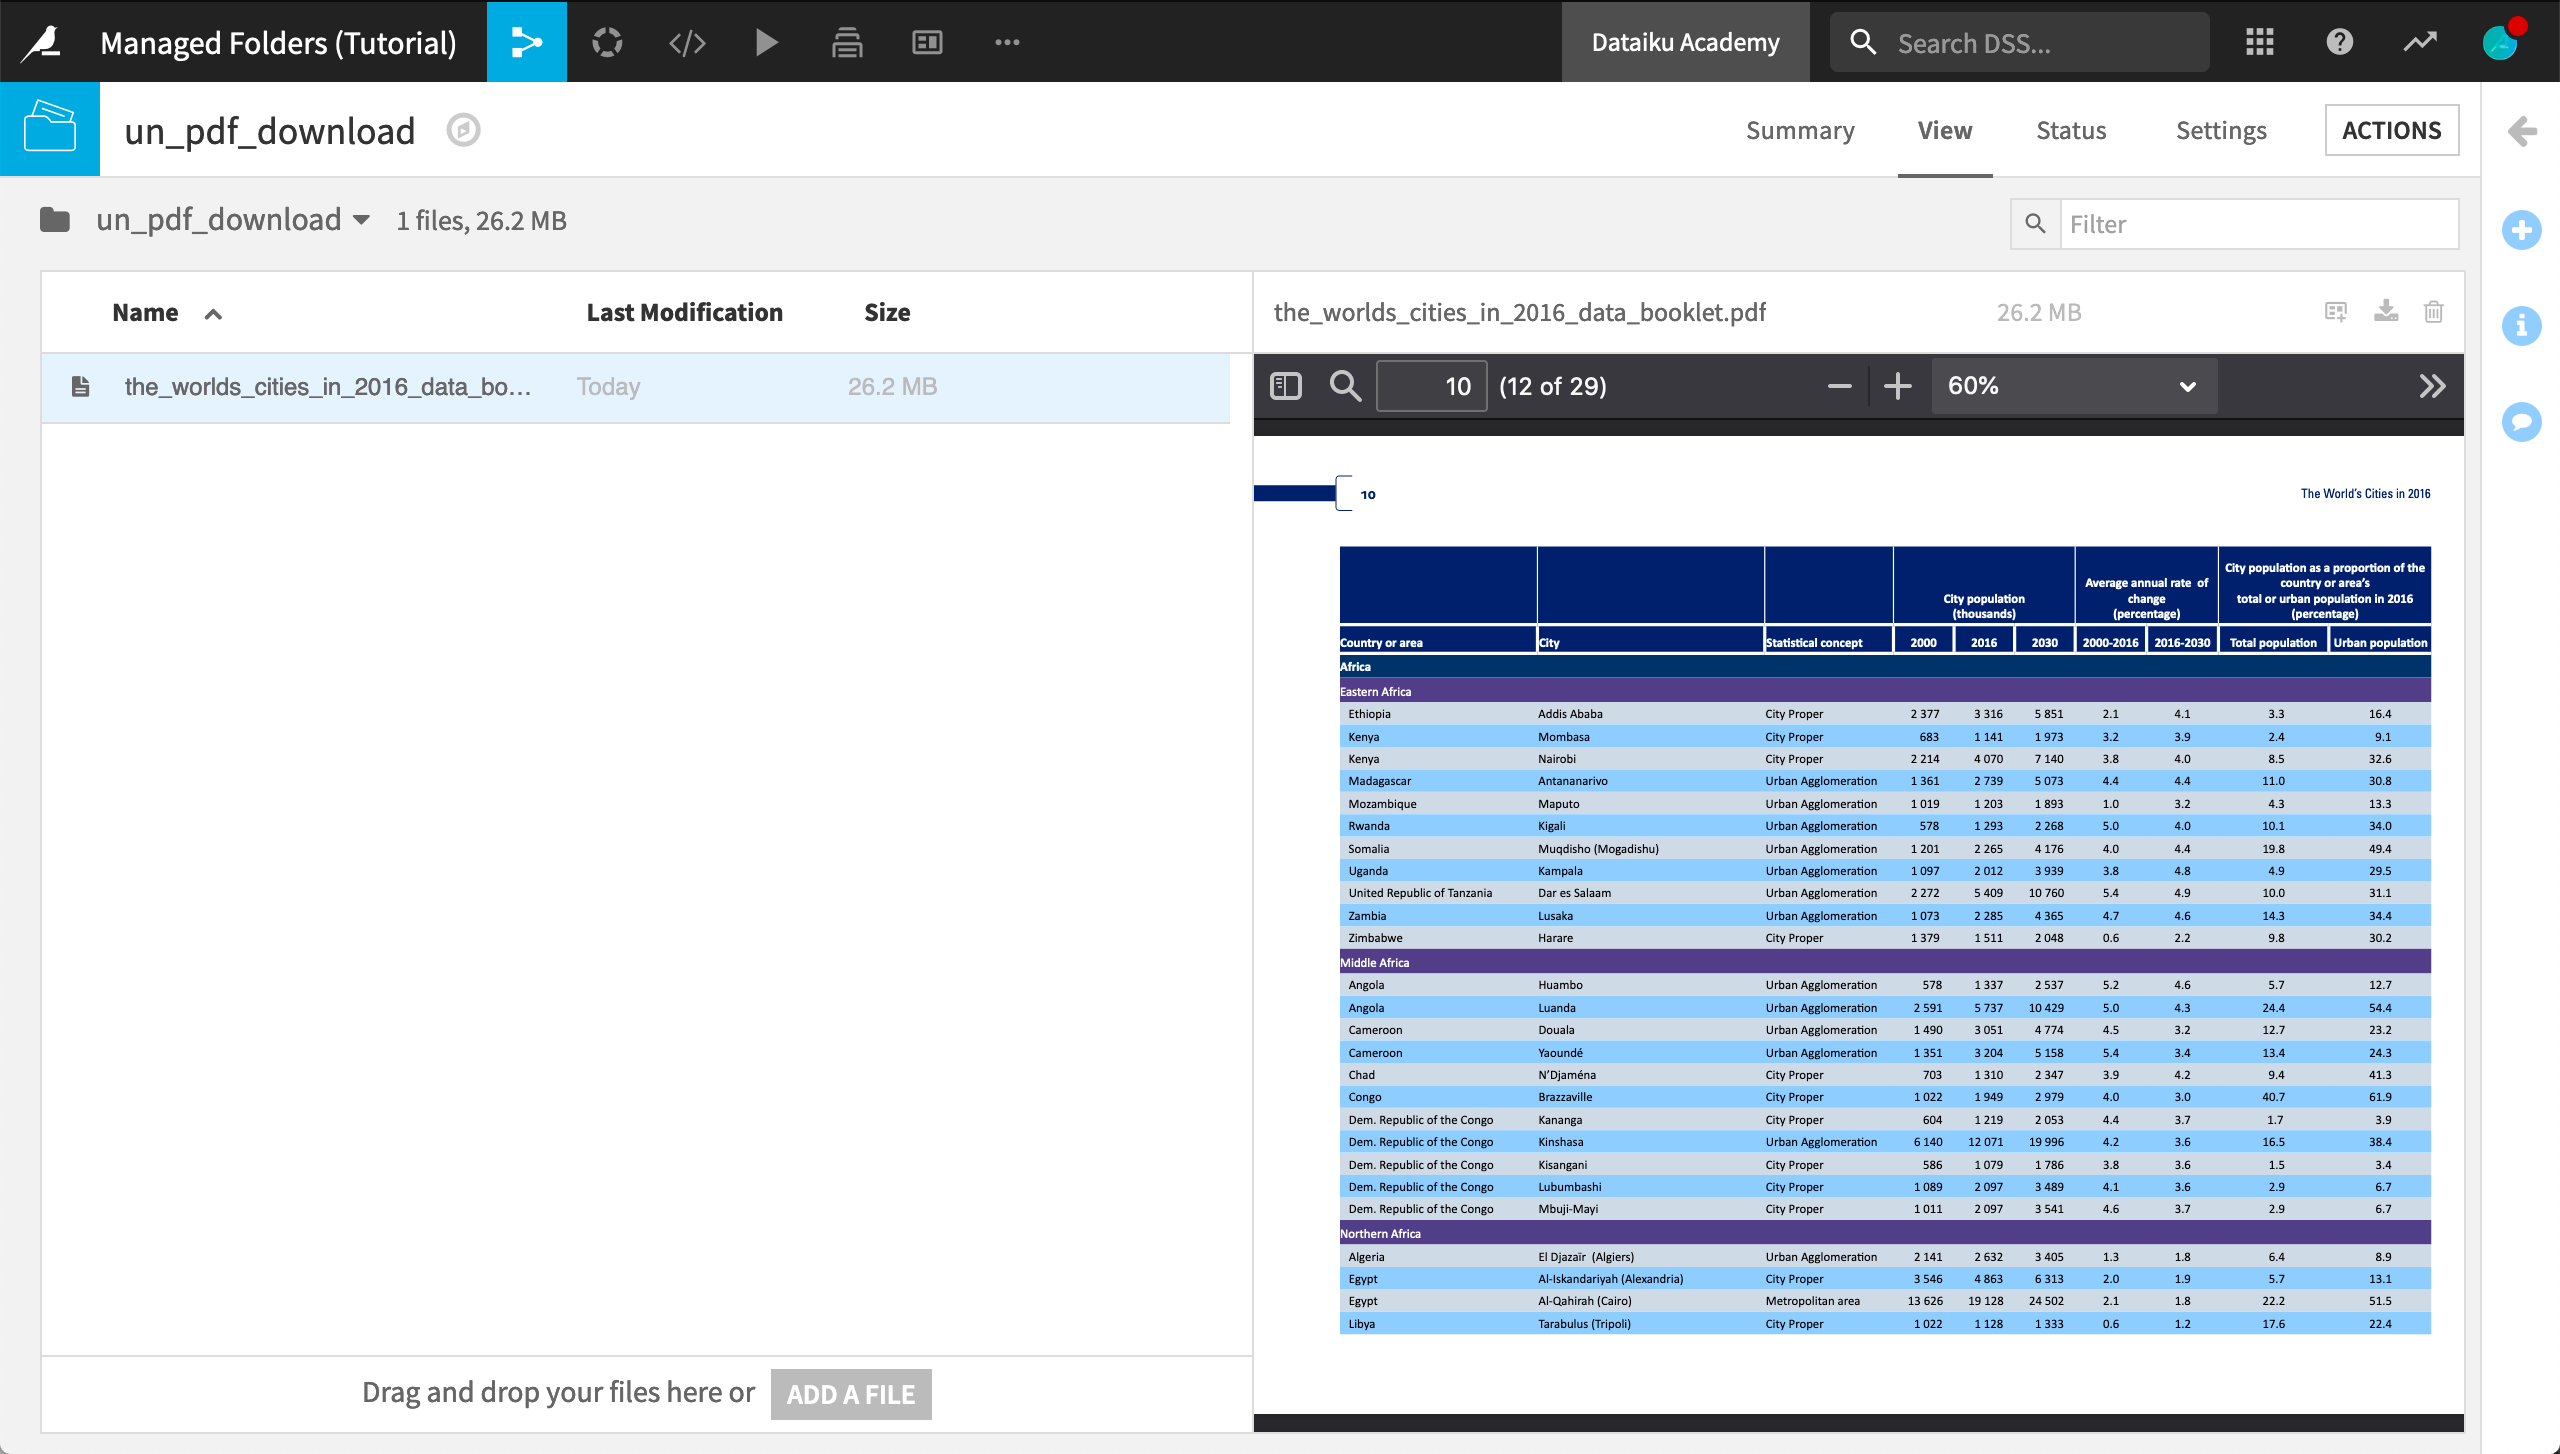
The data for this project is a PDF named UN’s 2016 report on World Cities. You can explore it in the managed folder.
From the Flow, open the folder un_pdf_download.
Open the PDF file in the folder.
Scroll through the PDF to find the published data tables starting from page 12.
Parse the PDF with a code recipe#
Dataiku doesn’t have its own way of extracting data tables from a PDF, but the tabula Python library does. A small amount of Python code can get these tables into a Dataiku dataset.
Change the code environment#
Let’s first designate this project’s code environment, one that has the packages tabula-py and matplotlib (which will you’ll need later).
From the More Options (
 ) menu in the top navigation bar, select Settings > Code env selection.
Change the Mode to Select an environment.
Change the Environment to a compatible code env. See How-to | Create a code environment for help.
Click Save.
Create a Python recipe#
Now we can return to the Flow.
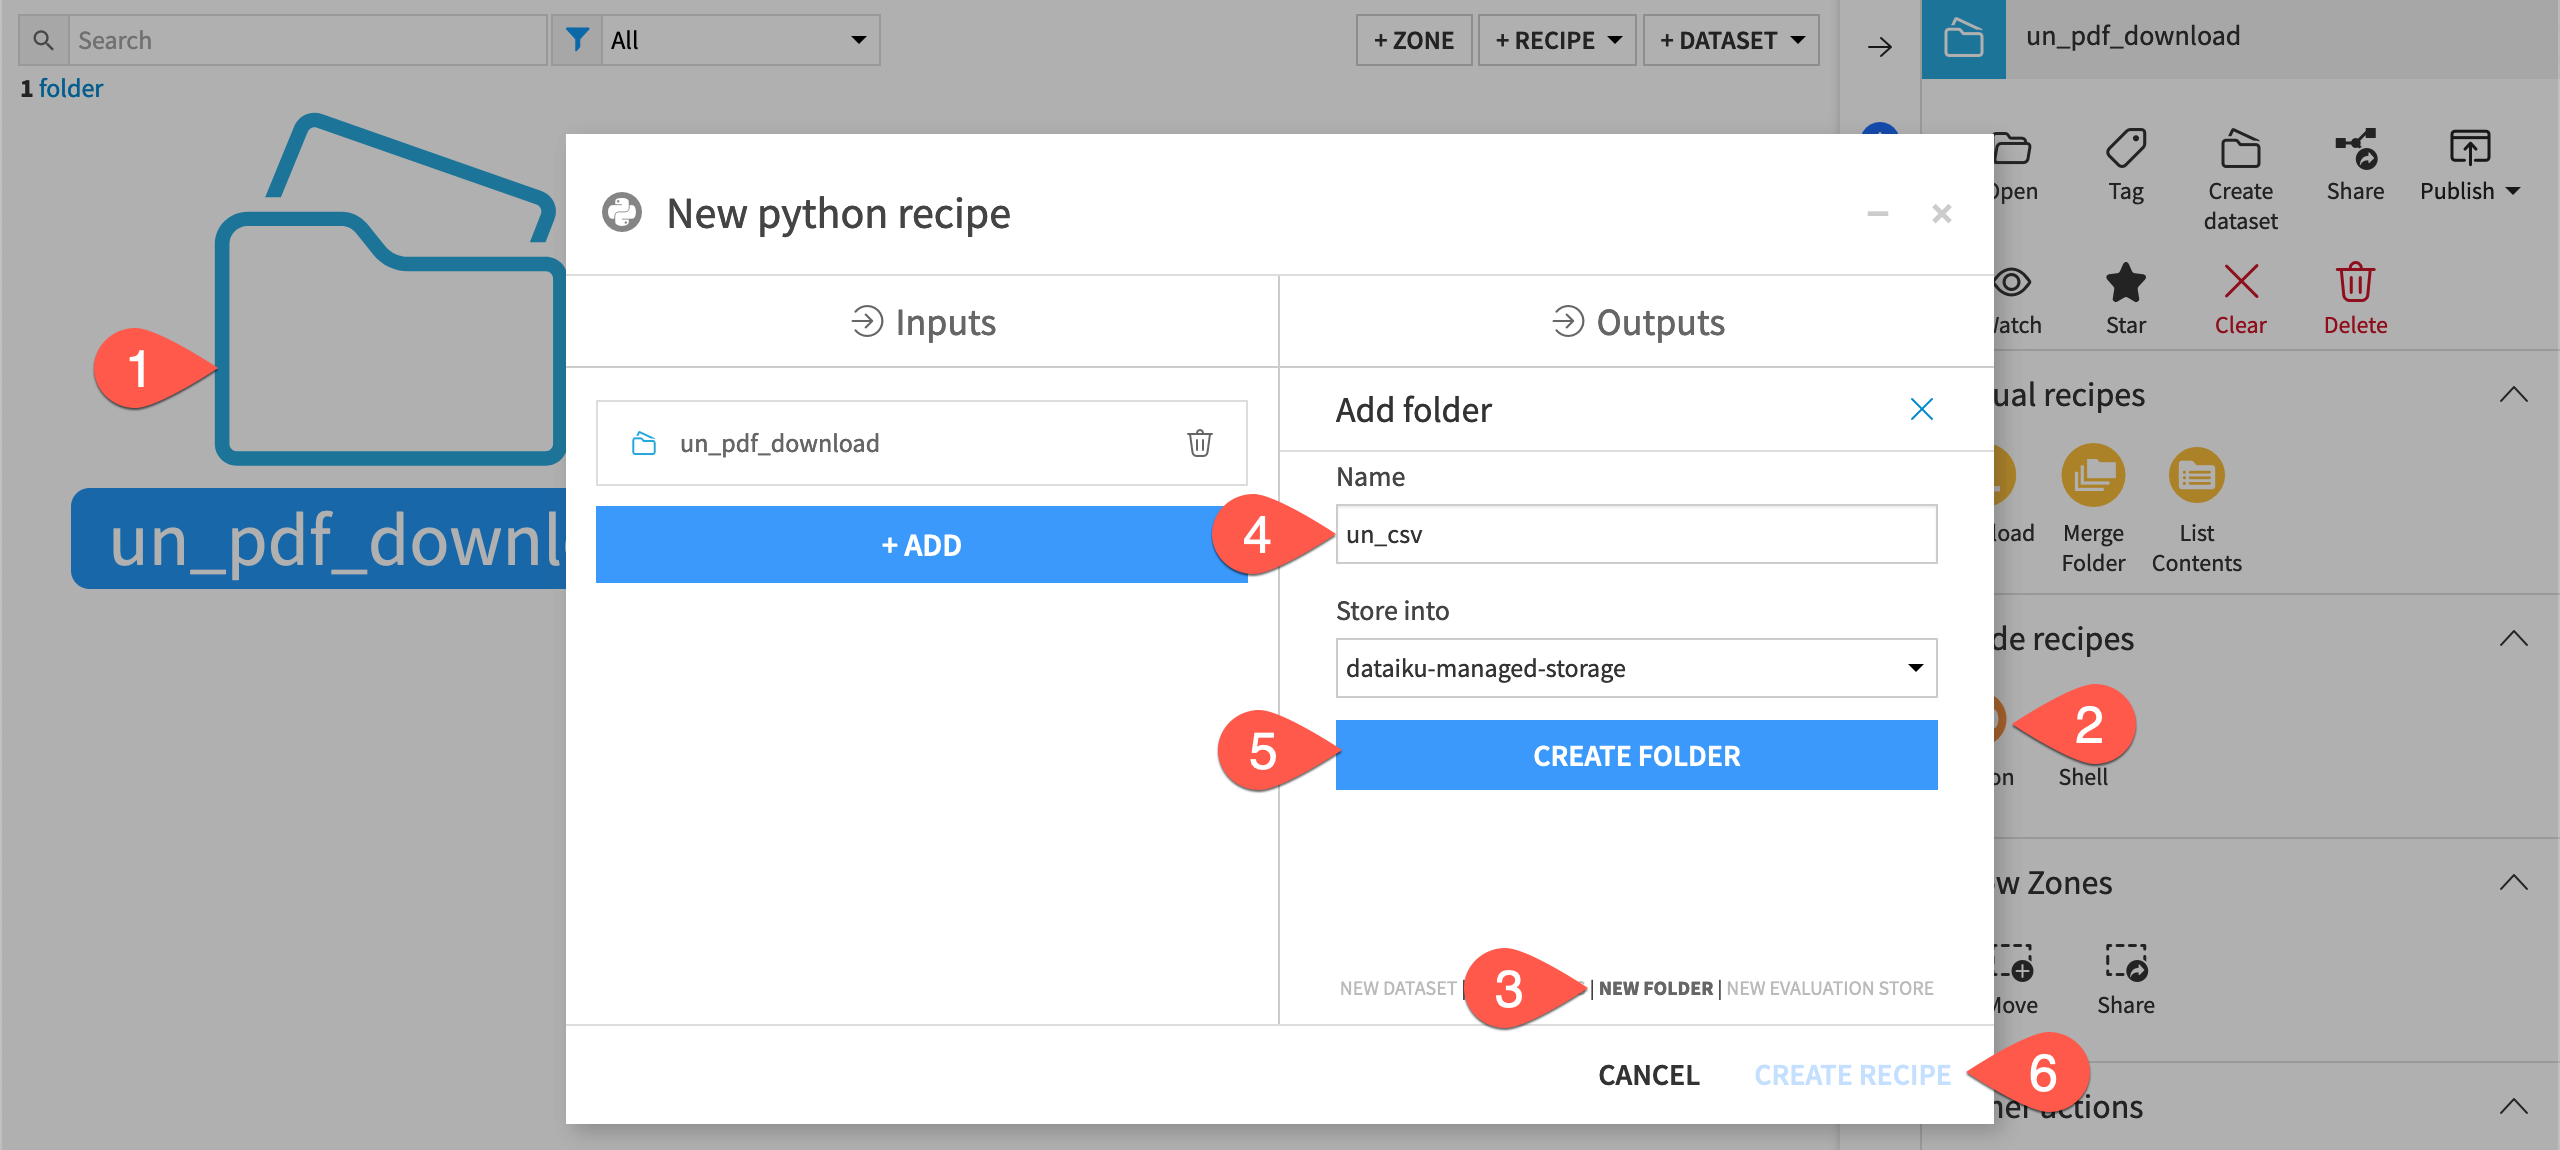
Select the un_pdf_download folder.
From the Actions (
 ) tab, add a Python recipe.
Under Outputs, click + Add, but instead of adding a new dataset, add a New Folder.
Name the folder
un_csv.Click Create Folder.
Click Create Recipe.
Normally you would prototype a recipe in a notebook, but in this case, the tutorial provides working code. The full code is below, but take a moment to understand these key points.
The Dataiku API streams the PDF from the folder.
For Dataiku Cloud users,
tempfileallows for using the file normally with various libraries.The tabula-py library does the actual PDF parsing.
The last step is to write the output to another folder.
Delete the code sample.
Copy and paste the code below into the recipe editor.
# -*- coding: utf-8 -*-
import dataiku
import pandas as pd
from tabula.io import read_pdf
import tempfile

# Read recipe inputs
un_pdf_download = dataiku.Folder("un_pdf_download")

# read in the pdf and use tabula-py to extract tabular data
with un_pdf_download.get_download_stream("the_worlds_cities_in_2016_data_booklet.pdf") as f:
        with tempfile.NamedTemporaryFile(suffix=".pdf") as temp_pdf:
                temp_pdf.write(f.read())
                temp_pdf.seek(0)
                tables = read_pdf(temp_pdf.name, pages = "12-26", multiple_tables = True)

# parse the pdf tables
for table in tables:
        table.columns = table.iloc[0].values
        table.dropna(inplace=True)
        table.drop(table.index[0], inplace=True)

# remove corrupted data
tables.pop(2)

# Write recipe outputs
csvs = dataiku.Folder("un_csv")

# write dataframes to csvs
path = '/dataset_{}'
for index, table in enumerate(tables):
        csvs.upload_stream(path.format(index), table.to_csv().encode("utf-8"))
# -*- coding: utf-8 -*-
import dataiku
import pandas as pd
from tabula.io import read_pdf
import io

# Read recipe inputs
un_pdf_download = dataiku.Folder("un_pdf_download")

# read in the pdf and use tabula-py to extract tabular data
with un_pdf_download.get_download_stream("the_worlds_cities_in_2016_data_booklet.pdf") as stream:
        tables = read_pdf(io.BytesIO(stream.read()), pages = "12-26", multiple_tables = True)

# parse the pdf tables
for table in tables:
        table.columns = table.iloc[0].values
        table.dropna(inplace=True)
        table.drop(table.index[0], inplace=True)

# remove corrupted data
tables.pop(2)

# Write recipe outputs
csvs = dataiku.Folder("un_csv")

# write dataframes to csvs
path = '/dataset_{}'

for index, table in enumerate(tables):
        csvs.upload_stream(path.format(index), table.to_csv().encode("utf-8"))
Tip
If you get an error extracting the tables from the un_csv folder, you can also download the un_world_cities dataset, and continue from Output custom plots to a folder section below.
Run the recipe.
View the output folder.
Warning
If you gave the managed folders different names than those described here, be sure to update them.
Note
Whenever possible, it’s advisable to use the get_download_stream() method to read a file from a folder, rather than get_path(). While get_path() will only work for a local folder, get_download_stream() works regardless of where the contents are stored. See the reference documentation to learn more.
Create a Files in Folder dataset#
The un_csv folder now holds 14 files, one for each page of the PDF containing a table. From this folder of CSV files, let’s create one Dataiku dataset.
With the un_csv folder selected, click Create dataset in the Actions tab.
Click List Files to confirm the files in the folder (dataset_0 to dataset_13).
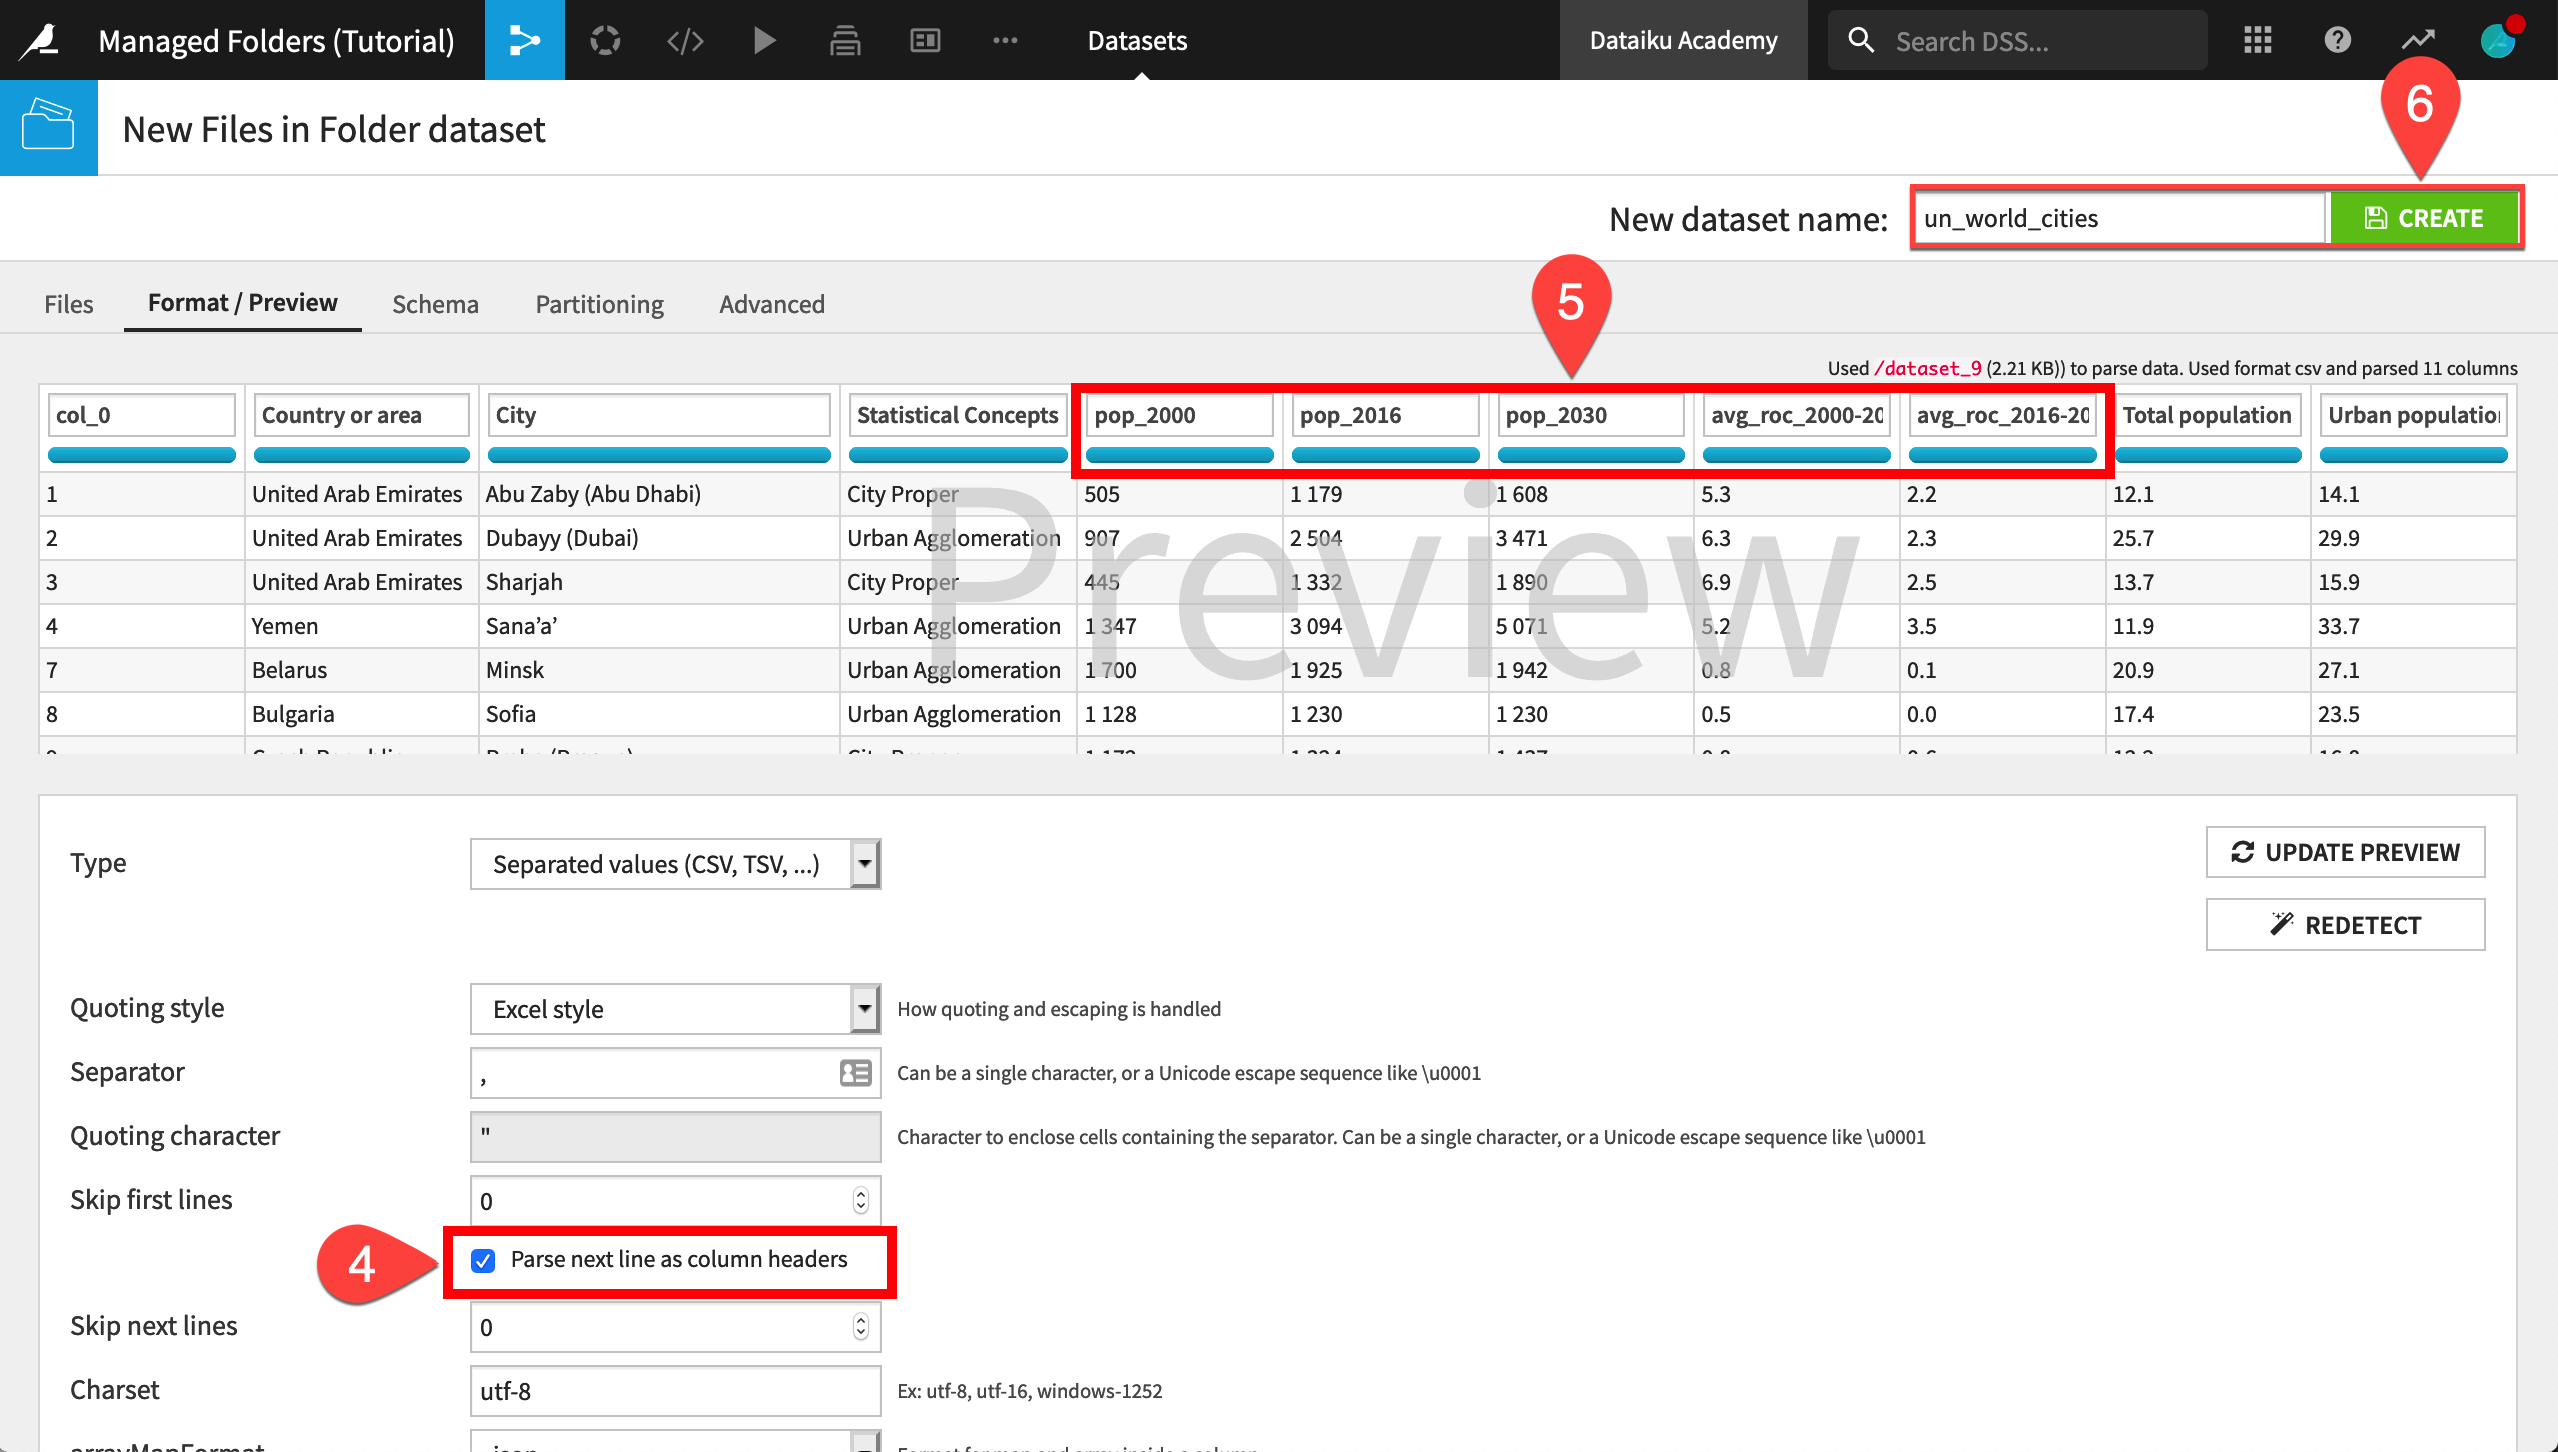
Click Test & Get Schema, and then click Preview.
On the Format/Preview tab, check the box Parse next line as column headers.
Fix some of the column names:
Add the prefix
pop_to the three population columns 2000, 2016, and 2030.Add the prefix
avg_roc_to the columns 2000-2016 and 2016-2030 for the average annual rate of change in population.
Name the output
un_world_cities, and click Create.
You now have a Dataiku dataset that you can manipulate further with visual and/or code recipes.
Visual data preparation#
Although the previous Python recipe could have handled this, let’s take advantage of the Prepare recipe for some quick data cleaning.
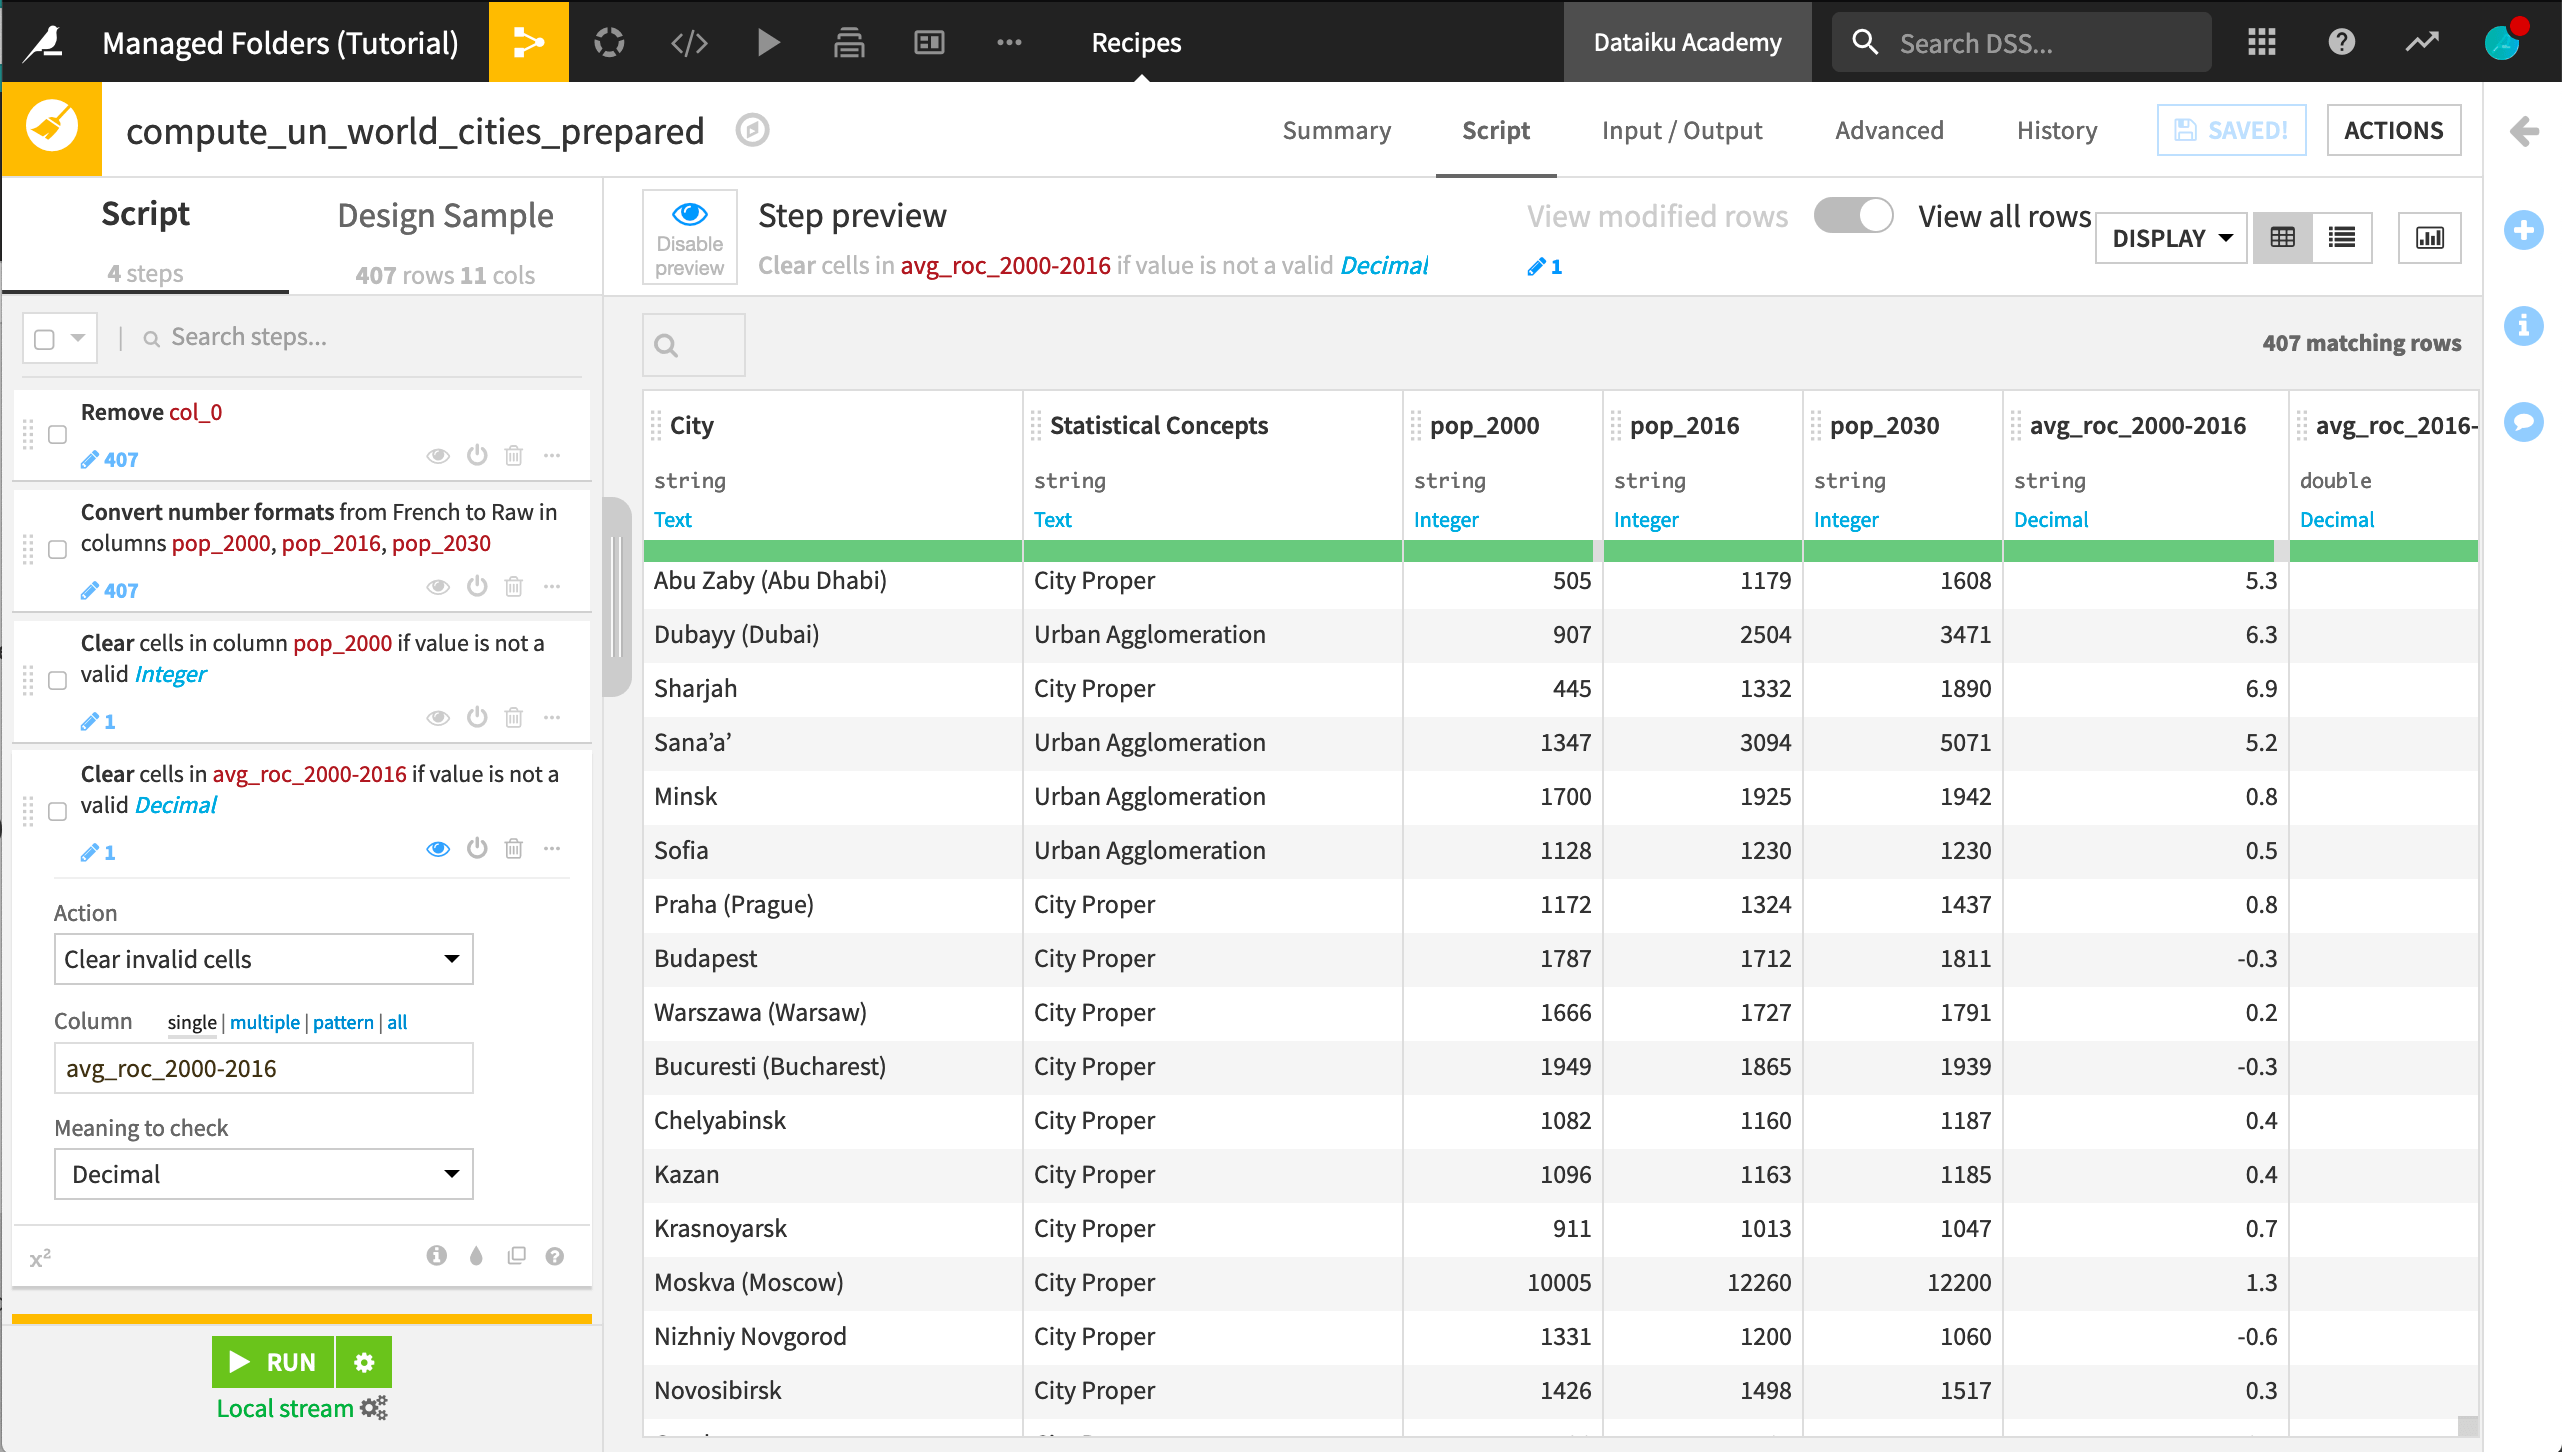
From the un_world_cities dataset, create a Prepare recipe with the default output name.
Remove the unnecessary col_0.
Add another step to convert number formats in the three population columns.
The name of the step is Convert number formats. The input format should be French, and the output format should be Raw.
As flagged by the red portion of the data quality bar, there is one city with non-standard representations of missing data.
For columns pop_2000 and avg_roc_2000-2016, clear invalid cells for the meanings integer and decimal, respectively.
Run the recipe, updating the schema if necessary.
Output custom plots to a folder#
There may be times when the native chart builder can’t create the visualization needed. Instead, you might want to create a more customized plot in a library like matplotlib or ggplot2. You can use a code notebook to create a custom plot. Then, you can save it as a static insight and publish it to a dashboard.
However, for situations where you want to generate many files as output (such as one chart per country), it may be preferable to use a managed folder as output.
For the ten largest countries, let’s create pyramid plots in matplotlib to compare growth rates from 2000-2016 and the projected growth rate from 2016 to 2030.
From the un_world_cities_prepared dataset, create a Python recipe.
Add a New Folder (not a dataset) as an output named
population_growth_comparisons.Create the recipe.
The full code recipe is below, but take note of the following key points.
It uses the Dataiku API to interact with the input dataset as a Pandas dataframe.
It uses matplotlib to create the charts.
For each plot, it uses the
upload_stream()method to write the image to the output folder because it works for both local and non-local folders.
Delete the code sample.
Copy and paste this code into your recipe editor.
import dataiku
import pandas as pd
import matplotlib.pyplot as plt
import os
import io

# Read recipe inputs
un_data_prepared = dataiku.Dataset("un_world_cities_prepared")
df = un_data_prepared.get_dataframe()

# top 10 most populous countries
TOP_10 = ['India', 'China', 'Brazil', 'Japan', 'Pakistan', 'Mexico', 'Nigeria',
        'United States of America', 'Indonesia', 'Turkey']

# generate plot for each country and save to folder
for country in TOP_10:

        df_filtered = df[df['Country or area'] == country]

        y = range(0, len(df_filtered))
        x_1 = df_filtered["avg_roc_2000-2016"]
        x_2 = df_filtered["avg_roc_2016-2030"]

        fig, axes = plt.subplots(ncols=2, sharey=True, figsize=(12, 9))

        fig.patch.set_facecolor('xkcd:light grey')
        plt.figtext(.5,.9, "Pop. ROC Comparison ", fontsize=15, ha='center')

        axes[0].barh(y, x_1, align='center', color='royalblue')
        axes[0].set(title='2000-2016')
        axes[1].barh(y, x_2, align='center', color='red')
        axes[1].set(title='2016-2030')

        axes[1].grid()
        axes[0].set(yticks=y, yticklabels=df_filtered['City'])
        axes[0].invert_xaxis()
        axes[0].grid()

        # Write recipe outputs
        pyramid_plot = dataiku.Folder("population_growth_comparisons")

        bs = io.BytesIO()
        plt.savefig(bs, format="png")
        pyramid_plot.upload_stream(country + "_fig.png", bs.getvalue())
Run the recipe.
View the output folder.
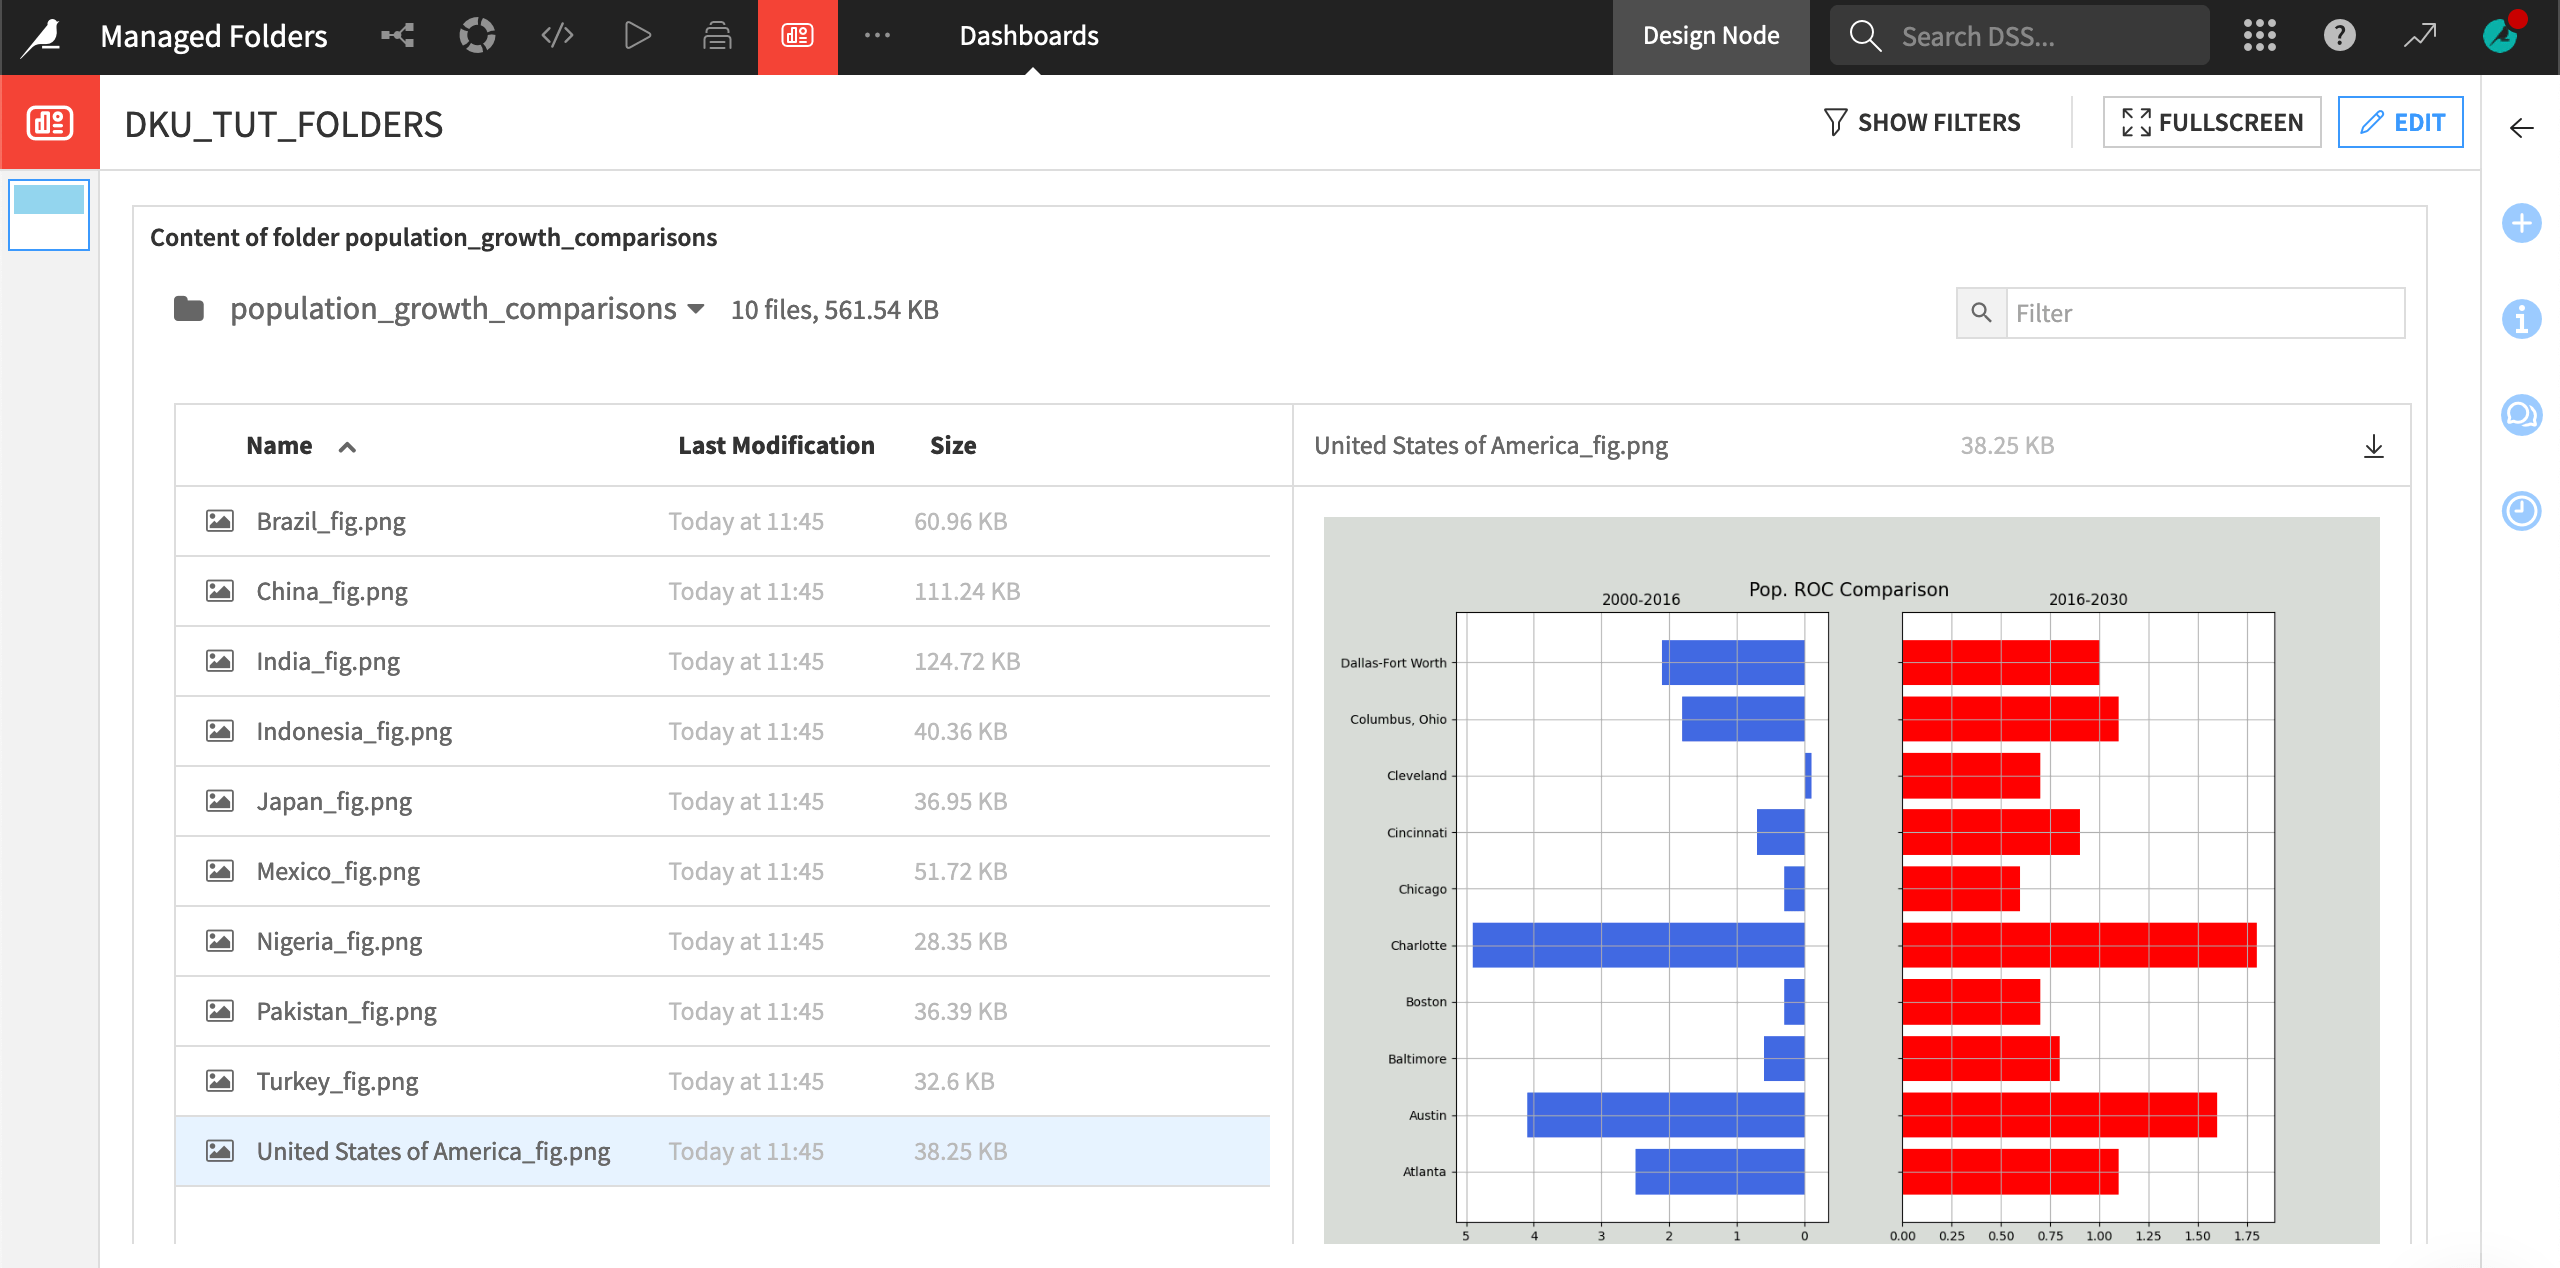
Publish a managed folder insight#
In the population_growth_comparisons folder, you can browse the files to view the chart for each country.
In some cases, you might automate the export of the contents of a managed folder to some other location. For this use case though, let’s publish the whole folder as an insight on a dashboard.
From the population_growth_comparisons folder, click Publish > Dashboard in the Actions tab.
Click Create to add it to a dashboard. It may take a minute or two.
Adjust the size of the folder preview on the Edit tab as needed. Click Save.
Navigate to the View tab to interact with the images in the folder.
Next steps#
That’s it! You have successfully demonstrated how to use managed folders as the input and output to code recipes to assist you in handling types of data that Dataiku can’t natively read and/or write.
See also
For more information on managed folders, please visit the reference documentation on Managed folders.