Concept | Flow views#

Watch the video

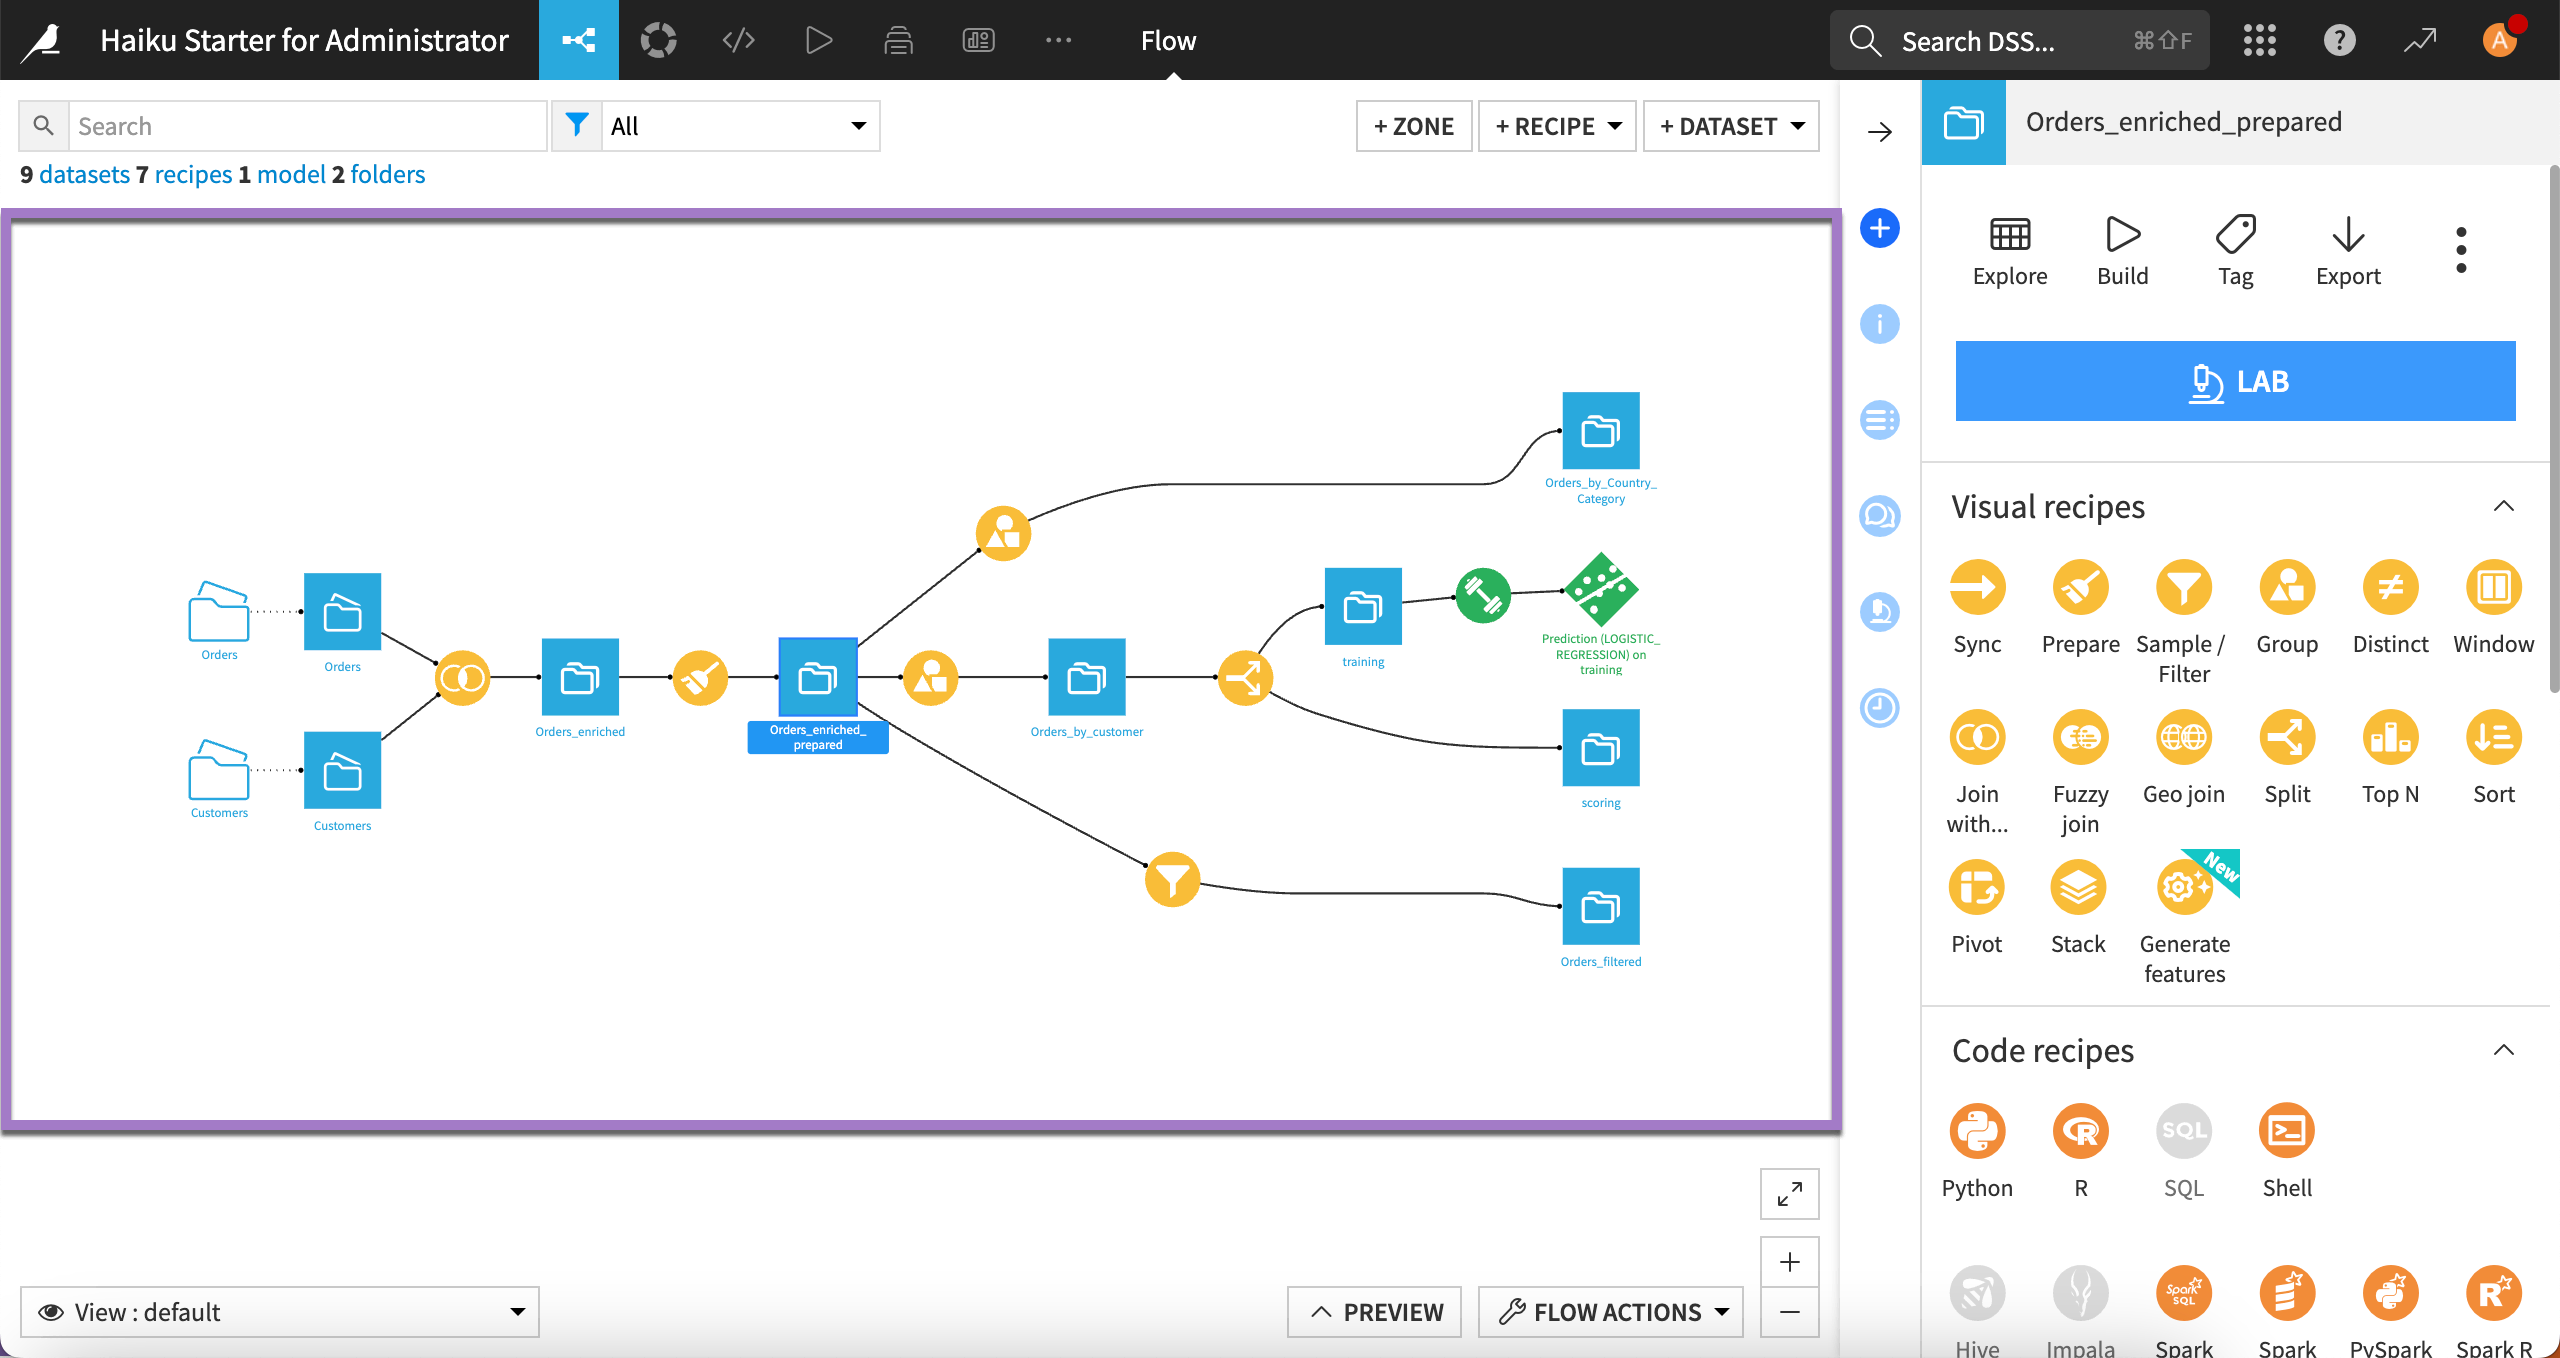
In this lesson, you’ll learn to inspect different details and levels of information about your Flow by using the options from the View menu.

You can access the View menu from the bottom left corner of your flow. Let’s take a look at some of the available view options.

../../_images/view-menu.png

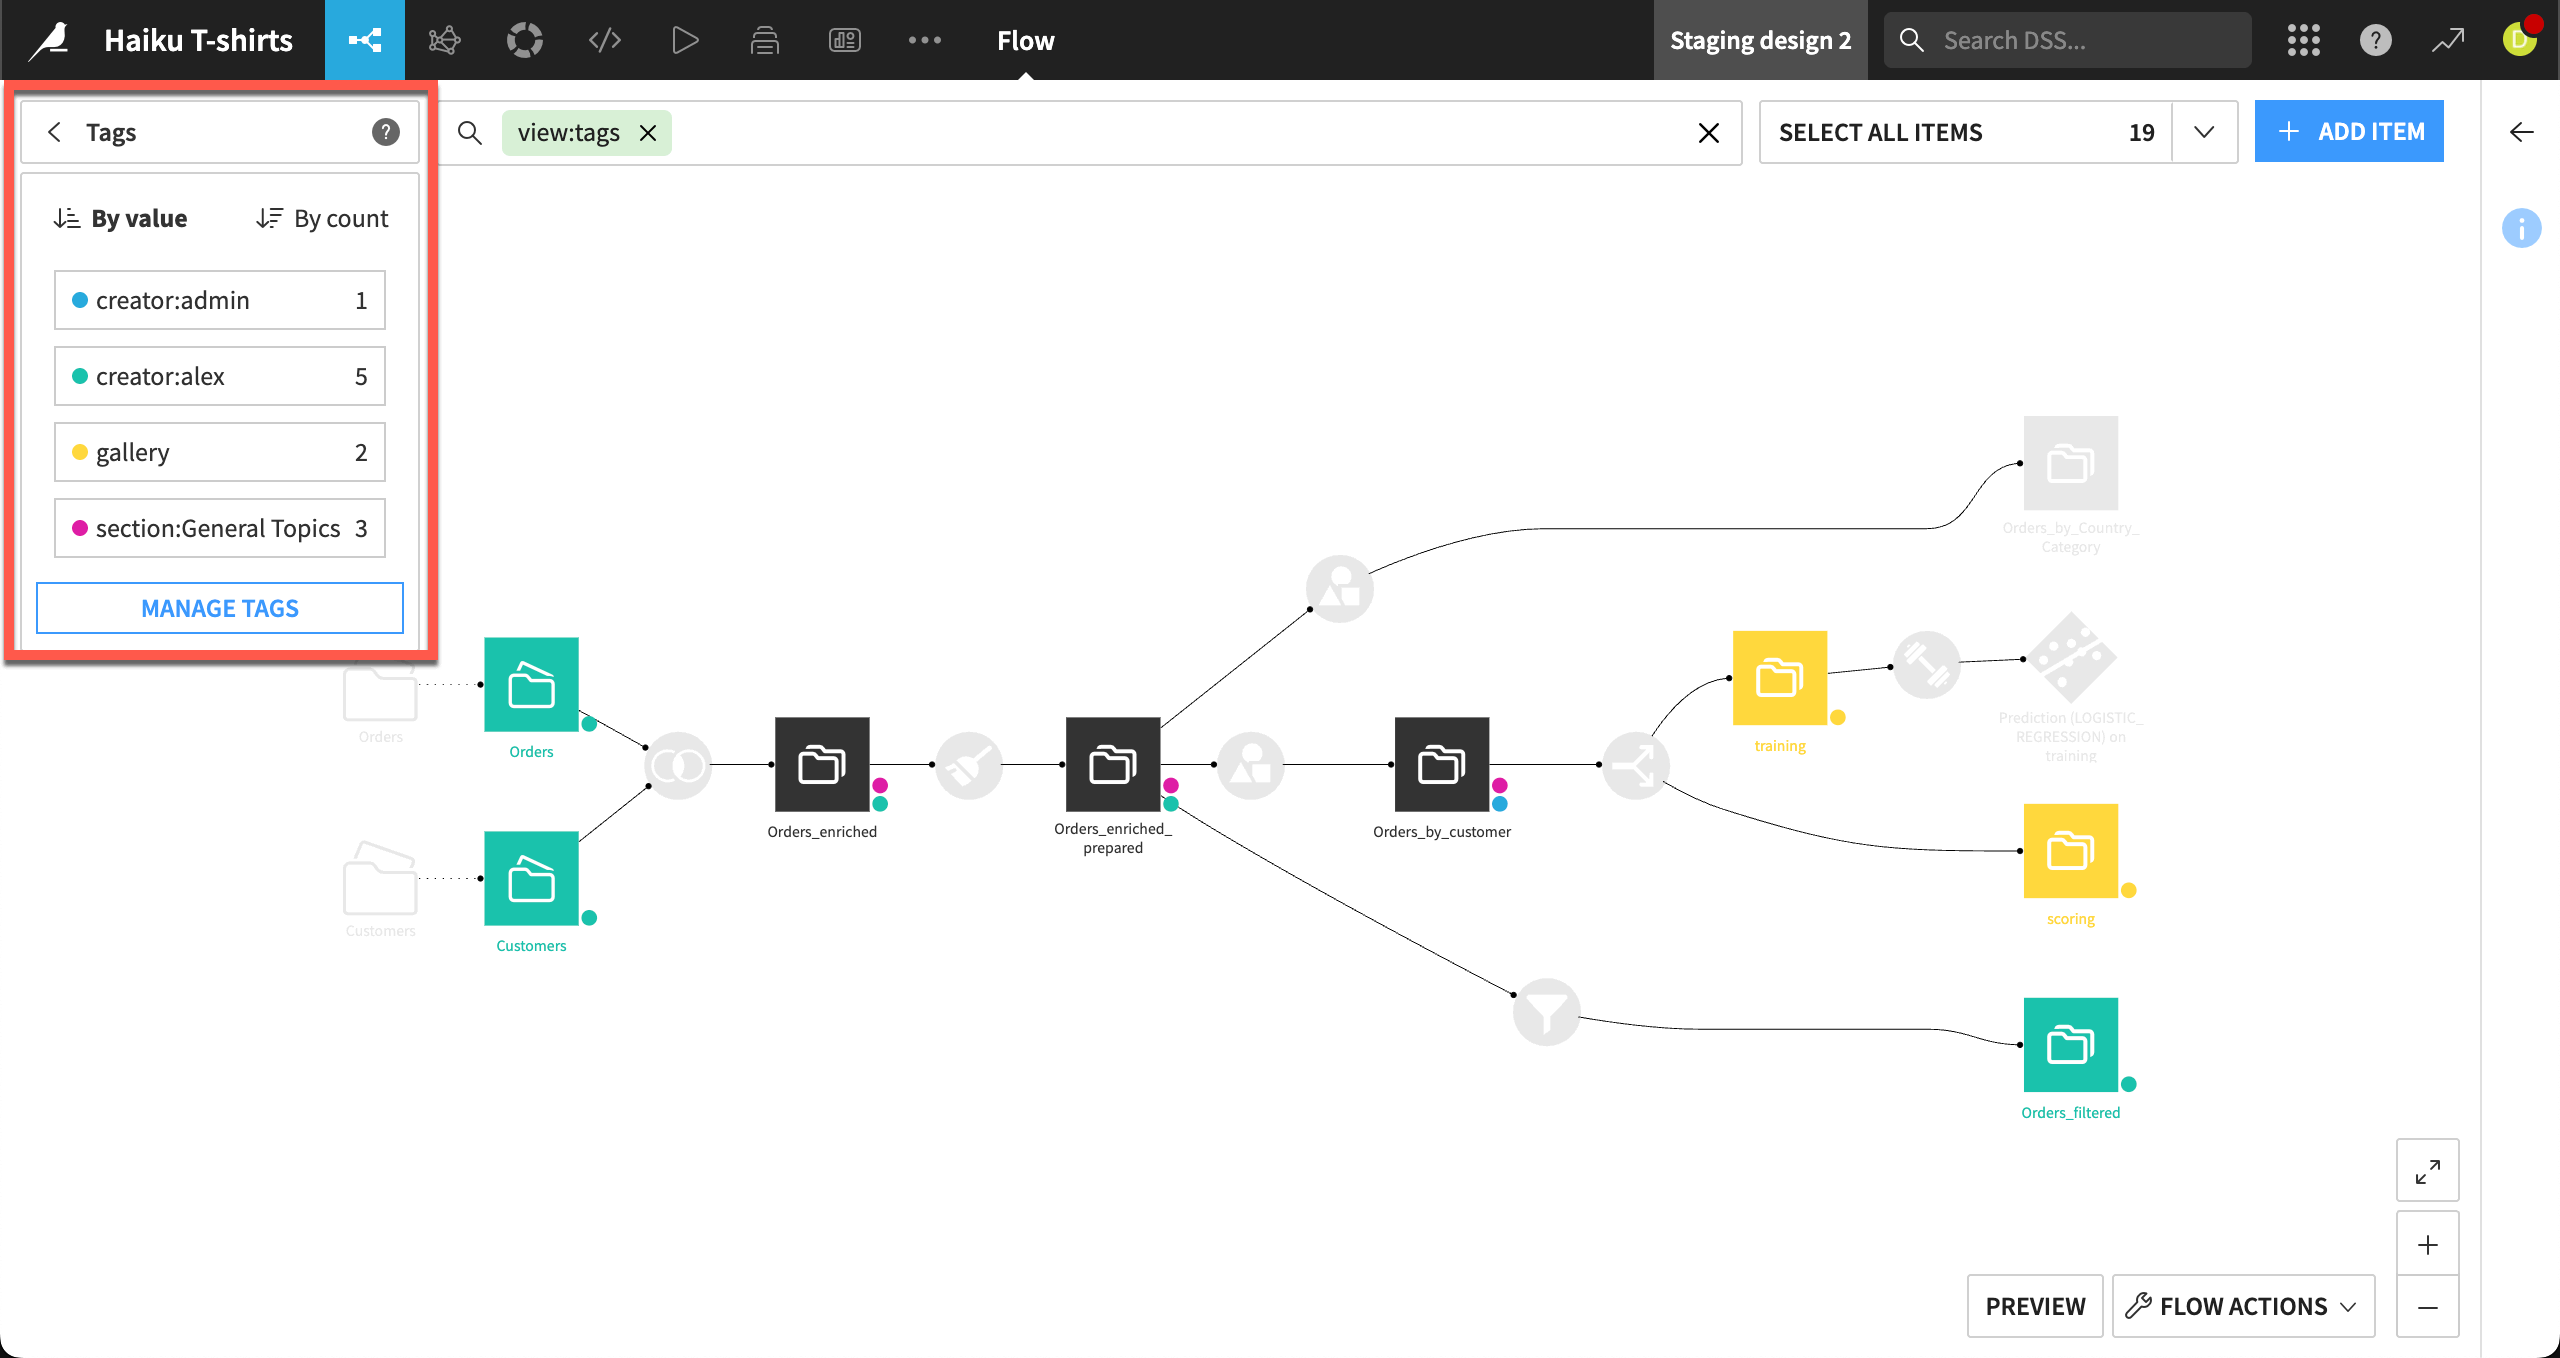
Tags#

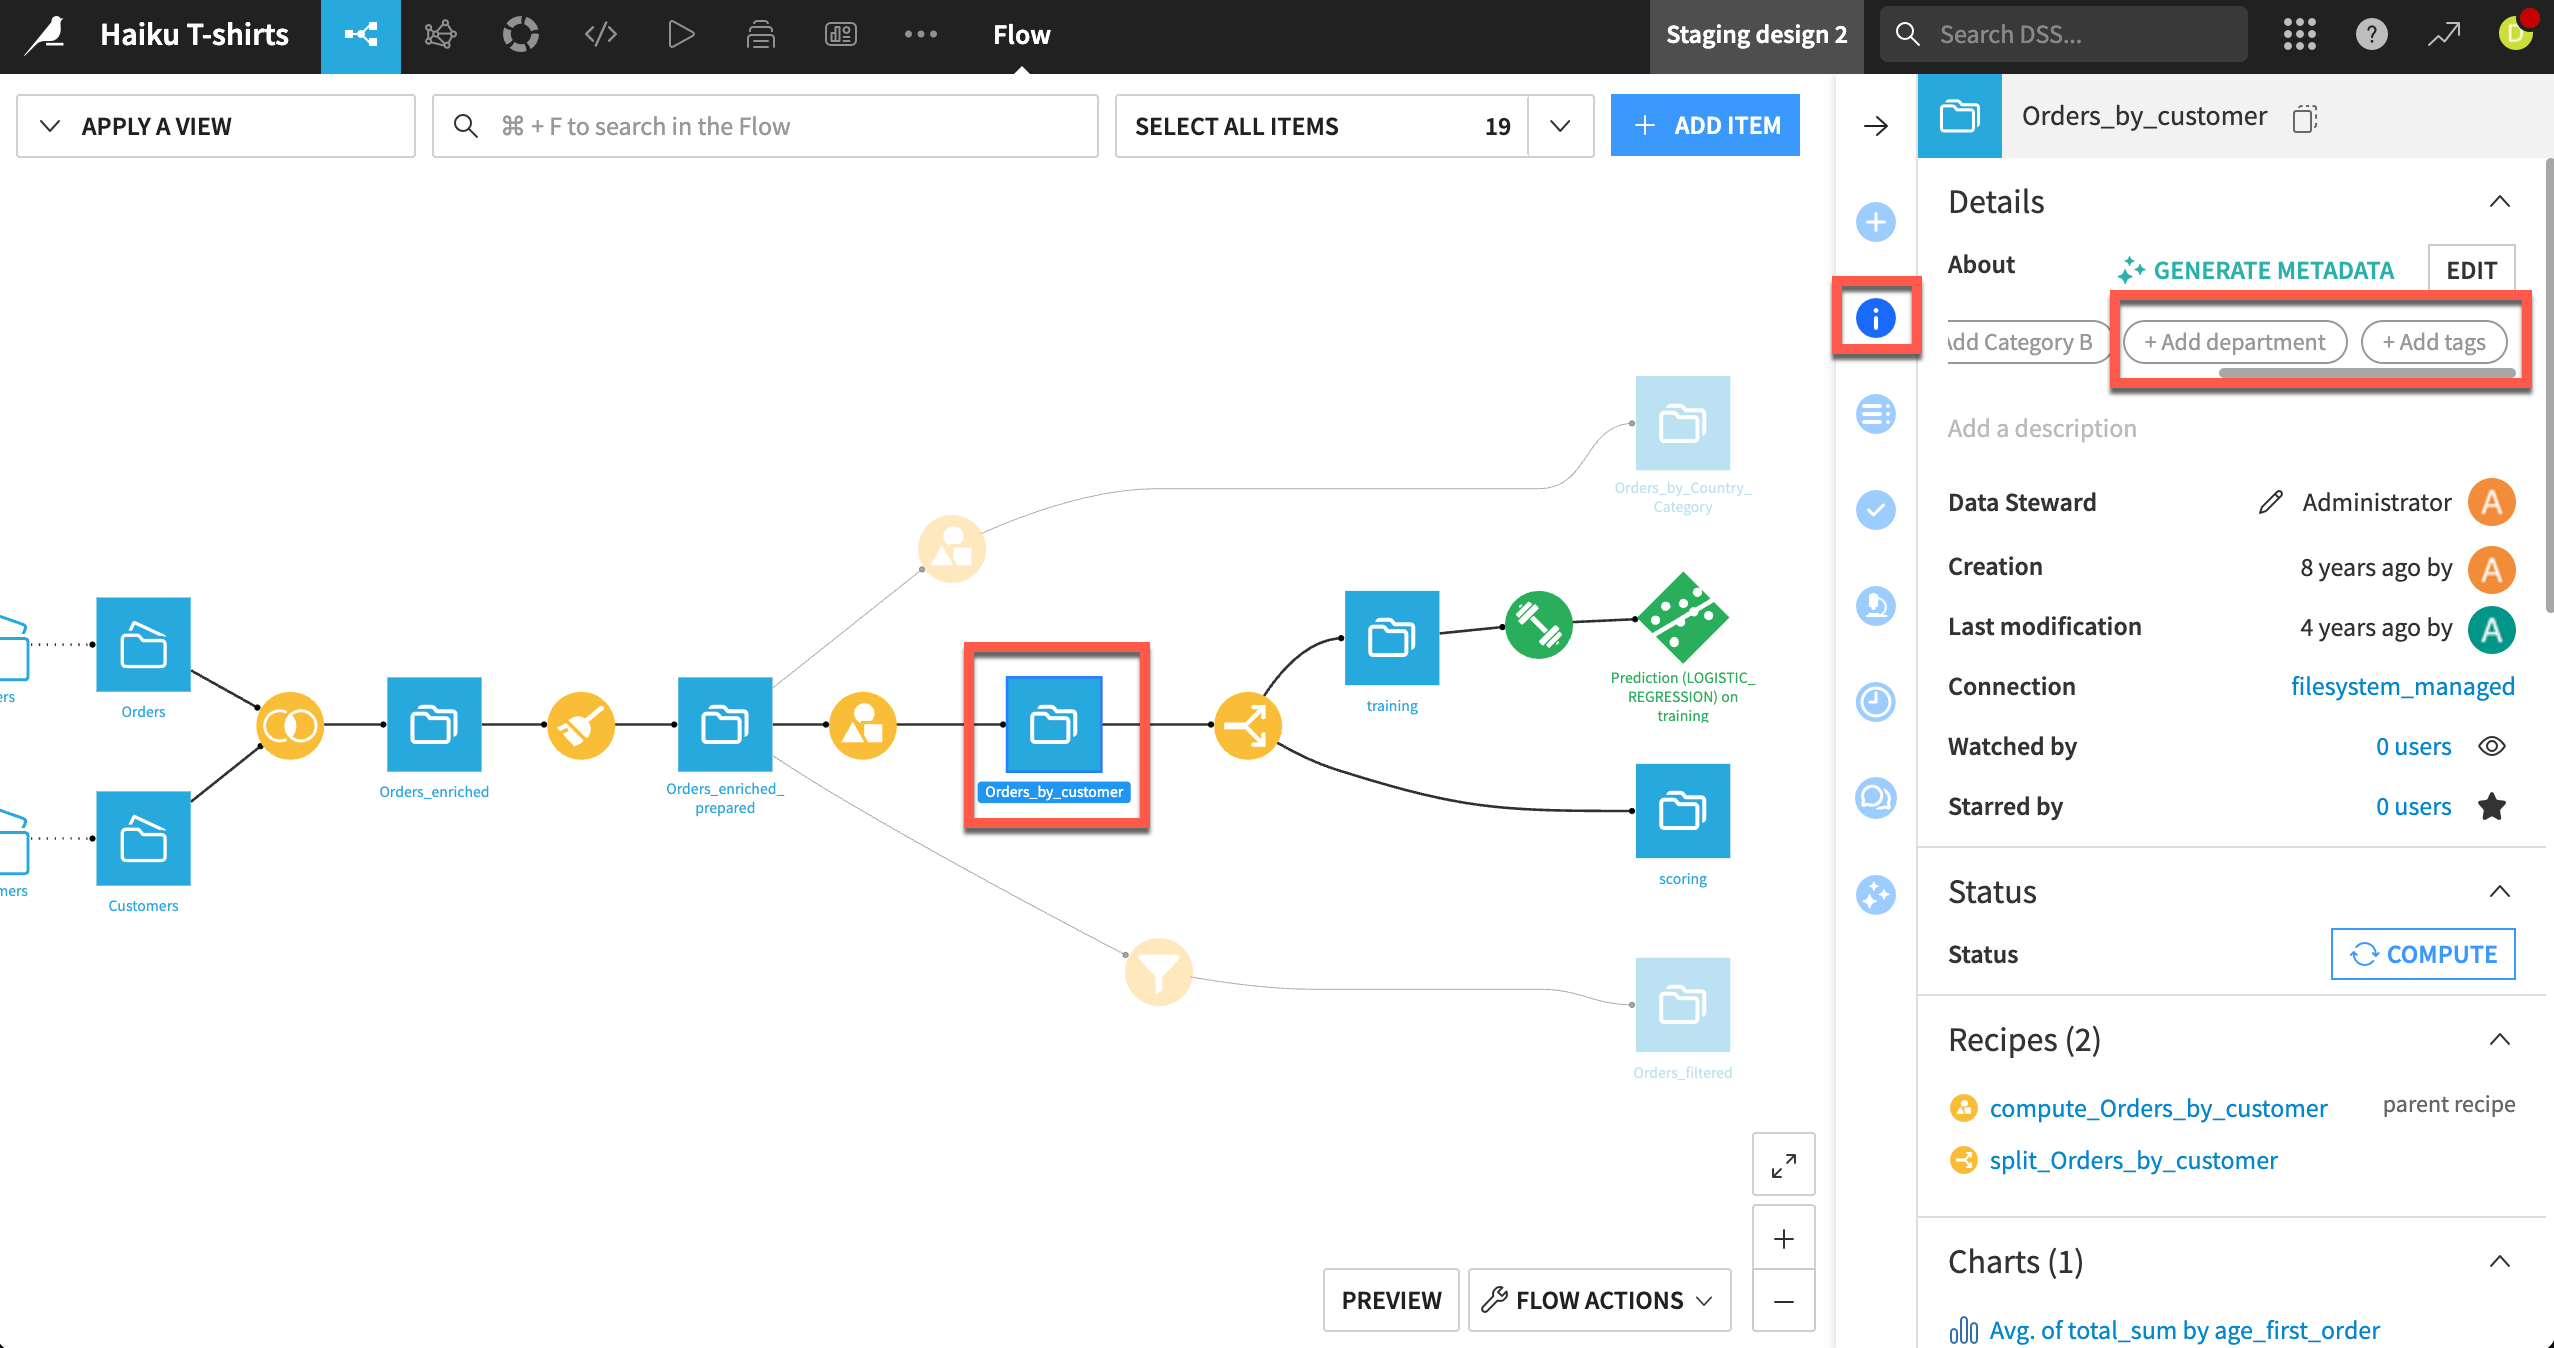
The Tags view lets you see which objects in your Flow are associated with previously-defined tags. Tags help you organize your work and understand the purpose of objects in your Flow.

In this view, objects with an associated tag are highlighted depending on the selected tags. This view can be particularly helpful for understanding large or complicated Flows or when multiple people are working on the same Flow.

The Manage Tags button is useful for adding or deleting tags from the project.

../../_images/tags.png

Flow zones#

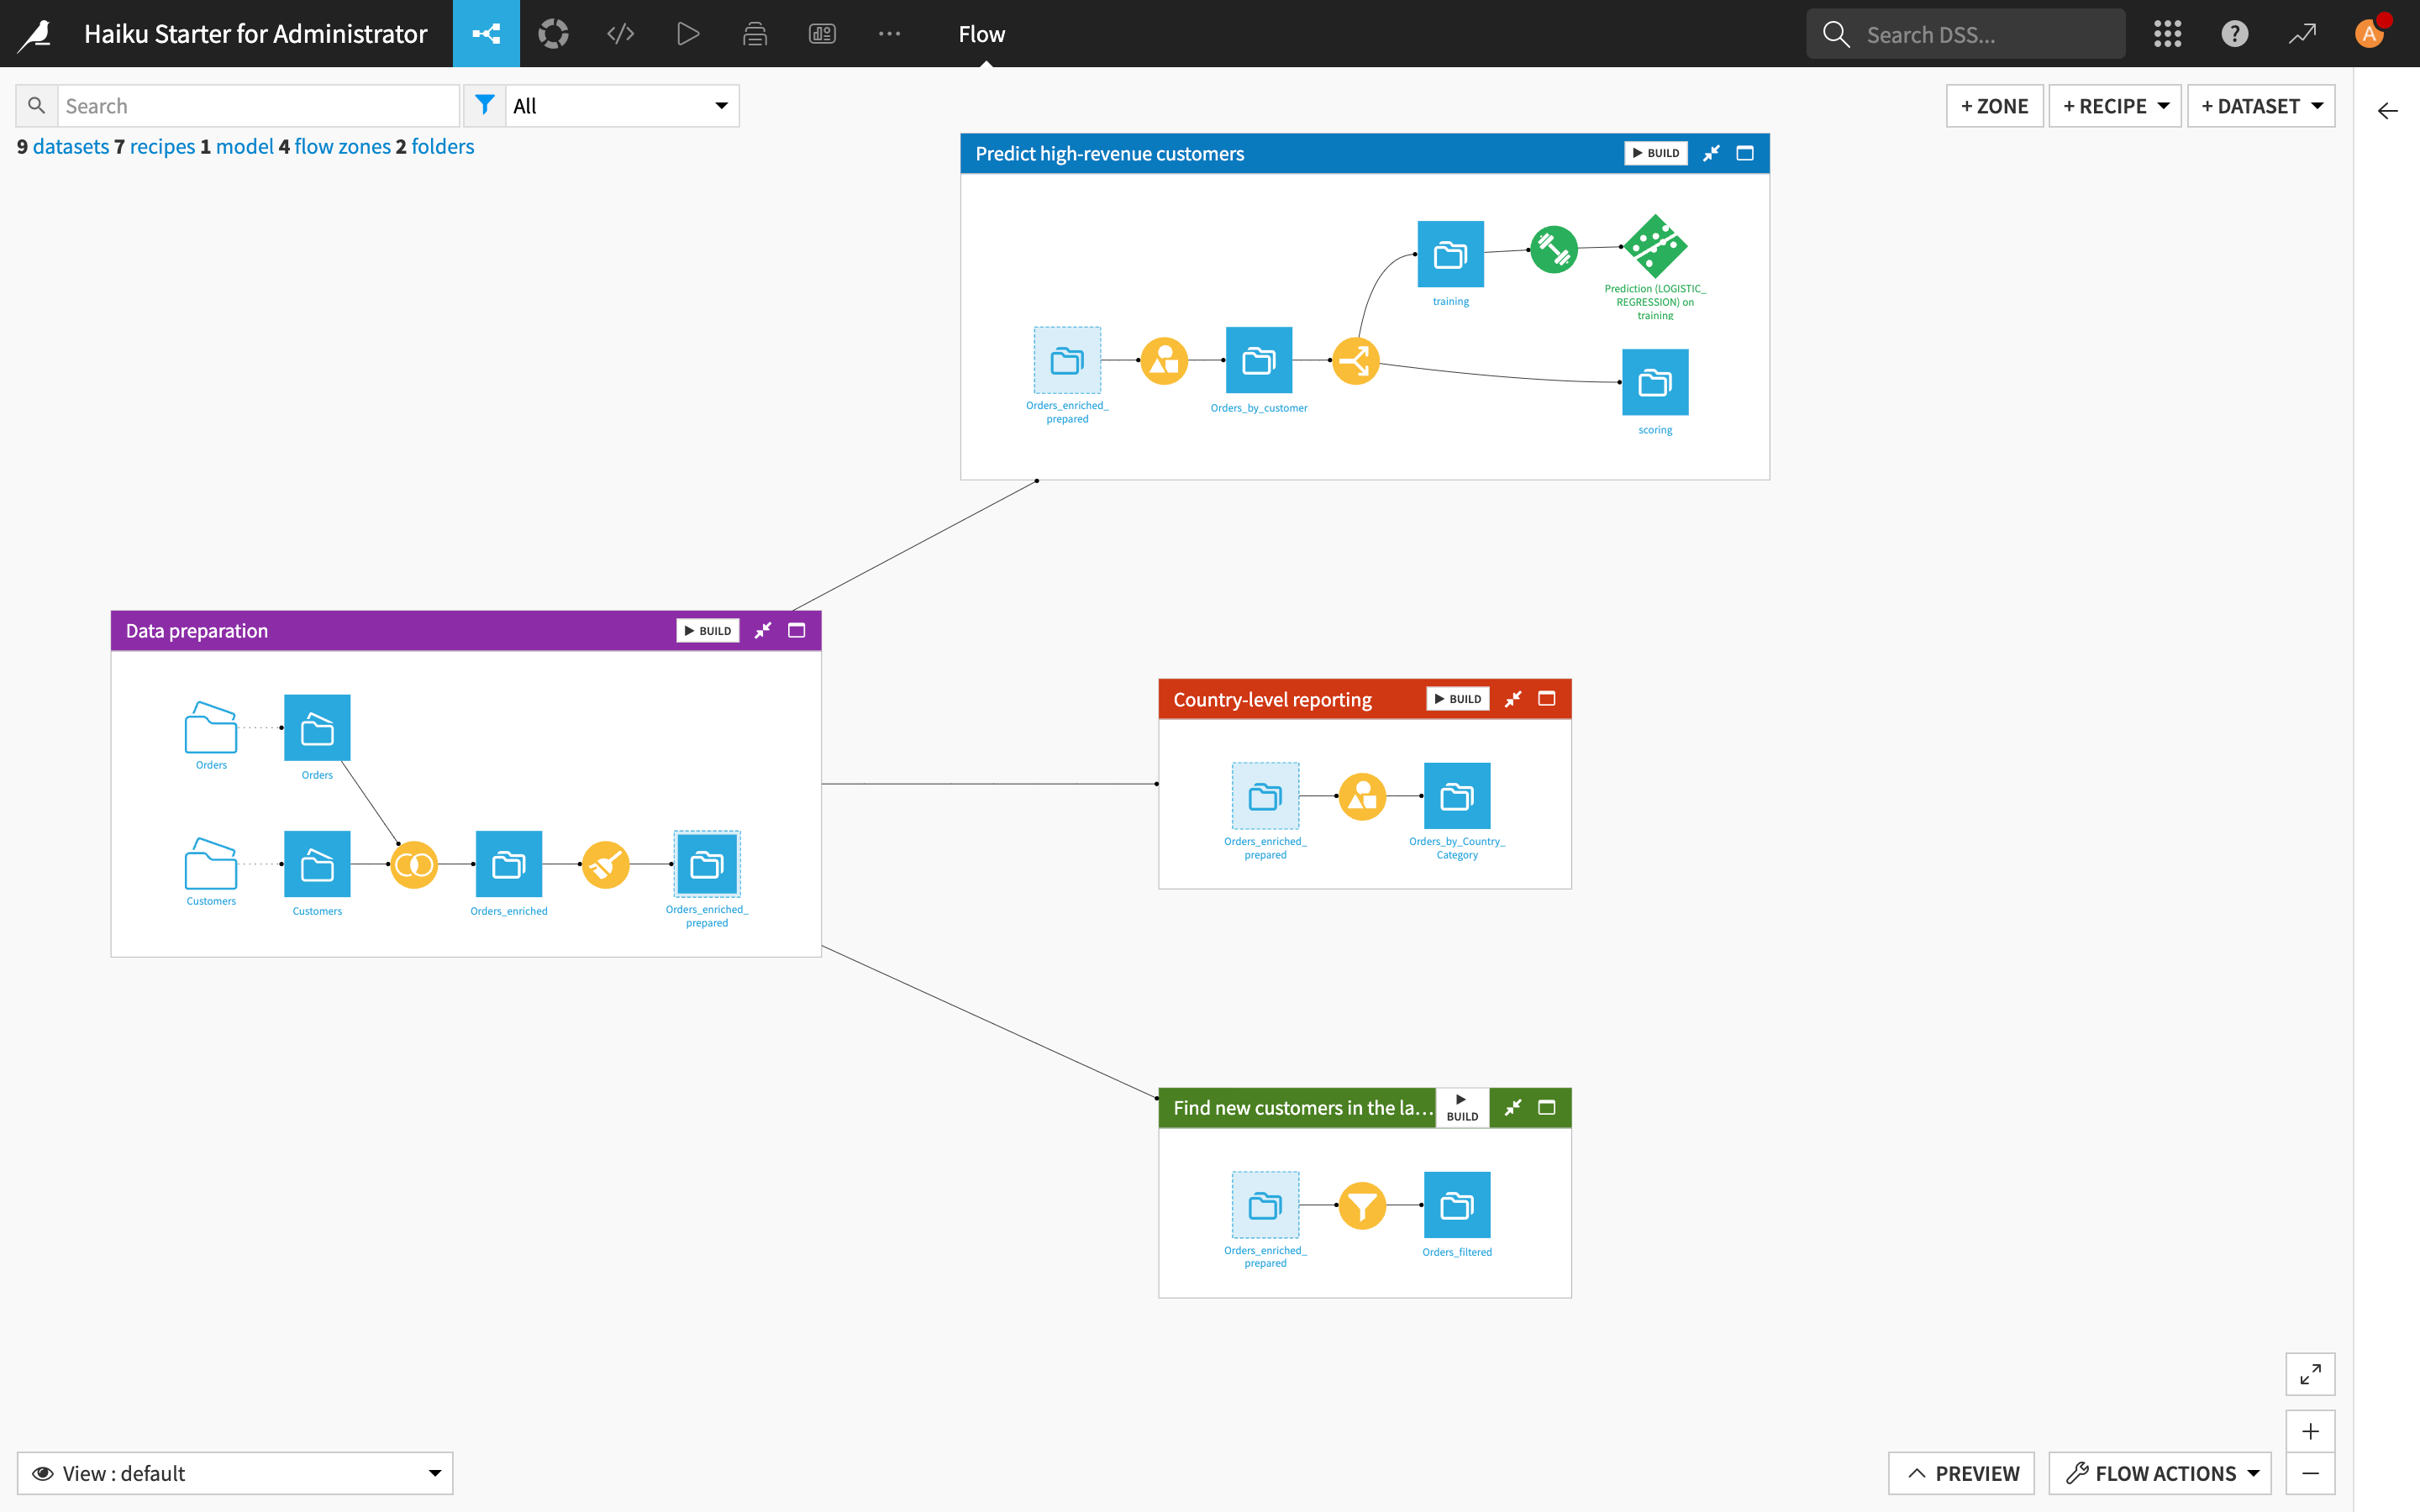
Another useful view for organizing your work and navigating large flows is the Flow zones view. Here, you can view Flow zones in the project and highlight the Flow objects in selected zones.

This view of your Flow can be useful in a situation where you hide all Flow zones, but still want to see which objects are assigned to particular Flow zones.

../../_images/flow-zones.png

Connections#

Next is the Connections view, which shows the connections of datasets in your Flow.

As seen with the previous views, checkboxes allow you to filter the view — in this case, by connection names, to see the particular datasets on those connections.

../../_images/connections.png

Recipe engines#

The Recipe engines option shows you what kinds of computation engines are used in the Flow’s recipes.

Together with the Connections view, you can get an idea of how to optimize the computation engines used in the Flow. For example, you’ll often want to ensure that if a dataset uses an SQL database connection, its corresponding recipe runs on an SQL in-database engine.

../../_images/recipe-engines.png

Recipe code environments#

Next is the Recipe code environments view, which shows the code environments used in code recipes.

By knowing the required code environments for running recipes in the project, you can ensure that an export of the project is uploaded to a Dataiku instance which has equivalent code environments.

../../_images/code-envs.png

Creation#

Moving on to the “Activity” category, the options here allow you to view the Flow with details of its activity history. Looking at the Creation view, you can see when each object was first created and customize the view based on specific timelines.

By displaying the view by user, you can see which user created each object in the Flow.

../../_images/creation.png

Last modification#

The Last modification view can provide even more useful information when working in a team. If a team member changes the settings of a recipe, they won’t be visible from the Flow. But, using the Last modification view, you can check for modification activities whenever you first open up your project.

As with the Creation view, you can customize your view by dates or by users.

../../_images/last-modification.png

Last build#

Next, the Last build view is useful for checking if each dataset is up-to-date. For instance, seeing that a recipe’s input dataset was built in the past 24 hours, but its output dataset was built in the “past month” can alert you to an outdated dataset in the Flow.

../../_images/last-build.png

Recent modifications#

Recent modifications shows you how many modifications have been made since a reference date.

The number on the left side indicates how many times the objects were modified since the reference date, while the number on the right side indicates the number of objects to which the modifications were applied.

For example, we see that eleven modifications were made to two objects since December 7th, 2020.

../../_images/recent-modifications.png

Scenarios#

The Scenarios view is helpful for identifying objects in the Flow that are used in scenarios.

By hovering over an object, Dataiku displays the scenario steps where the object is used.

../../_images/scenarios.png

Partitioning schemes#

Moving to the “Data” category, we see several options for viewing information about datasets in the Flow. The Partitioning schemes view, for example, identifies datasets that are partitioned and their partitioning schemes. To learn more about partitions, see Working with partitions.

../../_images/partitioning-schemes1.png

Partitions counts#

With Partitions count, you can see how many partitions are built for the partitioned datasets. Here, the number on the left side indicates the number of partitions, and the number on the right side indicates the number of corresponding partitioned datasets.

../../_images/partitions-count.png

Count of records#

Count of records displays a heatmap of the range of record counts for datasets in the Flow. Where there is a smaller number of counts, a categorical display is shown. By hovering over a dataset, you can see its actual number of rows along with information, such as the last time it was computed.

../../_images/count-of-records.png

Note

You also have the option to compute the all records count or the missing records count.

../../_images/compute-records.png

File size#

Using the information from the “Count of records” view with the File size view, you can get an idea of which parts of the data pipeline would be slower to build, and use this information to refactor your Flow accordingly.

../../_images/file-size.png

File format#

The File format option shows you the format used to store datasets in the Flow. Using this view and the “Connections” view can help you know where to optimize the Flow.

For example, by ensuring that datasets using an HDFS connection are stored in parquet format, rather than CSV format, where appropriate.

../../_images/file-format.png

Column usage#

The Column usage option allows you to search for datasets in your Flow that contain certain columns, which you can specify in the Add column box.

../../_images/column-usage.png

Data quality#

Finally, the Data quality view allows you to view datasets by their status according to data quality rules you have set up. Monitored datasets are colored either green (OK), yellow (Warning), red (Error), black (Empty) or gray (Not Computed).

../../_images/data-quality-flow-view.png

What’s next?#

Congrats! Now you’ve seen some of the available Flow views and can get started with using the information they provide to organize your work and optimize your Flow.

Learn more about this in the Advanced Designer learning path.

You can also learn more about the Flow in the reference documentation.