
Understand the project#
See a screencast covering this section’s steps.
First take a moment to understand the goals for this quick start and the data at hand.
Objectives#
Rather than designing new elements like in the other task-based quick starts, this one focuses on how to collaborate with colleagues and use the AI capabilities they have already created as inputs for your own tasks.
In this quick start, you’ll:
Understand a project’s objectives by reviewing the Flow.
Recognize how group assignments impact project security.
Communicate insights with a dashboard.
Run a colleague’s workload by using both an automation scenario and a Dataiku app.
Tip
To check your work, you can review a completed version of this entire project from data preparation through MLOps on the Dataiku gallery.
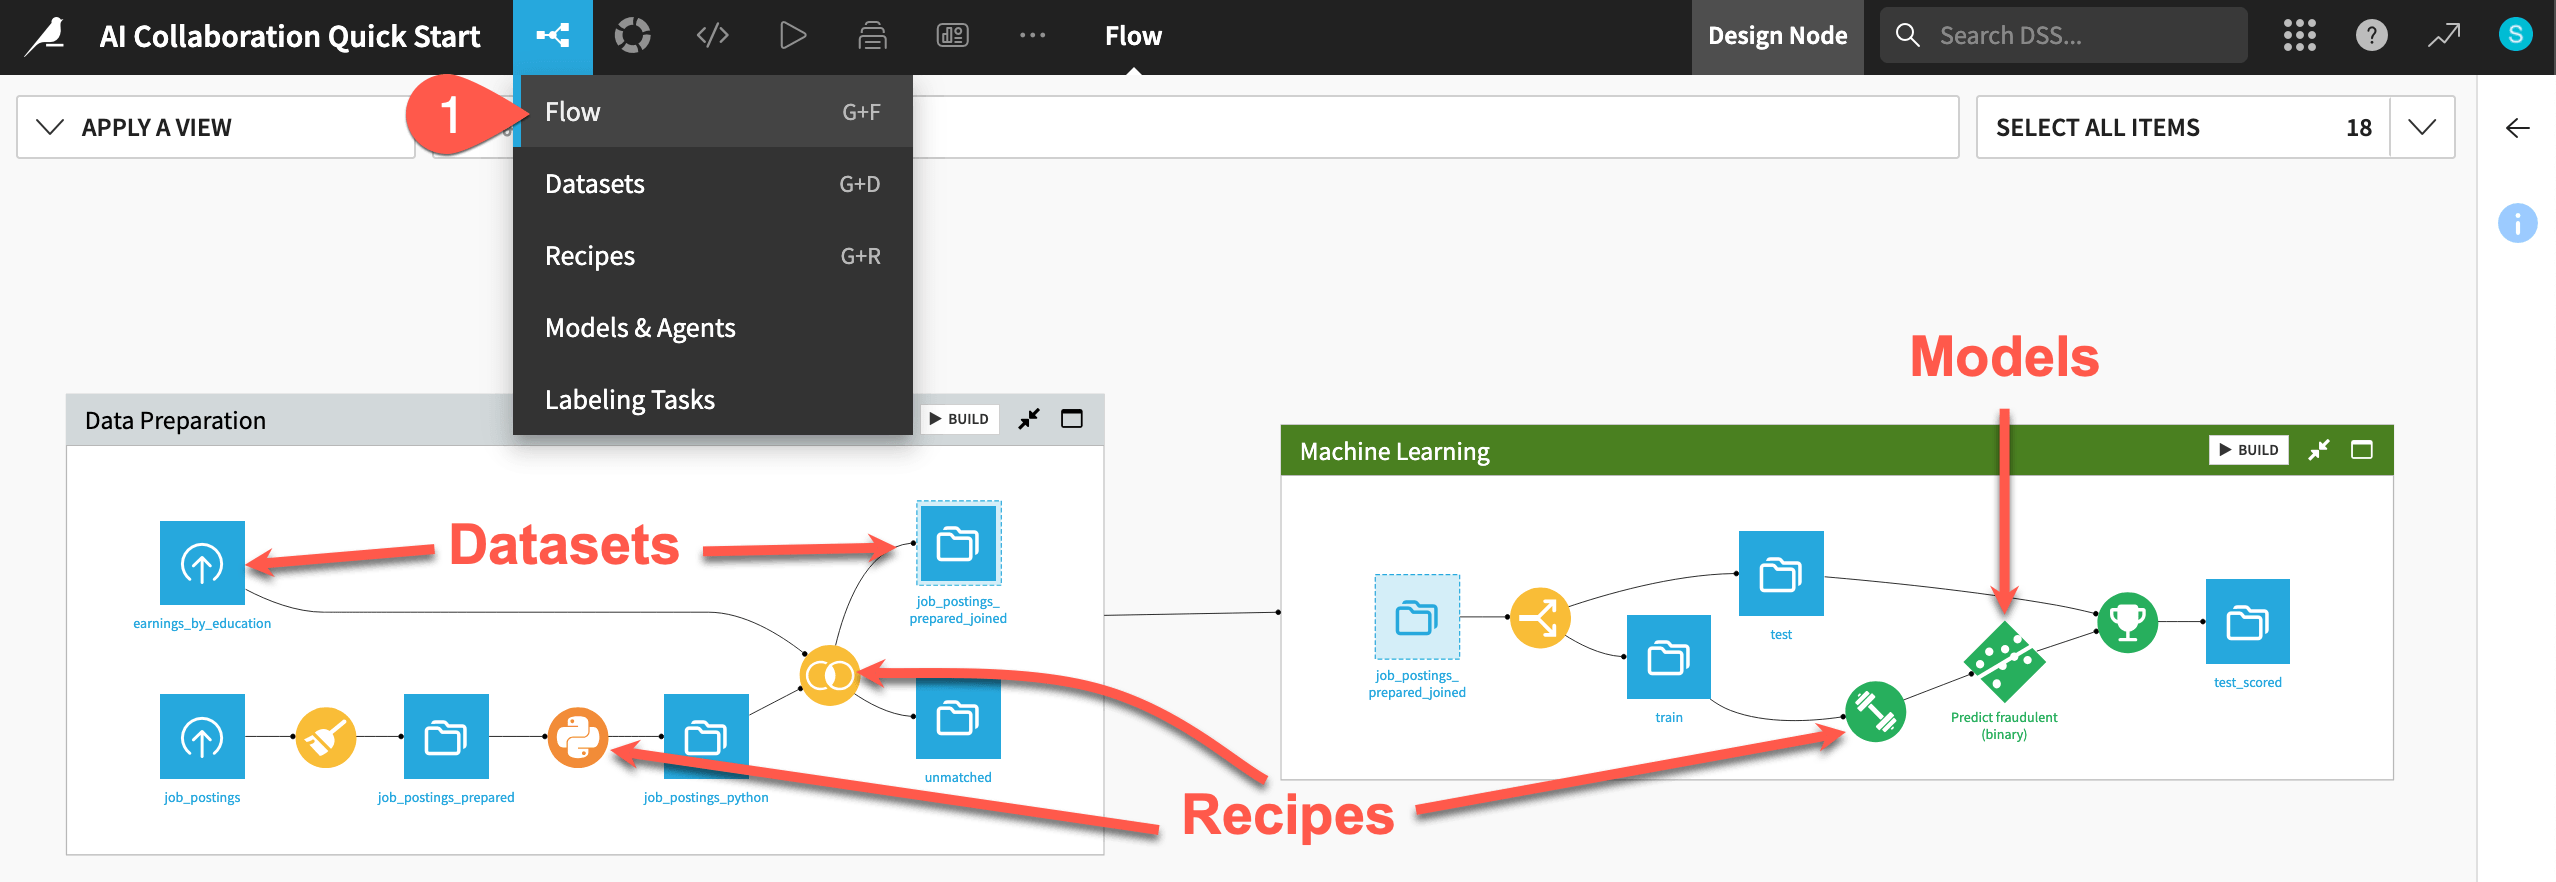
Review the Flow#
One of the first concepts a user needs to understand about Dataiku is the Flow. The Flow is the visual representation of how datasets, recipes (steps for data transformation), models, and agents work together to move data through an analytics pipeline.
Dataiku has its own visual grammar to organize AI and analytics projects in a collaborative way.
Shape |
Item |
Icon |
|---|---|---|

|
Dataset |
The icon on the square represents the dataset’s storage location, such as Amazon S3, Snowflake, PostgreSQL, etc. |

|
Recipe |
The icon on the circle represents the type of data transformation, such as a broom for a Prepare recipe or coiled snakes for a Python recipe. |

|
Model or Agent |
The icon on a diamond represents the type of modeling task (such as prediction, clustering, time series forecasting, etc.) or the type of agent (such as visual or code). |
Tip
In addition to shape, color has meaning too.
Datasets and folders are blue. Those shared from other projects are black.
Visual recipes are yellow.
Code elements are orange.
Machine learning elements are green.
Generative AI and agent elements are pink.
Plugins are often red.
Take a look at the items in the Flow now!
If not already there, from the (
 ) menu in the top navigation bar, select the Flow (or use the keyboard shortcut
 g+f).
Tip
There are many other keyboard shortcuts! Type ? to pull up a menu or see the Accessibility page in the reference documentation.
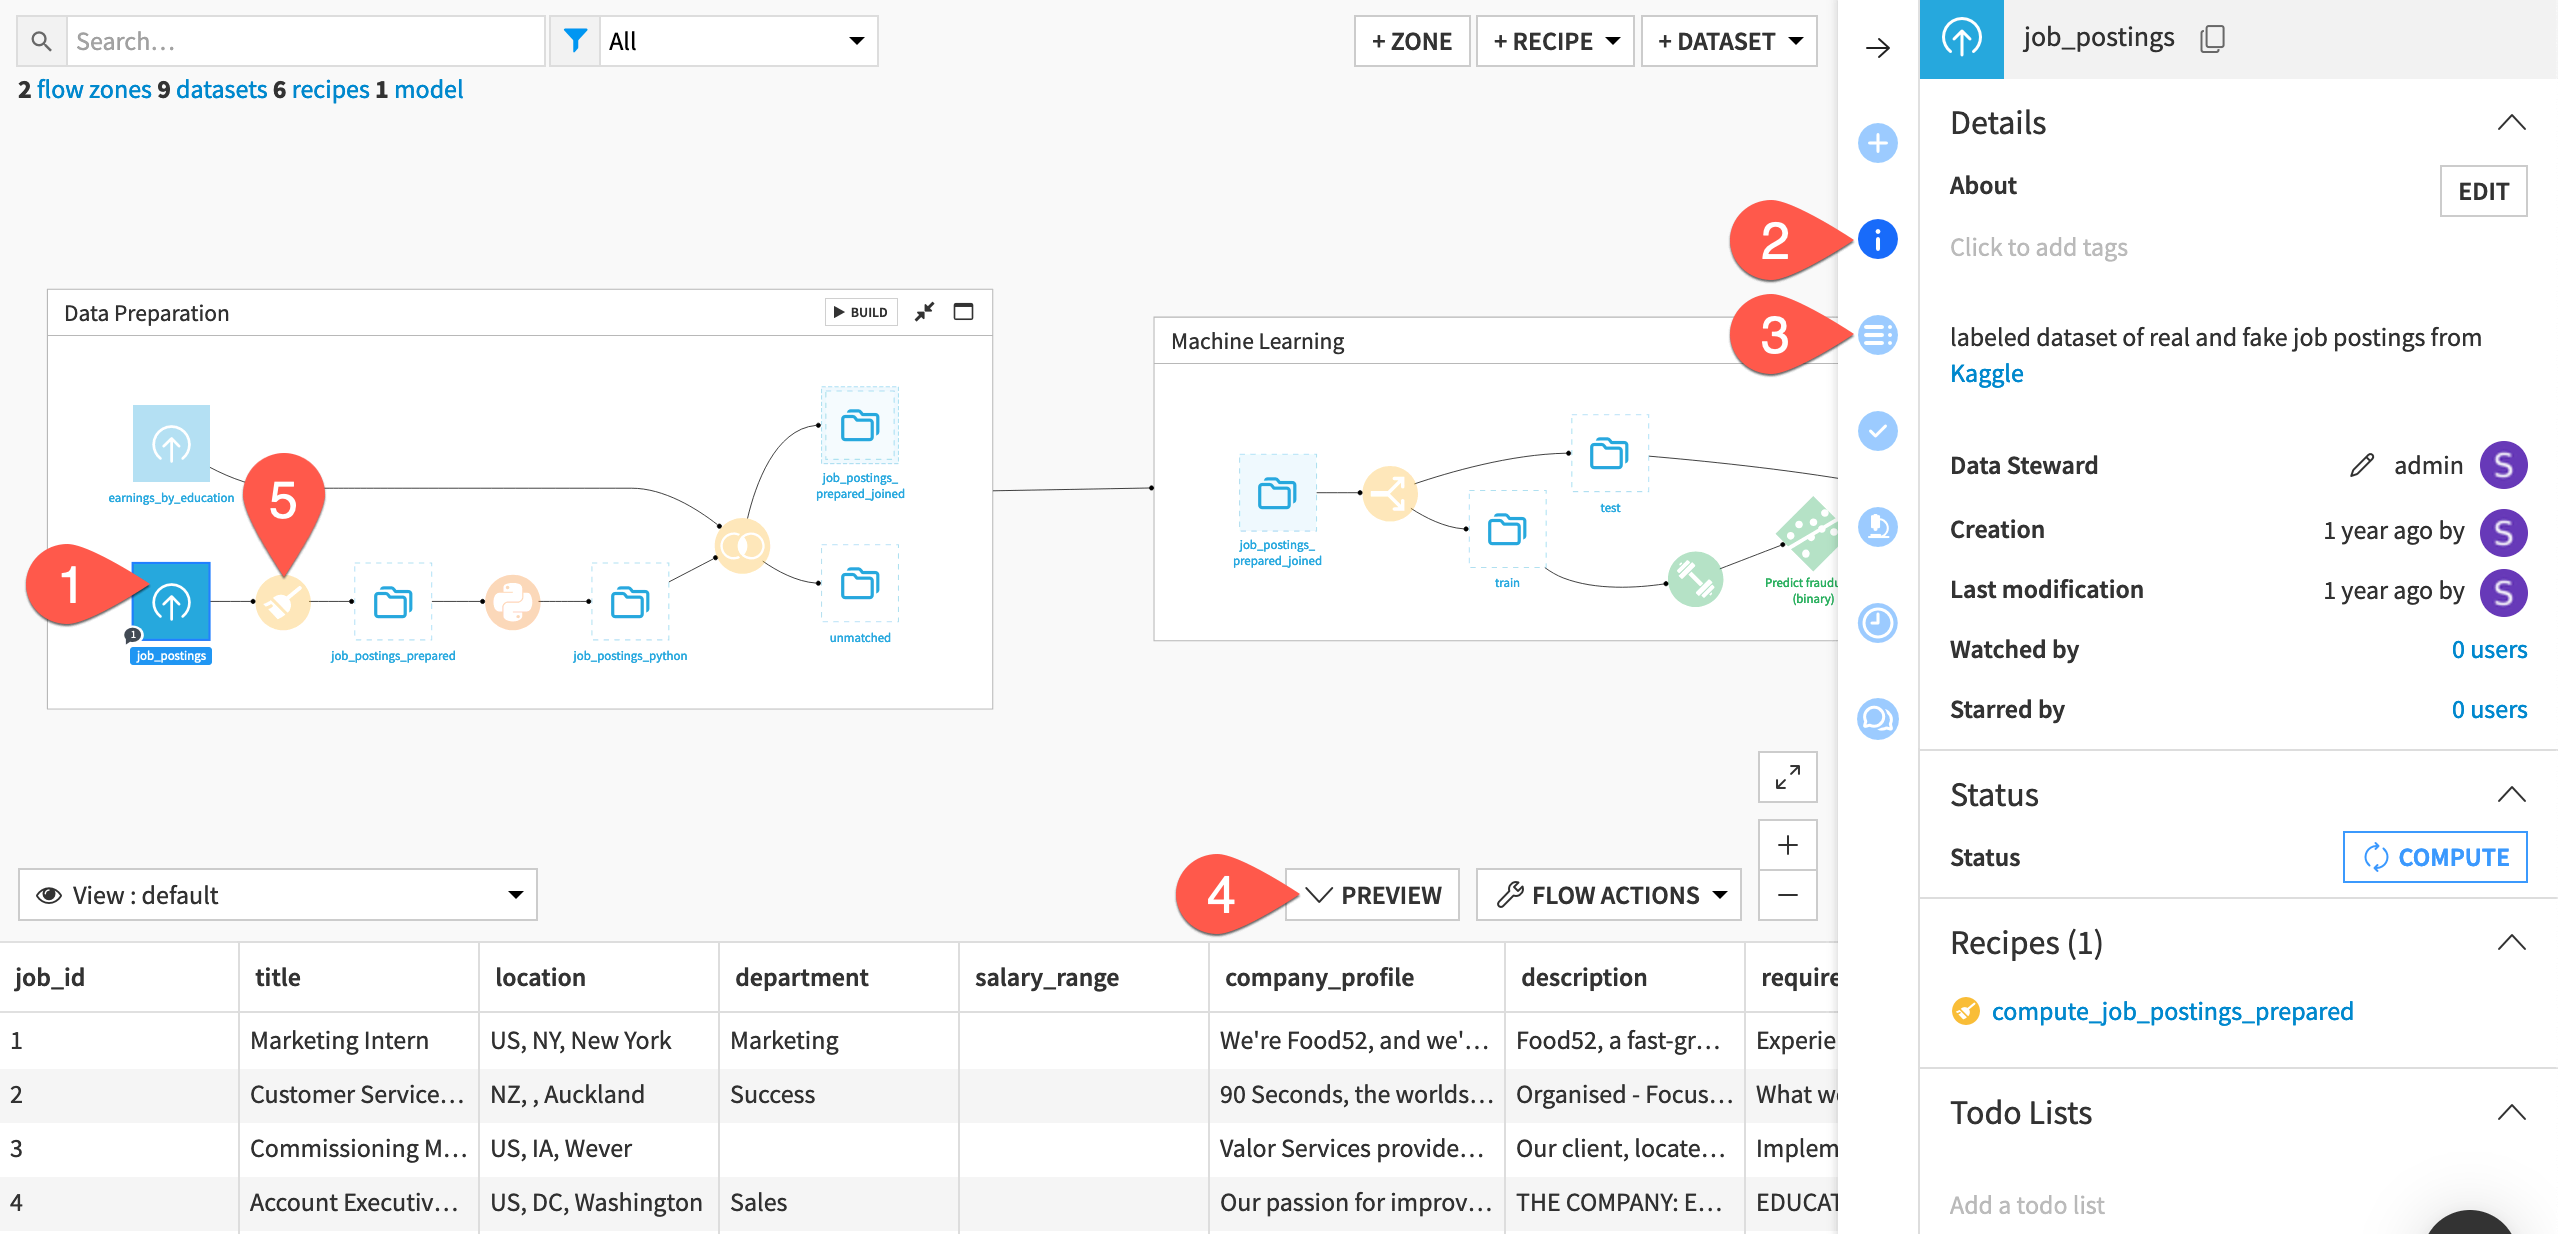
Use the right panel to review an item’s details#
To collaborate on a project, you’ll need to learn what a colleague’s Flow accomplishes. Try to figure out the purpose of this one.
At the far left of the Flow, click once on the job_postings dataset to select it.
Click the Details (
 ) icon in the right panel to review its metadata.
Click the Schema (
 ) icon underneath to see its columns.
Click Preview (or use the keyboard shortcut
Shift+P) to pull up the first few rows of data.Beginning with the Prepare recipe (
 ) at the start of the pipeline, review the recipes that transform the job_postings dataset at the far left to the jobs_sampled dataset at the far right. Click once to select each one, and review the Details () tab to help determine what they do.
See also
For more details on what’s found in the Flow itself, see the other task-based quick starts.
You could read the project’s wiki (use the keyboard shortcut g + w) for more information. However, from only browsing the Flow, you probably already have a good idea of what this project does:
The pipeline starts by preparing some data on job postings.
It then builds a prediction model to classify a job posting as real or fake.
The final zone is the starting point for leveraging large language models (LLMs) on this data.
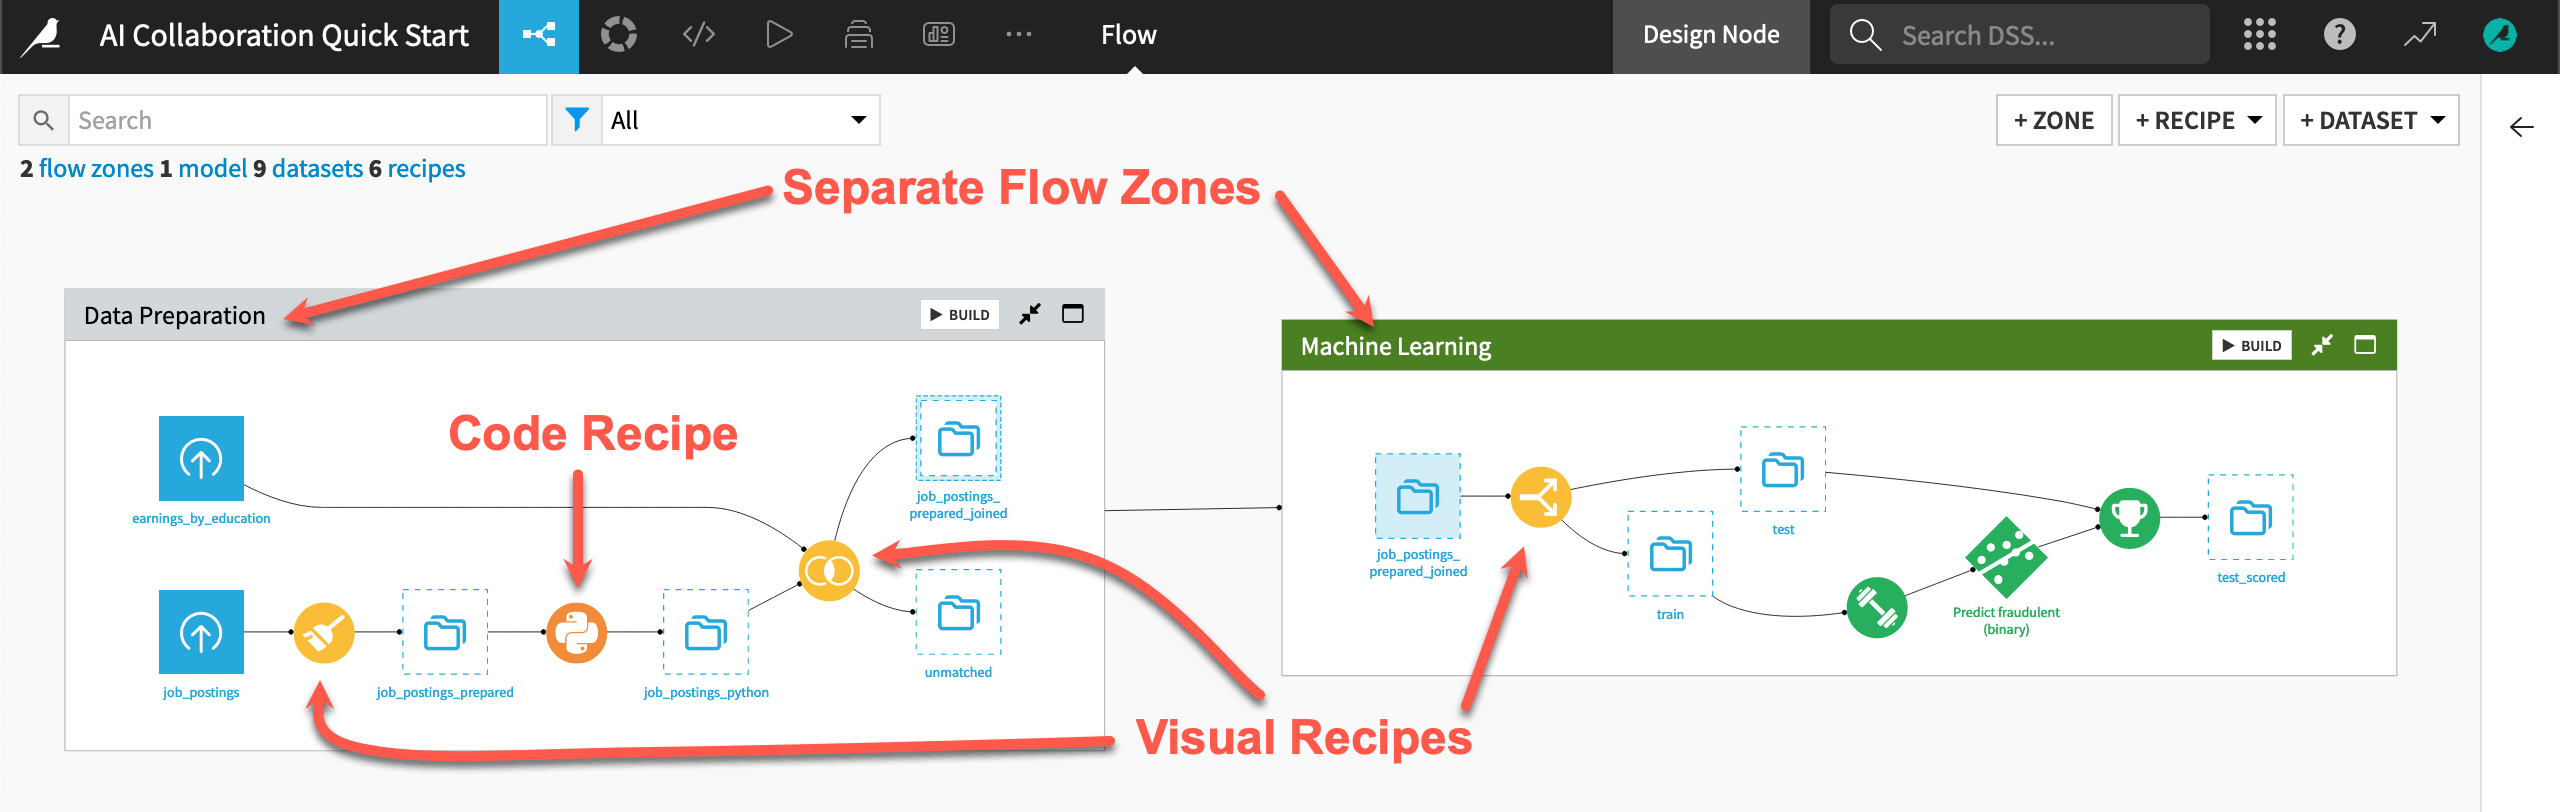
The readability of the Flow eases the challenge of bringing users of diverse skill sets and responsibilities onto the same platform. For example:
The Flow has visual recipes (in yellow) that everyone can understand, but also custom code (in orange).
Interconnected Flow zones divide the Flow. Such zones can be useful for organizing different stages of a project.
Tip
A feature like AI Explain is also a great tool for understanding a colleague’s Flow.
Build the Flow#
Unlike the initial uploaded datasets, the downstream datasets appear as outlines. This is because no one has built them. In other words, no one has run the relevant recipes to populate these datasets. However, this isn’t a problem because the Flow contains the recipes required to create these outputs at any time.
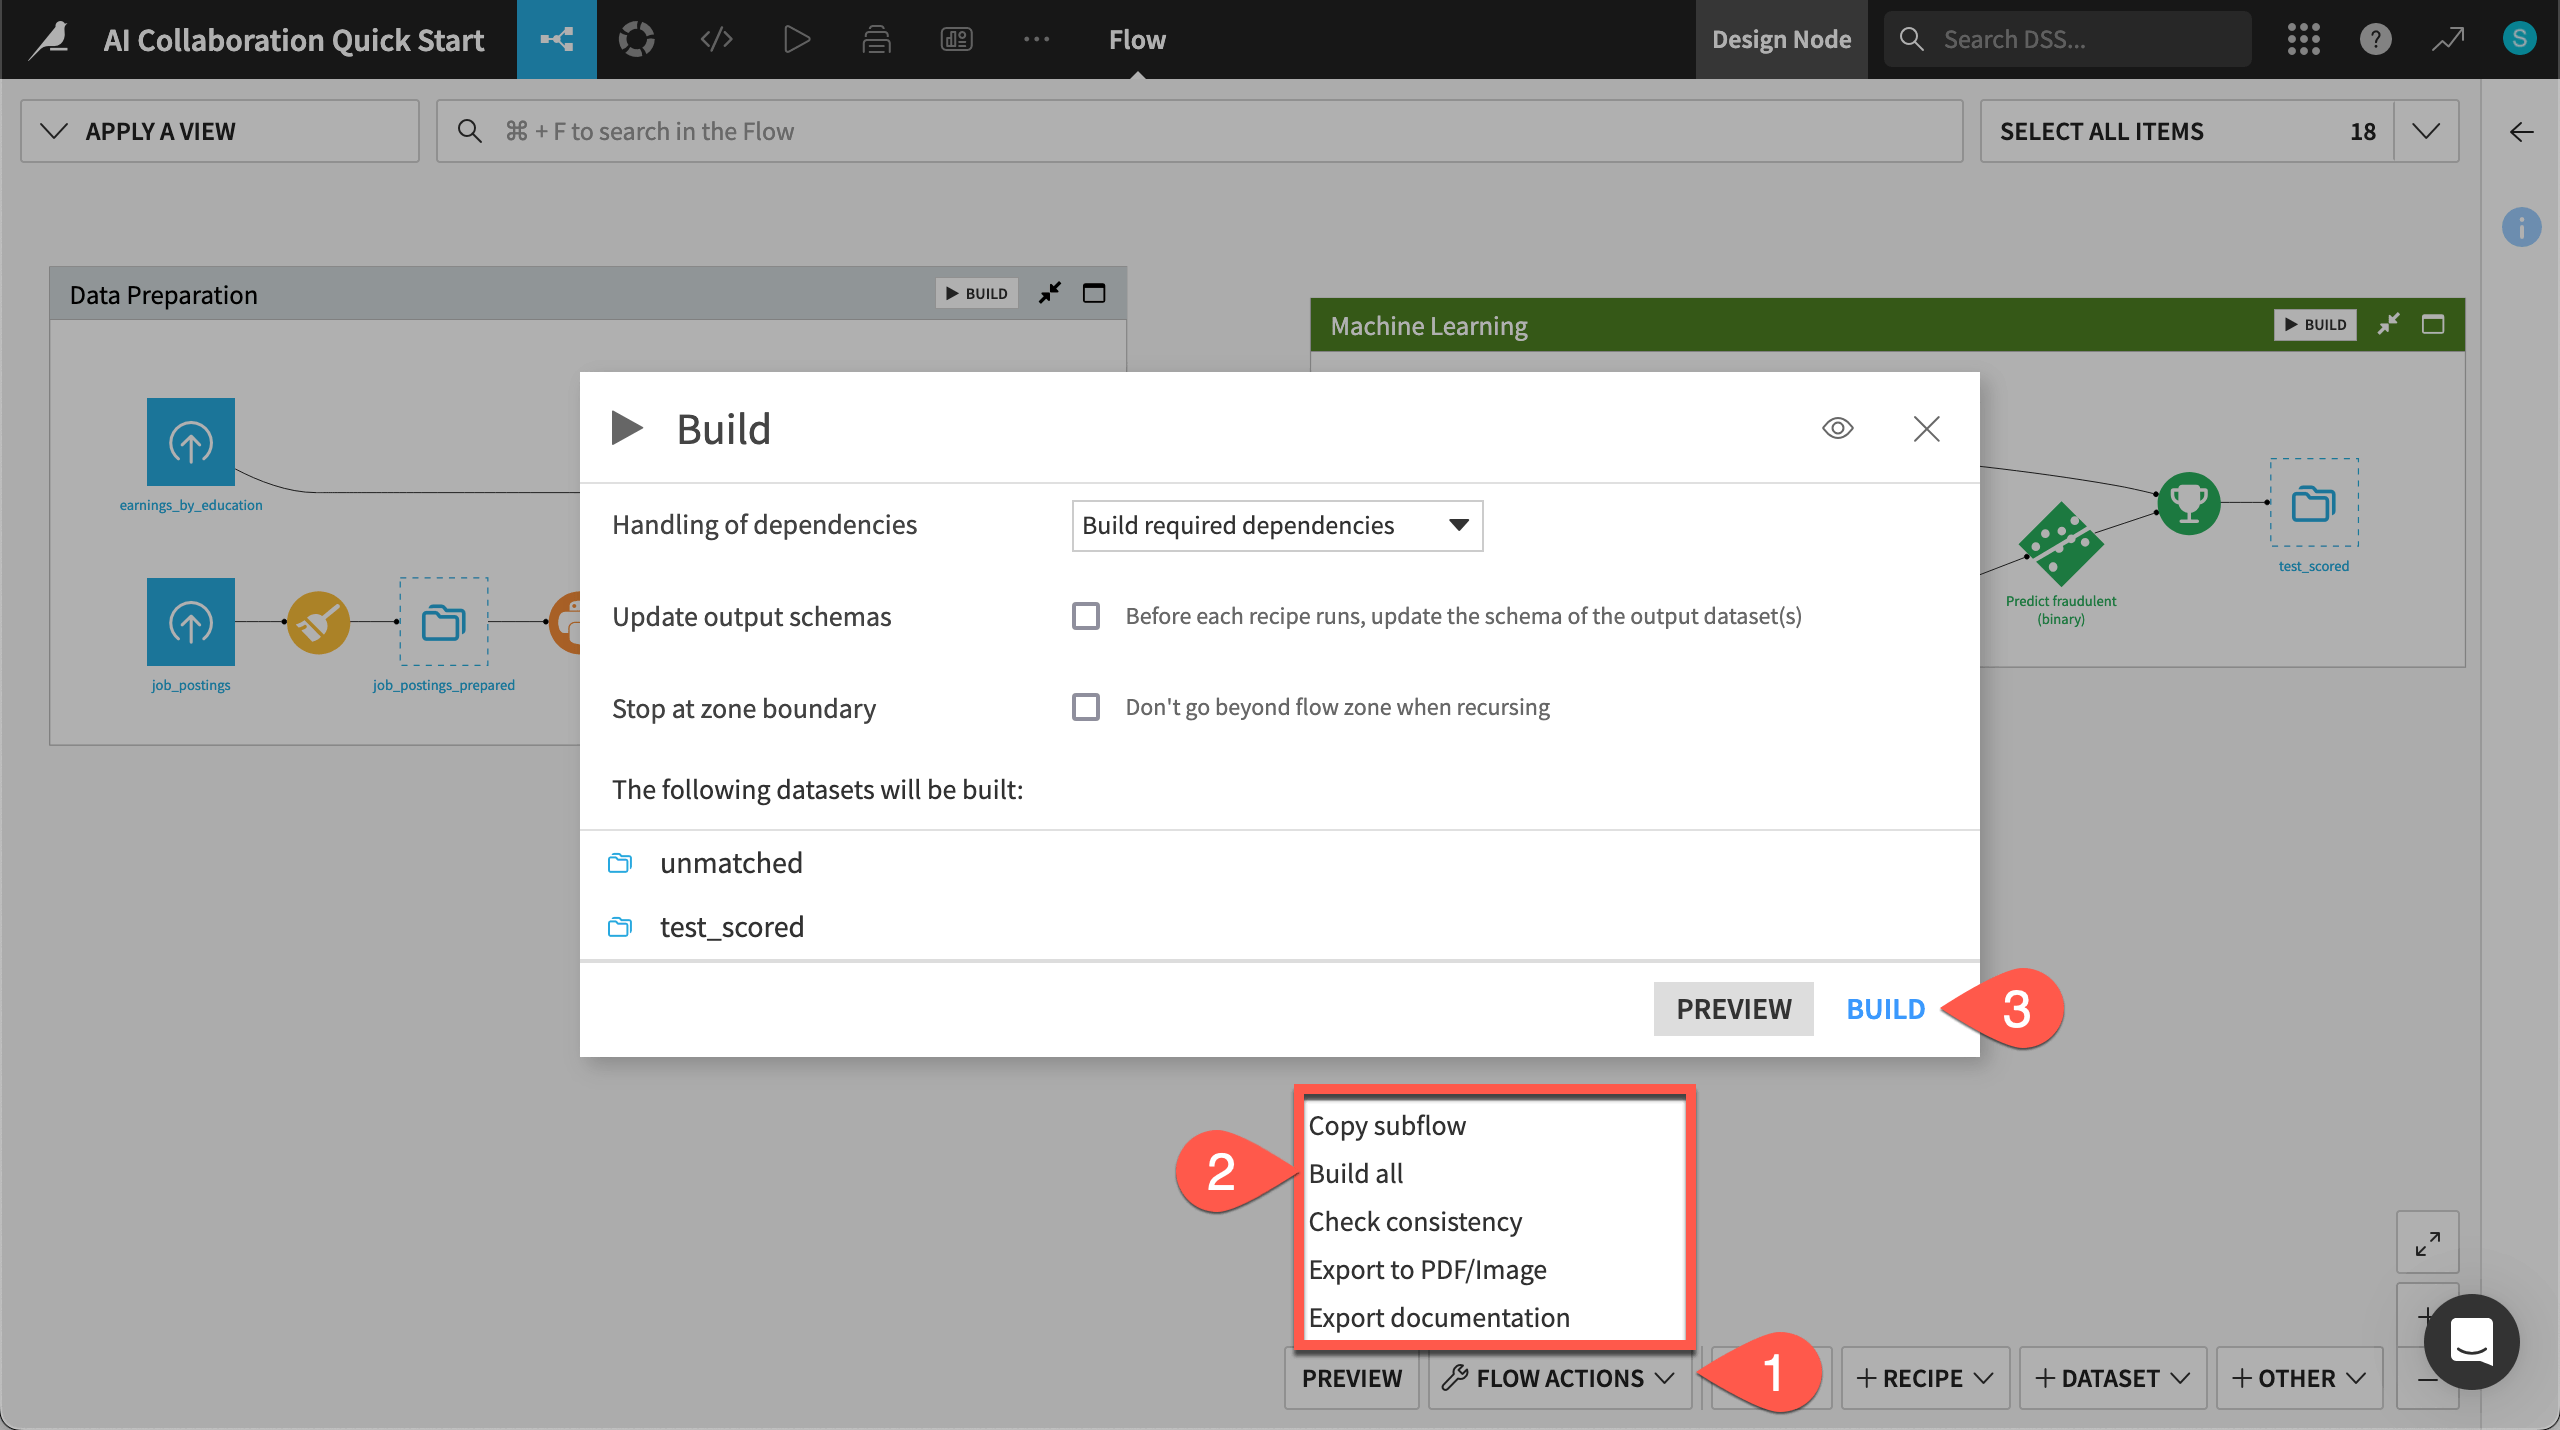
Open the Flow Actions menu.
Click Build all.
Leaving the default options, click Build to run the recipes necessary to create the items furthest downstream.
When the job completes, refresh the page to see the built Flow.